
Aware and Intelligent Infrastructure for Action Intention Recognition of
Cars and Bicycles
Cristofer Englund
1,2
1
Center for Applied Intelligent Systems Research (CAISR), Halmstad University, SE 30118 Halmstad, Sweden
2
RISE Research Institutes of Sweden, Mobility and Systems, Humanized Autonomy, Lindholmspiren 3A,
SE 41756 Goteborg, Sweden
Keywords:
Intention Recognition, Random Forest, Data Mining, Traffic Behavior Modelling, Variable Selection, Aware
Systems.
Abstract:
Action intention recognition is becoming increasingly important in the road vehicle automation domain. Au-
tonomous vehicles must be aware of their surroundings if we are to build safe and efficient transport systems.
This paper explores methods for predicting the action intentions of road users based on an aware and intelli-
gent 3D camera-based sensor system. The collected data contains trajectories of two different scenarios. The
first one includes bicyclists and the second cars that are driving in a road approaching an intersection where
they are either turning or continuing straight. The data acquisition system is used to collect trajectories of the
road users that are used as input for models trained to predict the action intention of the road users.
1 INTRODUCTION
Traffic accidents have become one of the most com-
mon causes of death among young people (World
Health Organization (WHO), 2015). Although fa-
talities have decreased for motorists in most coun-
tries, this is not the case for vulnerable road users
(VRUs), (Niska and Eriksson, 2013) including pedes-
trians, bicyclists and moped riders. With the trend
towards increased vehicle automation, there is a large
potential for reducing the effects of an accident, or, if
possible, avoiding the accident completely. This can
be done by building sensor-based safety systems that
can detect vehicles and VRUs and give warnings or
actively react on the information. The practical use of
an aware and intelligent infrastructure system as pro-
posed in this work is to enhance the performance of
connected and automated vehicles in cooperative in-
telligent transportation systems (C-ITS). With support
from wireless communication, the system allows fu-
ture connected and automated vehicles to receive col-
lision warnings about approaching vehicles or VRUs
from the infrastructure-based sensor system well in
advance to enable better planning and foremost, avoid
accidents.
Enabling the development of such systems re-
quires knowledge on how road users behave, and how
that behavior can be described so that the automated
vehicle functions can make correct interpretations and
decisions. Another possible outcome of this research
is insights on how vehicles should be programmed
to be interpretable by other road users. This work
focuses on data mining for action intention recogni-
tion of bicycles and cars using trajectories of road
users captured with a 3D camera-based data acqui-
sition system mounted in the infrastructure. Further-
more, the focus is also to find the input variables that
enable high accuracy modeling performance.
2 RELATED WORK
Previous work on data driven methods for predict-
ing future events of road users include (Lidstr
¨
om and
Larsson, 2009) where the authors propose an artificial
potential field approach to predict driver intentions
based on vehicle speed and location along with traffic
light status. Lidstr
¨
om and Larsson also elaborate on
using particle filters (Lidstrom and Larsson, 2008) to
predict the driver intentions. In both approaches they
use Vehicle-to-Vehicle communication to collect data
from cars maneuvering in an intersection, turning ei-
ther left or right. In a recent study (Muhammad and
˚
Astrand, 2018) bicycle and car trajectories indicating
a vehicle driving straight or turning are used to train
a binary classifier based on particle filters to separate
Englund, C.
Aware and Intelligent Infrastructure for Action Intention Recognition of Cars and Bicycles.
DOI: 10.5220/0009316002810288
In Proceedings of the 6th International Conference on Vehicle Technology and Intelligent Transport Systems (VEHITS 2020), pages 281-288
ISBN: 978-989-758-419-0
Copyright
c
2020 by SCITEPRESS – Science and Technology Publications, Lda. All rights reserved
281

the two different behaviors. In (Doshi and Trivedi,
2009) the authors explore the possibility of including
features indicating the drivers visual search prior to
maneuver i.e. head pose and eye gaze to predict driver
behavior. The results indicate that these features im-
prove driver attention and behavior estimation, as well
as intent prediction. The research group further pro-
poses to use a Bayesian extension to a support vec-
tor machine (SVM), known as a relevance vector ma-
chine (RVM) to detect lane following and lane change
behavior (Morris et al., 2011). The classifier uses ap-
proximately 500 input signals from e.g. the vehicle
CAN bus, tracked objects from the on-board radar and
parameters from a driver monitoring system capable
of tracking head motions. These methods however
require detailed information from the vehicles (Doshi
and Trivedi, 2009). In (Lidstr
¨
om and Larsson, 2009)
advanced technologies from infrastructure are needed
and in (Morris et al., 2011) information from the ob-
served vehicles is needed. Our approach, however,
only needs the positions of the observed road users.
Deep learning, as presented in (Alahi et al., 2016),
show that using Long Short-Term Memory for pre-
dicting human-human interactions and their future
trajectories is highly effective. Based on 3.2 s of
video data of a pedestrian, this system provides a
heat map of possible trajectories for the next 4.8 s.
In (Dominguez-Sanchez et al., 2017), an end-to-end
pedestrian intention prediction system is proposed
based on a Convolutional Neural Network (CNN).
This approach uses the video data alone to extract
the current movement direction of the pedestrians. In
a previous study, based on data from the Joint At-
tention in Autonomous Driving (JAAD) data set, ex-
tensive examination of data driven approaches was
performed for feature extraction and classification to
predict intentions of pedestrians (Varytimidis et al.,
2018). The task was to predict whether the pedestri-
ans were to cross a street or not. Combining a CNN
as a feature extractor and a support vector machine
as classifier yielded the best performance. In (Fang
and L
´
opez, 2019) a monocular camera is used as in-
put to a CNN used for human pose estimation and
intention recognition for VRUs. The JAAD data set
was used for pedestrian intention recognition, and a
new video data set was created for cyclists. The cy-
clists used their arm to indicate their intention and the
CNN was trained to detect their intention. In a recent
study (Mohammed et al., 2019) fixed cameras were
used to capture bicyclist behavior with the purpose to
improve traffic microsimulation models. The study
focuses on following and overtaking behavior and the
data used for the analysis come from bicycle trajec-
tories including position coordinates of the bicycle,
object size and speed.
In (Walker et al., 2014) a framework for visual
prediction on static scenes from video data is pre-
sented. The framework is based on representative and
discriminative mid-level elements and combines a vi-
sual representation with a decision theoretic frame-
work. The framework can predict how vehicles will
move in a possible future given that all other objects
in the scene remain stationary. In (M
´
ınguez et al.,
2018), balanced Gaussian process dynamical models
are used to build action recognition models of pedes-
trian activities i.e. walking, stopping, starting, and
standing. The model is capable of predicting actions
1 s in advance with high accuracy.
Equipping all vehicles with connected satellite
navigation receivers, such as Global Positioning Sys-
tem (GPS) devices, could be used to capture the tra-
jectories as suggested in (Herrera et al., 2010) (Carli
et al., 2015). However, to obtain high accuracy posi-
tions an additional correction signal is required such
as differential GPS or Real Time Kinematics (RTK)
GPS. Relying on the self-reported GPS-positions, re-
quires that all vehicles are equipped and connected.
With an intelligent and aware Infrastructure-based
data acquisition system, the behavior of all vehicles
can be captured.
This paper explores different classifiers for build-
ing aware and intelligent infrastructure capable of rec-
ognizing actions and intentions of cars and bicycles.
The proposed models take a few positions along with
speed and heading samples to predict the road users’
intention to go either straight or turn at an upcoming
intersection. In addition, by using a data mining ap-
proach, the paper explores which input variables con-
tribute the most to the correct classification. Certain
subsets of variables, compared to using all available
variables, are found that improve the performance of
the two models.
The contribution of this paper is twofold, a com-
parison between four well known classification meth-
ods is made where the models make use of a limited
number of historical samples to predict the road users’
intention. Secondly, the paper extracts a subset of
variables that improves the classification performance
for the car and bicycle models.
The rest of the paper is organized as follows, Sec-
tion 3 describes the data used. Section 4 describes
the methodology used for the proposed approach and
Section 5 presents the experimental investigations.
Finally, Section 6 concludes the work and presents
future research directions.
VEHITS 2020 - 6th International Conference on Vehicle Technology and Intelligent Transport Systems
282

3 DATA
The data used in this study is collected with a com-
mercial 3D camera data acquisition system with low
visual light capabilities (OTUS3D
1
) with built-in ob-
ject detection and trajectory estimation. The stereo
base for the two cameras is 50 cm and the field of
view is 95
◦
. The system is mounted in the infrastruc-
ture at an elevated position in a streetlight post to give
an overview of the observed areas. The two available
data sets consist of trajectories of bicycles or cars cap-
tured in real traffic. The bicycle data is collected at a
bicycle path with a turn off. The car data is collected
at an urban road section with an intersection. The ve-
hicles (bicycles and cars) are either going straight on
the road or turning off the road. There are in total
134 trajectories with bicycles, whereof 70 are turning.
There are in total 217 trajectories with cars, whereof
22 are turning. In all the scenes, there is only one
road user present. Instead of pre-processing the data
Table 1: Description of Variables Captured by the 3D Cam-
era Data Acquisition System.
Variable Description
p
x
Longitudinal position (m)
p
y
Lateral position (m)
t Time (timestamp)
v Speed from camera system (m/s)
b
v Estimated speed from p
x
, p
y
, t (m/s)
h Heading (degree)
by, for example, calculating any modes of the signals,
the input vectors in this paper consists of only the raw
data, described in Table 1, forming n multivariate time
series vectors x ∈ ℜ
m
, where m is the number of vari-
ables. The data is collected with a fixed sampling rate
(4 Hz).
Each vector is extracted from the trajecto-
ries in Fig. 1 and is a sliding window includ-
ing the variables p
x
(t), p
x
(t − 1), p
x
(t − 2), ..., p
x
(t −
T ), p
y
(t), p
y
(t − 1), p
y
(t − 2), ..., p
y
(t − T ), v(t), v(t −
1), v(t −2), ..., v(t − T),
b
v(t),
b
v(t − 1),
b
v(t − 2), ...,
b
v(t −
T ), h(t), h(t − 1), h(t − 2), ..., h(t − T ). Where t is the
time and T is the number of previous samples to use.
In this work five different variables are used and for
each variable the time stamps t, t − 1,t − 2,t − 3, t − 4
i.e. T=4 are used, which will result in m = 25. For
each input vector x
i
the associated output y
i
indicates
whether the vehicle is turning or not in the upcoming
exit. Thus, all vectors that come from a trajectory that
describe a turning vehicle have y=0, and vehicles that
go straight have y=1.
1
https://viscando.com/
4 PROPOSED APPROACH
The proposed approach is motivated by the fast de-
velopment of autonomous vehicular transport sys-
tems. To improve safety, vehicle awareness of their
surroundings is of utmost importance. The vehicles
themselves have perception sensors capable of detect-
ing obstacles and other road users. Combined with the
additional sensor systems in a connected infrastruc-
ture, as in this research, it may be possible to provide
additional valuable information about complex traffic
situations such as intersections.
In this work the data is collected using a fixed
camera system mounted in the infrastructure. The aim
is to understand what the most relevant variables are
for predicting intentions, regardless of how the data
is collected. Traffic behavior is highly dynamic and
there is often only limited time available for detec-
tion, monitoring and decision making. Typically, it is
difficult to obtain a clear line of sight for long time
periods, particularly if the sensor is placed on a vehi-
cle (instead of in the infrastructure). The models in
this study use short time series, 5 samples that cor-
responds to 1.25 s, to predict if the bicycle or car
will turn at the upcoming exit. The description of the
method to extract which variables, and how many pre-
vious time stamps are needed to make accurate pre-
dictions, is presented in the next section.
This section describes the four classification meth-
ods that are compared while predicting the driver’s
intended actions. The tool used for classification is
Matlab. The first model is a plain linear classification
model (LM) (Hastie et al., 2009) y = Xw +ε, where y
is the predicted output, w is the model weights found
with least squares, and X is the input variables, see
Section 3, and ε is the vector of random errors as-
sumed to be identically distributed with zero mean
and unknown variances. The second model is a multi-
layer perceptron neural network (NN) (Bishop, 1995),
trained using the Bayesian regularization backpropa-
gation training rule in Matlab. The third model is a
support vector machine (SVM) (Vapnik, 1998), using
a radial basis function (RBF) as a kernel. The fourth
model is a random forest (RF) (Breiman, 2001) con-
sisting of 100 trees trained to full depth and a majority
vote is used to obtain the final output of the RF. De-
tails of the classifiers are presented in the next Sec-
tion.
It should be noted that the model is not predict-
ing the next action as described in the literature re-
viewed in Section 2 but rather, what action the vehicle
will take at the upcoming exit. Depending on where
the sample is collected the distance to the intersection
varies.
Aware and Intelligent Infrastructure for Action Intention Recognition of Cars and Bicycles
283

4.1 Classifier Configuration
All hyper-parameters of the models are found experi-
mentally. The network configuration for the NN that
yielded the best performance was a one hidden layer
perceptron with 3 hidden nodes, a Symmetric sigmoid
transfer function was used in the hidden layer and a
Logarithmic sigmoid transfer function in the output
layer. The network is trained for 50 epochs. The SVM
with the RBF function use σ=0.8 and the parameter
C, which controls the trade-off between the training
error and the rigid margins allowing some miss clas-
sifications, is set to 0.1. In a RF each tree is trained
using data selected using random sampling with re-
placement (bootstrapping) resulting in that approxi-
mately one-third of the data is left out. For each tree
k, the data that is not used for training, the out-of-bag
(OOB) data, is used to estimate the generalization per-
formance and variable importance (Breiman, 2001).
Initially 25 input signals are used for the model-
ing task. For the variables p
x
, p
y
, v,
b
v, h the time in-
stances at t, t − 1, t − 2, t − 3 and t − 4 are used to
predict if the vehicle will make a turn or go straight in
the upcoming intersection. For the bike data set there
are 5640 samples generated from the 135 trajectories;
2451 samples in the turning class and 3189 in the go-
ing straight class. For the car data there are 2593 sam-
ples generated from the 217 trajectories; 388 in the
turning class and 2205 in the going straight class. A
model trained with an unbalanced data set, however,
may favor the majority class, which in this case is not
desirable. Therefore the data is balanced resulting in
2451 samples in each of the bicycle classes and 388
samples in each of the car classes. Data from posi-
tions after the vehicles have turned at the turn off are
not considered. The data used is visualized in Fig. 1.
In this work, the models are built using five-fold cross
validation and throughout this paper the result pre-
sented is the mean of the five models.
For model evaluation, four different metrics are
used: (i) the mean classification error rate is used to
find model parameters and for variable selection; (ii)
distance to the intersection is used to benchmark the
models and to understand how early the models can
predict whether the bicycle or car is turning or not.
For each sample, the distance is approximated with
the Euclidean distance d
e
to the intersection, as shown
in Eq. 1
d
e
=
q
(p
o
x
− p
i
x
)
2
+ (p
o
y
− p
i
y
)
2
, (1)
where o indicates the coordinate of the intersection
and i is the coordinate of the current sample. In Fig. 1
the lower left corner of the gray box (-8,-8) is the point
for the intersection used in the bicycle dataset and the
(a) Bicycle Trajectories. (b) Car Trajectories.
Figure 1: The Highlighted Area Limited by the Solid Line
Indicate the Regions from Where Data Is Used for Training
and Testing the Models.
lower right corner (-6,2) is the intersection point for
the car data set. These points are from hereon called
the intersection; (iii) true positives (TP), true nega-
tives (TN), false positives (FP) and false negatives
(FN) are used to illustrate the performance and; (iv)
finally, to allow comparison between models, the pre-
cision PR =
T P
T P+FP
and recall RE =
T P
T P+FN
are used.
4.2 Variable Selection
Initially the 25 input signals described above are used
to build the classifiers, five variables with five samples
t,t − 1, t − 2, t − 3 and t − 4 corresponds to time series
of 1.25 s. The backward elimination method is used to
find the most important input variables that influence
the modeling of the behavior. The process uses the RF
model as the classifier. The variable selection method
is described below:
1. Build M models and for each model m, remove
the m-th input variable.
2. Use the OOB data set to estimate the performance
of each model m.
3. The model m with the lowest error indicates the
signal m that influences the model the least and is
removed.
4. The removed input variable is given a score indi-
cating the order it was removed.
5. Remove the input variable and restart from 1 with
M=M-1 input variables until M=1.
6. When M=1, the scores indicate the importance of
each input variable.
5 EXPERIMENTAL
INVESTIGATIONS
5.1 Classification
This section describes the initial classification results.
In Fig. 2 a comparison of the classification accuracy
VEHITS 2020 - 6th International Conference on Vehicle Technology and Intelligent Transport Systems
284

(a) Bicycle. (b) Car.
Figure 2: True Positives (TP), True Negatives (TN), False
Positives (FN) and False Negatives (FN) for the Models Us-
ing All Available Variables.
Table 2: Mean, m, Distance Error along with the Standard
Deviation (σ) of the Mean, for the Bicycle and Car Action
Intention Models.
Model LM NN SVM RF
Bicyle 8.5 (0.13) 7.6 (0.18) 6.8 (0.47) 5.9 (0.45)
Car 5.0 (0.21) 4.8 (0.33) 4.4 (0.43) 3.7 (0.40)
is found regarding true positives (TP — Samples cor-
rectly classified in trajectory going straight), true neg-
atives (TN — Samples correctly classified in trajec-
tory that is turning), false positives (FP — Samples
erroneously classified as going straight) and false neg-
atives (FN — Samples erroneously classified as turn-
ing). Generally, the RF model yields the best per-
formance for both bicycle and car model whereas the
performance of the NN, SVM is diversified. The LM
yields overall poor performance.
Table 2 present mean distance from the samples
to the intersection in meters for the samples that are
miss classified. The standard deviation of the mean
distance is also presented. As can be seen in both
Fig. 2, Table 2 and Table 3 while using all available in-
put variables, the RF model provides the best perfor-
mance for both bicycle and car data sets. In addition,
the performance of the car model is generally better
than the bicycle model. In the next section, the search
for the subset of the most important input variables
is presented that can be used to model the action in-
tention for both the bicyclists and the cars. Typically,
one wants to find a few information-rich input vari-
ables that can be used to build a cost efficient (with
few variables) model.
In Table 3 the results from the recall and precision
analysis are presented. These results also indicate that
the RF model for both bicycle and car data provide the
best performance. Generally, the non-linear models
NN, SVM and RF yield better performance than the
LM, in particular for the bicycle model.
Table 3: Average Precision and Recall for the Bicycle and
Car Data Sets Using All Available Variables.
Model Bicycle Car
Recall % Precision % Recall % Precision %
LM 55.1 60.3 74.0 75.5
NN 58.2 65.8 72.2 75.2
SVM 69.3 66.6 78.6 73.2
RF 70.8 73.5 81.4 79.3
5.2 Variable Selection
While applying the backward elimination variable se-
lection method, the importance scores of the input
variables are estimated and presented in Table 4 for
both the bicycle and car models. The selection pro-
cedure is made on the five cross validation set, thus,
the presented score along with the standard deviation
is given in the table. The mean error of the RF clas-
sifier while performing the variable selection proce-
dure can be found in Fig. 3 and Fig. 4 for the bicycle
and car respectively. The graphs show how the perfor-
mance of the model varies as variables are removed.
The minimum error for the bicycle model is obtained
by removing 20 of the 25 variables, see Fig. 3. In
Table 4 the five variables with the highest score are
highlighted (bold type): v(t), v(t − 4), p
x
(t), p
y
(t) and
h(t). Consequently, these variables are the most im-
portant for deciding whether the bicyclist will turn or
not. Beside the current position of the bicyclist, the
model utilizes the speed variation of the bicyclist, thus
the speed dynamics, v(t) and t − 4 are among the most
important variables.
Fig. 4 illustrate the mean error for the car action
intention prediction model and it is shown that by re-
moving 19 of the 25 input variables the lowest mean
prediction error is achieved. The six variables with
the highest score from Table 4 are:
b
v(t), p
y
(t), p
y
(t −
4), p
x
(t), p
x
(t − 4) and h(t). Whereas current position
and the speed variation are important for the bicycle
model, road position dynamics provide valuable in-
formation for the model predicting action intentions
of the car i.e. time steps t and t − 4 for both p
x
and
p
y
are among the most important variables along with
current estimated speed and car heading.
As can be seen in Table 4, the standard deviation
of the score is low for the most important variables,
indicating that the selection order is very similar be-
tween the cross-validation data sets, in particular for
the variables with high score. The standard deviation
is slightly higher for the variables that are less impor-
tant.
Aware and Intelligent Infrastructure for Action Intention Recognition of Cars and Bicycles
285
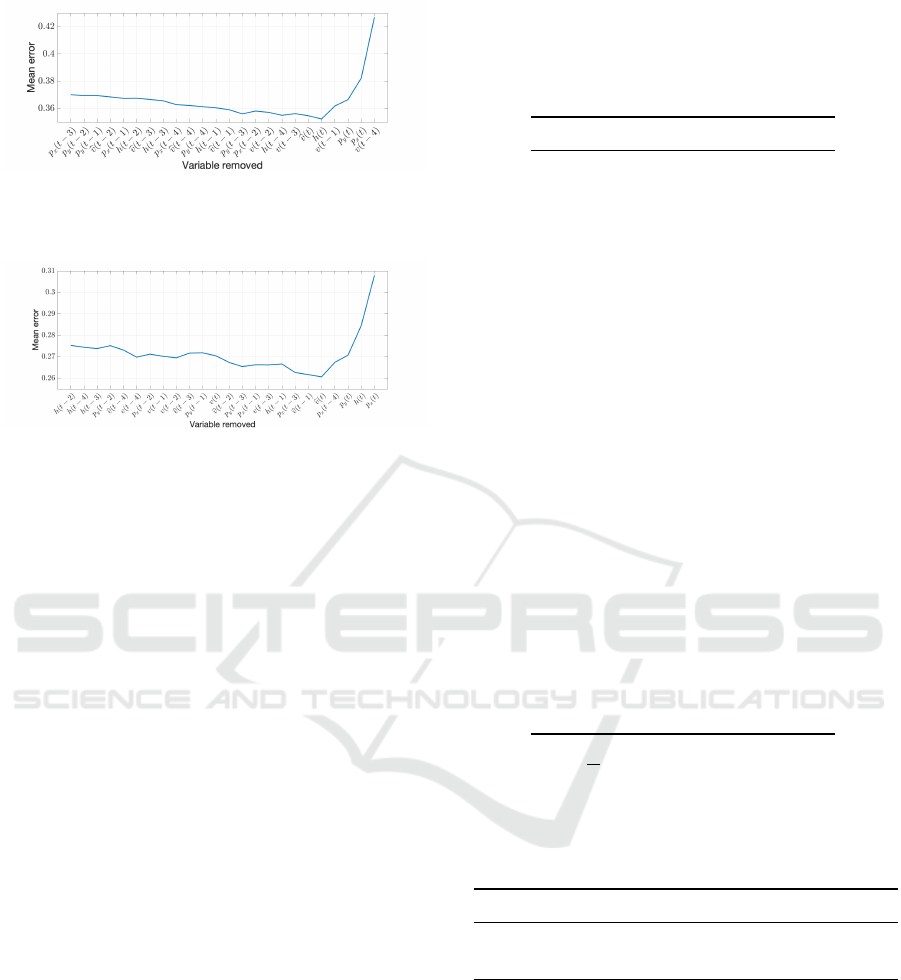
Figure 3: Mean Error as a Function of Variables Re-
moved during the Variable Selection Process for the Bicycle
Model.
Figure 4: Mean Error as a Function of Variables Removed
during the Variable Selection Process for the Car Model.
5.3 Classification with Best Set of
Variables
By using a subset of the input variables, found using
the backward variable selection method described in
Section 5.2, the models are retrained. The results are
found in Fig. 5 and Table 5. Both the bicycle and
car models improved slightly with the reduced num-
ber of input variables, compared to using all available
variables, leading to an observed lessening in distance
error, see Table 5. This means that the model is ca-
pable of accurately predict the intention further away
without using all variables. The standard deviation is
also slightly lower for the models trained with the re-
duced number of variables. The best improvements
are found for the car NN model, where the mean er-
ror decrease from 4.8 to 3.6, an improvement of 25%.
While comparing the classification results in Fig. 2
and Fig. 5, for the bicycle RF model the performance
is slightly improved. Notably only 5 out of the orig-
inal 25 variables are used. In Fig. 5, for the RF car
model, slight increase in TP and TN and a small de-
crease in FP and FN is observed, despite using only 6
out of the original 25 input variables. This indicates
that, for the current traffic situations and the available
data sets, an efficient subset of variables is found that
the model can utilize to predict the action intention of
both bicyclists and cars.
In addition, the performance is visualized as a
function of the distance to the intersection for each
trajectory. Fig. 6 visualizes the time series mapped
to its trajectory ID along with a bar graph showing
Table 4: Scores from Backward Elimination Variable Selec-
tion for Both Bicycle and Car Action Intention Models. The
Mean of the Selection Scores Obtained over the Five Cross
Validation Data Sets Is Presented along with the Standard
Deviation inside Parenthesis.
Variable Bicycle Car
p
x
(t) 23.0 (0.0) 25.0 (0.0)
p
x
(t − 1) 5.8 (0.8) 16.6 (0.5)
p
x
(t − 2) 14.6 (0.9) 6.6 (1.3)
p
x
(t − 3) 1.6 (0.9) 14.0 (0.0)
p
x
(t − 4) 4.4 (2.4) 21.6 (0.9)
p
y
(t) 21.2 (0.4) 20.2 (0.4)
p
y
(t − 1) 7.2 (1.9) 11.8 (2.7)
p
y
(t − 2) 4.2 (2.8) 5.6 (3.0)
p
y
(t − 3) 4.4 (5.9) 18.6 (0.5)
p
y
(t − 4) 15.8 (2.7) 23.2 (1.8)
v(t) 25.0 (0.0) 18.4 (0.5)
v(t − 1) 18.8 (0.8) 10.6 (0.9)
v(t − 2) 16.2 (0.4) 6.8 (1.3)
v(t − 3) 21.2 (1.8) 6.0 (3.5)
v(t − 4) 24.0 (0.0) 8.4 (3.0)
b
v(t) 18.6 (0.5) 21.8 (0.4)
b
v(t − 1) 11.0 (1.4) 15.6 (1.7)
b
v(t − 2) 6.2 (0.8) 15.4 (0.5)
b
v(t − 3) 12.0 (1.4) 6.0 (1.7)
b
v(t − 4) 10.4 (1.5) 12.4 (0.5)
h(t) 20.2 (0.4) 23.2 (0.4)
h(t − 1) 7.6 (2.7) 10.2 (0.8)
h(t − 2) 5.0 (1.7) 1.0 (0.0)
h(t − 3) 12.4 (0.9) 2.6 (0.9)
h(t − 4) 14.2 (1.3) 3.4 (0.9)
Table 5: Mean, m, Distance to the Intersection for the Miss
Classified Samples along with the Standard Deviation (σ) of
the Mean, for the Bicycle and Car Action Intention Models
While Using the Variables That Yield the Best Performance
According to the Backward Elimination Variable Selection
Method.
Model LM NN SVM RF
Bike 8.5 (0.12) 7.6 (0.18) 6.0 (0.45) 5.7 (0.44)
Car 4.7 (0.20) 3.6 (0.27) 3.6 (0.39) 3.7 (0.41)
the percentages of samples in each trajectory that are
miss classified. The miss classified time series are in-
dicated by black markers. As can be seen, in the vast
majority of the trajectories >50% of the time series
are correctly classified.
Fig. 7 shows the mean error rate of all trajectories
as a function of the distance to the intersection. While
approaching the intersection the error rate is decreas-
ing, this is in particular evident for the car model.
As can be seen, already at 20 m from the intersec-
VEHITS 2020 - 6th International Conference on Vehicle Technology and Intelligent Transport Systems
286

(a) Bicycle. (b) Car.
Figure 5: True Positives (TP), True Negatives (TN), False
Positives (FN) and False Negatives (FN) of the Models
Trained Using the Variables That Yield the Best Perfor-
mance According to the Backward Elimination Variable Se-
lection Method.
(a) RF Bicycle. (b) RF Car.
Figure 6: Percent of Time Series in Each Trajectory That
Is Being Miss Classified (Left) along with a Visualization
of, at What Distance the Model Make Errors (Right) for the
Bicycle and Car RF Models. The Trajectories above the
Red Line Are the Ones That Make the Turn, 70 Traces for
the Bike and 22 for the Car.
tion the error rate is around 25% for the bike and for
the car the performance is even more impressive, at
20 m from the intersection the error rate is <10%.
The performance increase at 17 m for the car model
depends on the very few data points available at that
distance. In Table 6 the results from the recall and
precision analysis are shown. For the bicycle data set,
the SVM and RF clearly outperform the other two
methods for both recall and precision performance.
For the car data, the SVM model yields the best recall
performance and the NN and the RF have similar pre-
cision performance. Another observation is that the
difference between the models while using all vari-
ables is quite limited, however, while using a limited
(a) Bicycle. (b) Car.
Figure 7: Error Rate as a Function of the Distance to the
Intersection for the Bicycle and Car Model Trained Using
the Subset of Variables Found Using Backward Elimination
Variable Selection Method.
Table 6: Average Precision and Recall for the Bicycle and
Car Data Sets Using the Subset of Variables Found Using
Backward Elimination Variable Selection Method.
Model Bicycle Car
Recall % Precision % Recall % Precision %
LM 54.9 59.9 72.6 75.7
NN 58.8 66.1 82.8 79.5
SVM 75.7 70.9 83.7 78.5
RF 71.6 73.7 80.2 79.5
number of variables the LM model is outperformed
by the non-linear models (NN, SVM and RF), which
may indicate that the modeled traffic behavior is non-
linear. Finally a comparison is made between the per-
formance of the models presented here and previous
findings from (Muhammad and
˚
Astrand, 2018). In
their work only heading was used as input for a par-
ticle filter-based model and performance of around
80% correct classifications of the intentions for both
bicycle and car models is reported. While using three
variables, heading, speed and the shortest distance
from the border of the path are used for predicting
the intention in the intersection, the performance is
slightly lower, however the variance of the predic-
tions also become lower. In this work, it was found
that heading receives high scores for both bicycle and
car models. This corresponds well with the findings
in (Muhammad and
˚
Astrand, 2018), where heading
is found to be the most significant variable. Another
comparison can be made to the findings in (Phillips
et al., 2017) where the authors use a rich data set com-
prising 104 featured such as base features describing
dynamics and position from the ego vehicle, history
features from past states, traffic features based on sur-
rounding vehicles, and rule features indicating legal
actions at the next intersection. The data set consists
of historical base features extracted from frames 0.5
s, 1 s, 2 s and 3 s in the past. The results from an
LSTM indicate 80-85% accuracy on predicting the
intention in upcoming intersections. The results ob-
tained in this work, the car intention prediction model
is within this range i.e. for distances above 20 m the
accuracy is around 80%, and for distances below 20
m the accuracy is around 90%.
From a computational effort point of view, the
models have low complexity and could execute fast
on any modern vehicle ECU or C-ITS road side unit.
6 CONCLUSION
A method for predicting action intentions, i.e.
whether to turn or go straight in an upcoming intersec-
Aware and Intelligent Infrastructure for Action Intention Recognition of Cars and Bicycles
287

tion, of road users is presented. Trajectory data sets
from both bicyclists and cars are used to demonstrate
the proposed approach. From the trajectories a slid-
ing window is applied creating short time series used
for building models that predicts the action intention.
The no free lunch theorem is put to use as it was found
that the RF yields the best performance for the bicy-
cle data and the NN for the car data. The search for
the most important variables for the classification task
resulted in slightly improved performance while us-
ing only five variables for the bicycle model and six
for the car model. For the bicycle model longitudinal
and lateral position along with speed dynamics v(t),
v(t − 4) and h(t) are needed. With the car model, es-
timated speed, heading and position dynamics (t) and
(t − 4) for both longitudinal and lateral position are
among the most important input variables.
Future work includes incorporating data describ-
ing relations between different road-users to enable
modelling of how the behavior of different road users
interplay in decision making. Moreover, while mod-
eling interplay, time to decision becomes a natural
model output instead of only the actual action inten-
tion, as used in this work.
ACKNOWLEDGMENT
Viscando Traffic Systems are greatly acknowledged
who have provided the data. This work is part of the
AIR project (action and intention recognition in hu-
man interaction with autonomous systems), financed
by the KK foundation under the grant agreement
number 20140220.
REFERENCES
Alahi, A., Goel, K., Ramanathan, V., Robicquet, A., Fei-
Fei, L., and Savarese, S. (2016). Social lstm: Human
trajectory prediction in crowded spaces. In The IEEE
Conference on Computer Vision and Pattern Recogni-
tion (CVPR).
Bishop, M. C. (1995). Neural Networks for Pattern Recog-
nition., volume 92.
Breiman, L. (2001). Random Forests. Machine Learning,
45(1):5–32.
Carli, R., Dotoli, M., Epicoco, N., Angelico, B., and Vinci-
ullo, A. (2015). Automated evaluation of urban traf-
fic congestion using bus as a probe. In 2015 IEEE
International Conference on Automation Science and
Engineering (CASE), pages 967–972.
Dominguez-Sanchez, A., Cazorla, M., and Orts-Escolano,
S. (2017). Pedestrian movement direction recog-
nition using convolutional neural networks. IEEE
Transactions on Intelligent Transportation Systems,
18(12):3540–3548.
Doshi, A. and Trivedi, M. (2009). Investigating the rela-
tionships between gaze patterns, dynamic vehicle sur-
round analysis, and driver intentions. In 2009 IEEE
Intelligent Vehicles Symposium, pages 887–892.
Fang, Z. and L
´
opez, A. M. (2019). Intention recognition of
pedestrians and cyclists by 2D pose estimation. IEEE
Transactions on Intelligent Transportation Systems,
pages 1–11.
Hastie, T., Tibshirani, R., and Friedman, J. (2009). The
Elements of Statistical Learning. Elements, 1:337–
387.
Herrera, J. C., Work, D. B., Herring, R., Ban, X. J., Ja-
cobson, Q., and Bayen, A. M. (2010). Evaluation of
traffic data obtained via gps-enabled mobile phones:
The mobile century field experiment. Transportation
Research Part C: Emerging Technologies, 18(4):568 –
583.
Lidstrom, K. and Larsson, T. (2008). Model-based estima-
tion of driver intentions using particle filtering. In
2008 11th International IEEE Conference on Intelli-
gent Transportation Systems, pages 1177–1182.
Lidstr
¨
om, K. and Larsson, T. (2009). Act normal: using
uncertainty about driver intentions as a warning cri-
terion. In 16th World Congress on Intelligent Trans-
portation Systems (ITS WC), 21-25 September, 2009,
Stockholm, Sweden, page 8.
M
´
ınguez, R. Q., Alonso, I. P., Fern
´
andez-Llorca, D., and
Sotelo, M. A. (2018). Pedestrian path, pose, and in-
tention prediction through gaussian process dynami-
cal models and pedestrian activity recognition. IEEE
Transactions on Intelligent Transportation Systems,
pages 1–12.
Mohammed, H., Bigazzi, A. Y., and Sayed, T. (2019). Char-
acterization of bicycle following and overtaking ma-
neuvers on cycling paths. Transportation Research
Part C: Emerging Technologies, 98:139 – 151.
Morris, B., Doshi, A., and Trivedi, M. (2011). Lane change
intent prediction for driver assistance: On-road de-
sign and evaluation. In Intelligent Vehicles Symposium
(IV), 2011 IEEE, pages 895–901. IEEE.
Muhammad, N. and
˚
Astrand, B. (2018). Intention estima-
tion using set of reference trajectories as behaviour
model. Sensors, 18(12):4423.
Niska, A. and Eriksson, J. (2013). Statistik
¨
over cyklis-
ters olyckor: faktaunderlag till gemensam strategi f
¨
or
s
¨
aker cykling. vti.
Phillips, D. J., Wheeler, T. A., and Kochenderfer, M. J.
(2017). Generalizable intention prediction of human
drivers at intersections. In 2017 IEEE Intelligent Ve-
hicles Symposium (IV), pages 1665–1670. IEEE.
Vapnik, V. N. (1998). Statistical Learning Theory (Adaptive
and Learning Systems for Signal Processing, Commu-
nications and Control Series). Wiley-Interscience.
Varytimidis, D., Alonso-Fernandez, F., Englund, C., and
Duran, B. (2018). Action and intention recognition
of pedestrians in urban traffic. In SITIS.
Walker, J., Gupta, A., and Hebert, M. (2014). Patch to the
future: Unsupervised visual prediction. In Proceed-
ings of the IEEE Conference on Computer Vision and
Pattern Recognition, pages 3302–3309.
World Health Organization (WHO) (2015). Global Status
Report on Road Safety 2015. WHO Press, Geneva.
VEHITS 2020 - 6th International Conference on Vehicle Technology and Intelligent Transport Systems
288
