
Online Driving Behavior Scoring using Wheel Speeds
Marian Waltereit
a
, Peter Zdankin, Viktor Matkovic, Maximilian Uphoff and Torben Weis
b
Distributed Systems Group, University of Duisburg-Essen, 47048 Duisburg, Germany
Keywords:
Driving Behavior, Aggressive Driving, Driver Feedback, Wheel Speeds, Controller Area Network.
Abstract:
We present an online scoring algorithm for measuring driving behavior using wheel speeds only. Such an
algorithm can be used to provide drivers with feedback about their driving behavior while driving in order to
reduce aggressive driving, which is a primary cause of traffic accidents. Our algorithm uses a minimal data
set already available through the built-in wheel speed sensors of contemporary cars. Due to the small amount
of data used and the low computational complexity, our algorithm can easily be deployed on single-board
computers. With real driving experiments in a controlled and an uncontrolled environment, we demonstrate
the suitability of our scoring algorithm for identifying aggressive driving and assessing the driving behavior.
1 INTRODUCTION
Vehicular accidents are often caused by aggressive
driving behavior, such as extreme acceleration or de-
celeration (Luo Yong and Li Hui, 2009; Paleti et al.,
2010; Ma et al., 2019). The risk such accidents could
be reduced by giving drivers feedback on their driv-
ing behavior. Without feedback, drivers can typi-
cally only monitor the velocities of their cars to assess
whether they are within legal limits. Other physical
quantities such as the car’s acceleration are difficult to
grasp while driving without further assistance. How-
ever, the acceleration of the car is another indicator of
the quality of the driving behavior, since a moderate
and steady acceleration implies a safer driving style
that endangers other drivers less. A behavioral score,
on the other hand, can be understood more intuitively
and is less of a cognitive burden for drivers. Such a
score can be calculated using physical quantities from
in-vehicle data of contemporary cars and indicates ei-
ther non-aggressive or aggressive driving behavior. If
drivers check their scores regularly, they are able to
notice reductions and adjust their behavior towards a
non-aggressive driving style to raise the score back to
a good rating. Moreover, the awareness of the indi-
vidual driving behavior can be improved.
Our contribution is an online scoring algorithm
for measuring driving behavior using wheel speeds
only. An online algorithm rates the driving behavior
while driving. In contrast, offline algorithms rate the
a
https://orcid.org/0000-0001-5480-8783
b
https://orcid.org/0000-0001-6594-326X
driving behavior retrospectively after the trip. Due to
the mandatory anti-lock braking system (ABS), wheel
speeds can be obtained from built-in wheel speed sen-
sors of contemporary cars via the Controller Area
Network (CAN bus) (Reif, 2011). As a result, our
scoring algorithm can potentially be used in a large
number of today’s cars. We identify wheel speeds
as the minimal data set adequate and required for the
purpose of driving behavior scoring. Thus, our al-
gorithm follows the principle of data minimization as
defined in the EU General Data Protection Regulation
(GDPR) (Council of the European Union and Euro-
pean Parliament, 2016). The small amount of data
used and the low computational complexity make our
algorithm easy to deploy on single-board computers.
The rest of this paper is organized as follows. We
first discuss related approaches for measuring driving
behavior in Section 2. In Sections 3 and 4, we de-
scribe the system model and introduce the kinematic
car data used in our paper. We present our scoring al-
gorithm in Section 5. In Section 6, we evaluate our
scoring algorithm with real driving experiments in a
controlled and an uncontrolled environment. Finally,
we conclude the paper in Section 7.
2 RELATED WORK
In behavioral science, the definition of aggressive
driving is manifold. As Dula et al. (Dula and Geller,
2003) point out, the term is used in different contexts.
In psychology, the term is used to refer to three types
Waltereit, M., Zdankin, P., Matkovic, V., Uphoff, M. and Weis, T.
Online Driving Behavior Scoring using Wheel Speeds.
DOI: 10.5220/0009215604170424
In Proceedings of the 6th International Conference on Vehicle Technology and Intelligent Transport Systems (VEHITS 2020), pages 417-424
ISBN: 978-989-758-419-0
Copyright
c
2020 by SCITEPRESS – Science and Technology Publications, Lda. All rights reserved
417

of aggressive driving behavior: 1) acts of bodily or
psychological aggression towards other road users, 2)
negative emotions while driving, and 3) risk-taking
driving behavior without intent to harm other road
users. In this paper, we refer to the third type of driv-
ing behavior since it is a measurable behavior that is
reflected in in-vehicle data from the CAN bus. Exam-
ples for the third driving behavior type are weaving in
and out of traffic, speeding or changing speed unpre-
dictably (James, 2009).
Several approaches for measuring driving behav-
ior have already been proposed. The methodology
used include questionnaires, fuzzy logic and machine
learning (Imkamon et al., 2008; Castignani et al.,
2015; Ma et al., 2019; Carfora et al., 2019). In the
following, we focus on scoring-based approaches, as
these are most related to our work.
Castignani et al. (Castignani et al., 2015) proposed
a smartphone-based driver profile platform. While
they use accelerometer, magnetometer and gravity
sensor readings as well as GPS data to detect driving
events first, information about the weather and time of
day is used to calculate a score based on the events.
The detection of driving events is based on a fuzzy
inference system. However, due to the use of smart-
phones, their approach requires a calibration phase
based on statistical analysis to determine the thresh-
olds for the fuzzy inference system. We use an adap-
tive threshold that is based on physical limitations of
car dynamics and does not require a calibration phase.
Bergasa et al. (Bergasa et al., 2014) developed an
app for smartphones to warn inattentive drivers while
evaluating and scoring driving behavior. They use a
variety of sensors and integrated hardware such as
camera, microphone, GPS and inertial sensors. The
resulting data is used to calculate two types of scores.
The first score describes the drowsiness of the driver,
which is calculated from the camera shots using im-
age processing. The second score represents and rates
the distraction of the driver using inertial sensors.
However, the smartphone is used as a fixed vehicle-
mounted device, i.e. the axis of the smartphone’s
acceleration and gyroscope sensors must be aligned
with the corresponding axis of the car. Such a setup
is susceptible to operating errors and external influ-
ences, which can lead to undesirable problems such
as incorrect scoring. In contrast to our approach, they
use fixed thresholds for detecting and rating driving
events. In addition, we use in-vehicle data and do not
require inertial sensors of a smartphone.
Eboli et al. (Eboli et al., 2016) proposed a method-
ology to analyze driving behavior using velocity as
well as longitudinal and lateral accelerations obtained
from a smartphone with GPS to distinguish safe
from unsafe driving behavior. Then, they extended
the methodology by incorporating vertical accelera-
tion (Eboli et al., 2019). In contrast to the in-vehicle
data used in our work, GPS is not always available,
e.g. in tunnels. Nevertheless, in our scoring algorithm
we utilize the safety threshold introduced by Eboli et
al. (Eboli et al., 2016), which is based on physical
limitations of car dynamics.
Carfora et al. (Carfora et al., 2019) proposed an
approach to characterize driving behavior using un-
supervised classification algorithms such as k-means.
They calculate aggressiveness indices that are used to
derive a risk index. For this, they use a total of 10
features from CAN bus and GPS sensor readings, e.g.
engine revolutions per minute (RPM) and accelera-
tion. The GPS-based features are used to determine
the type of road and the time at which the car was
driven. Yet again, the problem is that GPS is not al-
ways available.
Abdelrahman et al. (Abdelrahman et al., 2018)
presented a data-driven approach that uses machine
learning algorithms to predict a driver’s accident risk
probability. They calculate the risk probability on the
basis of 12 driving behavior features, such as sudden
braking, already included in the naturalistic driving
data set used. Based on the risk prediction they cal-
culate a final driver’s risk score. However, not all of
the features used can be obtained from in-vehicle data
and require external information such as speed limits.
In contrast to our approach, most of the aforemen-
tioned existing approaches require data from various
sensors for measuring driving behavior. Our objective
is to provide a scoring algorithm with a low compu-
tational complexity that uses only a minimal data set
obtained from the car’s CAN bus. Hence, our algo-
rithm follows the principle of data minimization as
defined in the GDPR (Council of the European Union
and European Parliament, 2016).
In above context, Kar et al. (Kar et al., 2019) pro-
posed a scoring algorithm that uses gyroscope and
RPM readings as the minimal data set for scoring
driving behavior. This data is available in all car mod-
els through the on-board diagnostics port. However,
the data set used is less minimal than in our approach.
Using time series forecasting methods, they predict
future gyroscope and RPM values in order to identify
anomalies, i.e. changes in driving behavior. Finally,
they calculate a score based on the prediction errors.
3 SYSTEM MODEL
We assume a system with the following four com-
ponents: a driver, a car, a scoring device, and a dis-
VEHITS 2020 - 6th International Conference on Vehicle Technology and Intelligent Transport Systems
418

play. The driver drives a car equipped with a scor-
ing device. This scoring device is capable of calcu-
lating a driving behavior score using wheel speeds
only. As a result, external information such as traffic
conditions or speed limits are not required. The scor-
ing device is connected to the car’s high speed CAN
bus and waits for wheel speed messages broadcasted
over the CAN bus. Using methods as introduced
by Marchetti et al. (Marchetti and Stabili, 2019), the
identifier of wheel speed messages can be automat-
ically identified. This is useful, as this information
is not standardized for private transport and usually
not published by manufacturers. Using wheel speeds,
the scoring device calculates and updates the driver’s
score while driving. A display is connected to the
scoring device and displays the score in order to give
the driver feedback about his or her driving behavior.
Based on the feedback, the driver is able to improve
his or her driving behavior in order to avoid accidents.
4 KINEMATIC CAR DATA
We utilize time-stamped wheel speeds from the car’s
CAN bus to calculate the kinematic car data. We de-
note the right and left front wheel speeds as w
rf
(t) and
w
lf
(t). Accordingly, w
rr
(t) and w
lr
(t) represent the
speeds of the right and left rear wheels. We denote a
wheel speed measurement W (t) at time t as:
W (t) = (w
rf
(t), w
lf
(t), w
rr
(t), w
lr
(t)), (1)
where the wheel speeds are in ms
−1
.
We estimate the car’s velocity v(t) at time t by the
mean of the right and left rear wheel speeds w
rr
(t) and
w
lr
(t) (Carlson et al., 2002):
v(t) =
w
rr
(t) + w
lr
(t)
2
(2)
We estimate the yaw rate r(t) of a car at time t
using the car’s rear track width T and the right and
left rear wheel speeds w
rr
(t) and w
lr
(t) (Carlson et al.,
2002):
r(t) =
w
rr
(t) − w
lr
(t)
T
(3)
The first derivative of the velocity v(t) is the lon-
gitudinal acceleration a
lon
(t). We estimate the car’s
lateral acceleration a
lat
(t) using the velocity v(t) and
the yaw rate r(t), neglecting the sideslip angle (Chen
et al., 2016):
a
lat
(t) = v(t) · r(t) (4)
The acceleration vector a(t) includes the longitu-
dinal and the lateral acceleration at time t as:
a(t) = (a
lon
(t), a
lat
(t)) (5)
We calculate the orientation-independent total ac-
celeration ka(t)k as the magnitude of the acceleration
vector a(t):
ka(t)k =
q
a
lon
(t)
2
+ a
lat
(t)
2
(6)
5 SCORING ALGORITHM
We introduce a driving behavior score between 0 and
100 points. A score of 0 points indicates that the driv-
ing behavior is consistently aggressive and a score of
100 points indicates that the driving behavior is con-
sistently non-aggressive. This way the driving behav-
ior can be monitored throughout the trip and drivers
can receive feedback on their respective driving be-
havior. In order to calculate the score, we use wheel
speeds which are typically available at 100 Hz on the
car’s CAN bus. However, the frequency may vary de-
pending on the manufacturer. In this case, we resam-
ple the wheel speeds to 100 Hz.
For our scoring algorithm, we choose a window-
based approach. Based on our experiments, we use
non-overlapping windows ω
i
with a window size of
1 s. However, if the average velocity of a window is
less than 5 km h
−1
, we discard that window because
the car is idling or barely moving. For each window,
we calculate a window score based on the driver’s cur-
rent driving behavior. Each window score contributes
to the overall driving behavior score.
For each non-overlapping window ω
i
, we cal-
culate the car’s total acceleration ka(t)k (see Equa-
tion (6)). The total acceleration includes both driving
straight ahead and turning, as it is made up of longitu-
dinal and lateral acceleration. As a result, the total ac-
celeration is particularly suitable for measuring driv-
ing behavior, since accelerations, decelerations and
turnings are sufficient to represent all types of driv-
ing maneuvers (Van Ly et al., 2013).
To measure driving behavior based on the total
acceleration ka(t)k, we leverage a safety threshold
(denoted as θ
t
) that is based on the physical limita-
tions of car dynamics and was introduced by Eboli et
al. (Eboli et al., 2016). The safety threshold θ
t
(in
ms
−2
) is calculated using the car’s velocity v(t) (in
kmh
−1
):
θ
t
= g ·
"
0.198 ·
v(t)
100
2
− 0.592 ·
v(t)
100
+ 0.569
#
,
(7)
where g is the gravitational acceleration on Earth
and v(t) ≤ 150 kmh
−1
. The safety threshold value
is defined for velocities up to 150 kmh
−1
(Eboli
et al., 2016). Hence, we use the safety threshold of
150 kmh
−1
for velocities greater than 150 km h
−1
.
Online Driving Behavior Scoring using Wheel Speeds
419

0
20
40
60
80
100
0 0.2 0.4 0.6 0.8 1 1.2
Window score s
i
Mean quotient ρ
‾‾
i
of window ω
i
Piecewise scoring function
Figure 1: Piecewise scoring function used in this paper for
calculating the window score.
The safety threshold θ
t
defines a safety domain in
which the total acceleration ka(t)k is considered safe,
i.e. it is physically safe to drive the car under these
conditions (Eboli et al., 2016):
ka(t)k < θ
t
(8)
If the total acceleration ka(t)k exceeds the safety
threshold θ
t
, driving is considered unsafe. In gen-
eral, an unsafe driving situation is due to aggressive
driving (Eboli et al., 2016).
For each time step t of the window ω
i
, we calcu-
late the quotient of total acceleration ka(t)k and safety
threshold θ
t
(denoted as ρ
t
):
ρ
t
=
ka(t)k
θ
t
(9)
The quotient ρ
t
indicates how close the driving behav-
ior is to a physically unsafe driving situation at time
step t. The arithmetic mean of all quotients ρ
t
of the
window ω
i
is denoted as ρ
i
.
We use the mean quotient ρ
i
of the window ω
i
for
calculating the window score s
i
∈ [0, 100] that indi-
cates the current driving behavior. In detail, we cal-
culate the window score s
i
∈ [0, 100] by the following
piecewise function (referred to as scoring function):
s
i
=
(
100 · (ρ
i
− 1)
2
0 ≤ ρ
i
< 1
0 otherwise
(10)
The scoring function is depicted in Figure 1. This
scoring function allows to account for the closeness
of the driving behavior within the window to a physi-
cally unsafe driving situation. If the driving behavior
is most safe (i.e. least aggressive), the window score
is close to 100 points. In turn, the window score is
close to 0 points if the driving behavior is most un-
safe (i.e. most aggressive). The less aggressive the
driving behavior, the faster the score increases. This
should motivate drivers to drive less aggressive.
As mentioned before, each window score con-
tributes to the overall driving behavior score. We cal-
culate the overall driving behavior score s
t
∈ [0, 100]
at time t as the arithmetic mean of all window scores
s
1
, . . . , s
i
calculated up to time t:
s
t
=
1
i
i
∑
j=1
s
j
(11)
By using the mean of the window scores, we consider
the behavioral history of a driver throughout the entire
trip. This leads to a fair score, as drivers who have
driven non-aggressive for a long time do not risk their
good scores immediately if they drive aggressive for a
short term. Vice versa, this also applies to aggressive
drivers who drive non-aggressive in the short term.
6 EVALUATION
In order to evaluate our online scoring algorithm, we
first conduct a driving experiment in a controlled en-
vironment at our university. Then, we use a freely
available data set (Kwak et al., 2016) recorded in a
driving experiment with five drivers in Seoul to eval-
uate our algorithm in an uncontrolled environment.
6.1 Controlled Environment
In this section, we examine whether our scoring al-
gorithm can identify aggressive driving behavior. For
this, we conduct a driving experiment in a controlled
environment where the drivers complete a test course
under time pressure. In general, hurried drivers tend
to drive more aggressively (Fitzpatrick et al., 2017).
Thus, we expect a driver’s score to be lower when
the driver is under time pressure. If this is the case,
our scoring algorithm can identify aggressive driving
behavior. Below, we first describe the setup of our
driving experiment. Then, we present and discuss the
results.
6.1.1 Experimental Setup
In order to examine whether the driving behavior
score is lower when driving under time pressure, we
set up a test course on the university parking lot. The
test course is visualized in Figure 2 and measures
about 350 m. On this test course, the drivers have to
drive twice through a slalom course and have to make
a change of direction once.
A total of five drivers participate in this experi-
ment at daytime in rainy weather conditions. Each
driver drives the test course three times. There is
no time limit for the first trip and the drivers are in-
structed to drive in a manner appropriate to them-
selves. However, the time needed to complete the
first trip is measured. Based on this time, a time limit
VEHITS 2020 - 6th International Conference on Vehicle Technology and Intelligent Transport Systems
420

Figure 2: Test course on the university parking lot including
two slalom sections and a change of direction.
is set for the two following trips. The time limit of
the second trip is 90% of the measured time. For the
third trip, the time limit is 75% of the measured time.
The drivers are instructed to complete the test course
within the respective time limits. During the second
and the third trip, the drivers are informed about the
remaining time. However, the driving behavior score
is not displayed to the drivers in any of the three trips
in order to avoid influencing the driving behavior.
Throughout the experiment, a Raspberry Pi 2
equipped with a PiCAN2 board
1
is connected to the
car’s high speed CAN bus. To ensure a reproducible
experimental setup, we record the entire CAN bus
data while driving and replay the CAN log file to a vir-
tual CAN interface on the Raspberry Pi 2 afterwards.
We prototyped our scoring algorithm in Python and
all calculations are performed on a Raspberry Pi 2
while replaying the CAN log file.
6.1.2 Results
Table 1 summarizes the results of our driving exper-
iment in a controlled environment. For each trip of
each driver, the table shows the measured time, the
time limit, the overall driving behavior score at the
end of the trip (see Equation (11)). Furthermore, the
table provides the arithmetic mean of the overall driv-
ing behavior scores weighted by the measured times
for each driver.
All drivers reduce their driving times from the first
to the second and from the second to the third trip
while keeping to the time limits. The average driving
time for the first trips is 74 s. For the second and third
trip, the average driving time reduces to 56 s and 50 s
1
http://skpang.co.uk/catalog/pican2-canbus-board-for-
raspberry-pi-23-p-1475.html (accessed November 29,
2019)
2
4
6
8
10
A/2
A/3
B/2
B/3
C/2
C/3
D/2
D/3
E/2
E/3
Times smaller than score of 1st trip
Driver/Trip
Score of 2nd trip
2.09
5.38
3.06 3.06
3.41
Score of 3rd trip
5.22
9.91
3.99
7.39
5.69
Figure 3: Visualization of the change in driving behavior
during the second and third trip of each driver, i.e. how
many times the scores of the second and third trips are
smaller compared to the driver’s score of the first trip.
respectively. Based on the first trip, we determine the
time limits for the subsequent trips. The time limits
range from 56 s to 75 s for the second and 47 s to 62 s
for the third trip.
As there is no time limit for the first trip and the
drivers are instructed to drive in a manner appropriate
to themselves, we can use the overall driving behavior
score of the first trip as a baseline to measure the in-
dividual change in driving behavior in the second and
third trip for each driver. For this, we determine how
many times the overall driving behavior scores of the
second and third trips are smaller than the score of the
first trip. Figure 3 illustrates the individual change in
driving behavior of each driver. The respective over-
all driving behavior scores of each driver are given in
Table 1. The individual driving behavior of driver B
changes the most in both trips towards an aggressive
driving style compared to all other drivers. The driv-
ing behavior scores of driver B’s second and third trip
(3.74 and 2.03 points) are 5.38 and 9.91 times smaller
than driver B’s baseline score (20.12 points). In the
second trip, driver A’s driving behavior changes least
compared to the other drivers, i.e. by a factor of 2.09
from 11.5 to 3.37 points. For driver C, the individual
driving behavior changes similarly in the second and
third trip. The driving behavior score decreases by
a factor of 3.06 from 31.06 points to 10.16 in driver
C’s second trip. In the third trip, the driving behav-
ior of driver C changes by a factor of 3.99 from 31.06
to 7.79 points. Hence, driver C’s driving behavior is
almost constant during the second and third trip.
In addition to the individual change in the driv-
ing behavior, we also compare the driving behavior
of the drivers with each other. For this, we use the
weighted means of the overall driving behavior scores
given in Table 1. In terms of aggressive and unsafe
driving, driver E has the worst driving behavior in
all three trips with a weighted mean score of 6.18
Online Driving Behavior Scoring using Wheel Speeds
421

Table 1: Results of our experiment in a controlled environment. For each driver, the table shows the measured times, the time
limits, the overall driving behavior scores at the end of each trip and the arithmetic mean of the driver’s scores weighted by
the measured times.
Driver Measured time Time limit Overall driving behavior score Weighted mean score
1st trip 2nd trip 3rd trip 2nd trip 3rd trip 1st trip 2nd trip 3rd trip
A 83 s 67 s 56 s 75 s 62 s 32.26 15.47 6.18 19.71
B 69 s 50 s 47 s 62 s 52 s 20.12 3.74 2.03 10.06
C 80 s 55 s 52 s 72 s 60 s 31.06 10.16 7.79 18.44
D 77 s 55 s 50 s 69 s 58 s 32.39 10.57 4.38 18.1
E 62 s 51 s 45 s 56 s 47 s 11.5 3.37 2.02 6.18
points, followed by driver B with a weighted mean
score of 10.06 points. Drivers C and D have a compa-
rable aggressive driving behavior with weighted mean
scores of 18.44 and 18.1 points respectively. Overall,
driver A’s driving behavior is the least aggressive with
a weighted mean score of 19.71 points.
In summary, the driving behavior scores decrease
with decreasing time limits for all drivers. Thus, a
lower score reflects a more aggressive driving behav-
ior, as driving behavior tends to be more aggressive
under time pressure (Fitzpatrick et al., 2017). This
shows that our scoring algorithm is able to identify
aggressive driving.
6.2 Uncontrolled Environment
In this section, we evaluate whether our scoring al-
gorithm correctly assesses driving behavior in an un-
controlled environment, i.e. when the drivers were
not instructed by us and the trips were performed in-
dependently of our work. In particular, we compare
our online scoring algorithm with an offline cluster-
ing approach to examine whether our algorithm yields
similar results. Below, we describe the experimental
setup and present the results.
6.2.1 Experimental Setup
We use wheel speeds from a freely available data set
recorded in a driving experiment with five drivers in
Seoul (Kwak et al., 2016). Each driver completed
four comparable trips (about 5.5 km each) in an urban
area, resulting in a total of 20 trips. The wheel speeds
were recorded at 1 Hz during driving. We resample
the wheel speeds to 100 Hz by linear interpolation and
calculate the kinematic car data as described in Sec-
tion 4. However, for one of the trips no wheel speed
data was recorded, thus we can only use 19 of the trips
in our evaluation.
6.2.2 k-Means Clustering
The freely available data set does not contain any in-
formation about the driving behavior of the drivers
during the trips. However, clustering algorithms are
well established to group drivers and their trips ac-
cording to their driving behavior (Mainardi et al.,
2018; Fugiglando et al., 2019; Mantouka et al., 2019).
Thus, we label the driving behavior of the trips based
on k-means clustering, i.e. we group the trips accord-
ing to their underlying driving characteristics. We use
the clustering results to evaluate the results of our on-
line scoring algorithm.
The feature vector of each trip includes a total of
12 statistical features of the trip’s acceleration and
deceleration events, because these events can char-
acterize driving behavior. For example, aggressive
drivers usually accelerate and brake stronger than
non-aggressive drivers. An acceleration event is char-
acterized by an increasing velocity. Accordingly, a
deceleration event is characterized by a decreasing ve-
locity. We calculate the average and standard devia-
tion of the longitudinal acceleration a
lon
(t) and lateral
acceleration a
lat
(t) for each acceleration event and in-
clude the respective averages as features in the trip’s
feature vector. In addition, we include the average and
standard deviation of the car’s velocity v(t) of all ac-
celeration events in the trip’s feature vector. The same
applies to deceleration events.
The silhouette score measures the clustering va-
lidity and can be used to find the optimal number of
clusters (Rousseeuw, 1987). Based on the silhouette
score, we cluster the trips into two clusters. We inter-
pret the cluster centers in terms of driving characteris-
tics and define which cluster represents which kind of
driving behavior, i.e. non-aggressive and aggressive.
We select the cluster with the higher feature values
in the center as aggressive. Then we assign a label
to each trip according to its cluster, resulting in 10
non-aggressive and 9 aggressive trips as illustrated in
Figure 4.
VEHITS 2020 - 6th International Conference on Vehicle Technology and Intelligent Transport Systems
422
-2
-1
0
1
2
3
4
5
-6 -4 -2 0 2 4 6
Principal Component 2
Principal Component 1
Non-aggressive cluster
Aggressive cluster
Cluster centers
Figure 4: Results of k-means clustering. For visualization,
k-means clustering was performed on PCA-reduced data.
40
45
50
55
60
65
A/1
A/2
A/3
A/4
B/1
B/2
B/3
B/4
C/1
C/2
C/3
C/4
D/1
D/2
D/3
D/4
E/1
E/2
E/4
Overall driving behavior score
Driver/Trip
Non-aggressive driving behavior
Aggressive driving behavior
Score threshold
Figure 5: Overall driving behavior score of each trip of each
driver for the freely available data set. The bar color/pattern
shows the k-means clustering-based driving behavior labels.
The dashed black line shows the score threshold for classi-
fying the driving behavior based on our scoring algorithm.
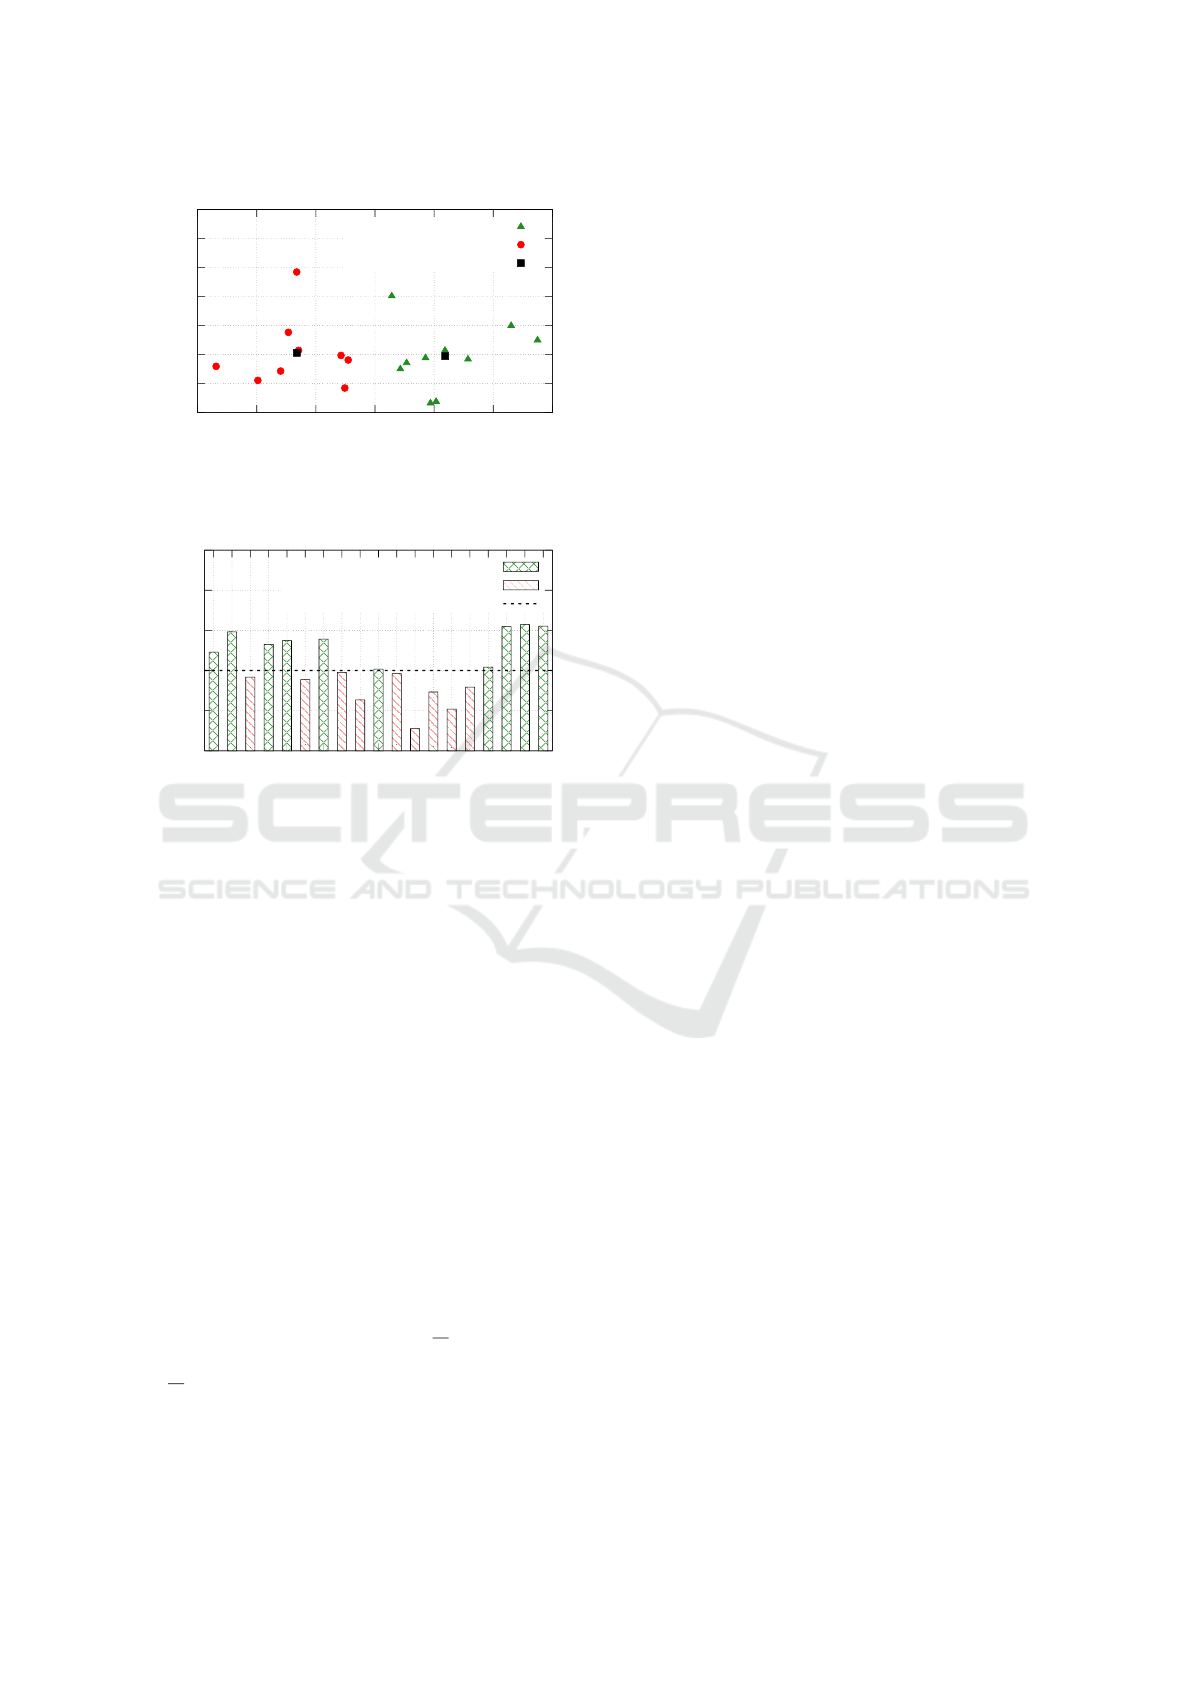
6.2.3 Driving Behavior Score
For each trip, we calculate the overall driving behav-
ior score as defined in Equation (11). Figure 5 shows
both the k-means clustering-based labels as well as
the calculated driving behavior scores. We choose
a score threshold of 50 points to classify the driv-
ing behavior as non-aggressive or aggressive. This
score threshold divides the scoring range evenly be-
tween the two classes of driving behavior considered.
A score greater than or equal 50 points is classified
as non-aggressive and a score less than 50 points is
classified as aggressive.
As Figure 5 shows, we correctly classified the 10
non-aggressive and the 9 aggressive trips. Thus, the
score threshold of 50 points provides a good classifi-
cation performance. In our scoring function defined
in Equation (10), the mean quotient ρ
i
≈ 0.29 yields a
score of 50 points. Thus, we identify a mean quotient
of ρ
i
≈ 0.29 as a good threshold for distinguishing be-
tween non-aggressive and aggressive driving behav-
ior.
The results show that our scoring algorithm is suit-
able for assessing driving behavior in uncontrolled
environments, as it performs equally well as the k-
means clustering algorithm, i.e. an offline algorithm.
In addition, our algorithm does not require data from
other trips and works without prior knowledge and is
thus of practical use.
7 CONCLUSION
We presented an online scoring algorithm that rates
the aggressiveness of a driver. This algorithm can
be used to indicate a driver that he or she is taking
too much risk. Our approach solely relies on wheel
speeds which are available on the CAN bus of con-
temporary cars. No additional data like GPS, speed
limits, traffic- or weather conditions are required. Fur-
thermore, our algorithm can score the driving online
while it happens, unlike other approaches that can
compare several trips after they are completed.
We first evaluated our scoring algorithm with
a driving experiment in a controlled environment,
where ground truth was known due to the experimen-
tal setup. The results show that our scoring matches
the actual driving behavior. In addition, we compared
our online scoring algorithm with an offline cluster-
ing approach that took a set of comparable trips as
input. The results show that our online algorithm per-
formed equally well when compared to the offline al-
gorithm. However, our approach yields a score im-
mediately and does not need a set of comparable trips
and not even the entire trip for scoring it. Therefore,
our approach is of practical use because it is an online
algorithm, has a low computational complexity and
requires only a minimal data set, namely the wheel
speeds.
Future work should include other physical quan-
tities in addition to the total acceleration in order to
improve the measurement of driving behavior. Fur-
thermore, we suggest to compare the presented scor-
ing algorithm with other existing algorithms. For this,
however, a suitable data set must be collected, since
to the best of our knowledge no such data set exists.
We did not study the influence of displaying the score
on the driver’s driving behavior and leave it for future
work.
ACKNOWLEDGEMENTS
We thank the Chair of Mechatronics of the University
of Duisburg-Essen and in particular Dieter Schramm
Online Driving Behavior Scoring using Wheel Speeds
423

for providing the Ford C-Max for our driving experi-
ment.
REFERENCES
Abdelrahman, A., Hassanein, H. S., and Abu-Ali, N.
(2018). Data-driven robust scoring approach for driver
profiling applications. In 2018 IEEE Global Commu-
nications Conference (GLOBECOM), pages 1–6.
Bergasa, L. M., Almer
´
ıa, D., Almaz
´
an, J., Yebes, J. J., and
Arroyo, R. (2014). Drivesafe: An app for alerting
inattentive drivers and scoring driving behaviors. In
2014 IEEE Intelligent Vehicles Symposium Proceed-
ings, pages 240–245.
Carfora, M. F., Martinelli, F., Mercaldo, F., Nardone, V.,
Orlando, A., Santone, A., and Vaglini, G. (2019). A
”pay-how-you-drive” car insurance approach through
cluster analysis. Soft Comput., 23(9):2863–2875.
Carlson, C. R., Gerdes, J. C., and Powell, J. D. (2002).
Practical position and yaw rate estimation with gps
and differential wheelspeeds. In Proceedings of AVEC
2002 6th International Symposium of Advanced Vehi-
cle Control.
Castignani, G., Derrmann, T., Frank, R., and Engel, T.
(2015). Driver behavior profiling using smartphones:
A low-cost platform for driver monitoring. IEEE In-
telligent Transportation Systems Magazine, 7(1):91–
102.
Chen, W., Xiao, H., Wang, Q., Zhao, L., and Zhu, M.
(2016). Integrated Vehicle Dynamics and Control.
John Wiley & Sons Singapore Pte. Ltd.
Council of the European Union and European Parliament
(2016). Regulation (EU) 2016/679 of the European
Parliament and of the Council of 27 April 2016 on the
protection of natural persons with regard to the pro-
cessing of personal data and on the free movement of
such data, and repealing Directive 95/46/EC (General
Data Protection Regulation). OJ, L 119:1–88.
Dula, C. S. and Geller, E. (2003). Risky, aggressive, or
emotional driving: Addressing the need for consis-
tent communication in research. Journal of Safety Re-
search, 34(5):559 – 566.
Eboli, L., Mazzulla, G., and Pungillo, G. (2016). Com-
bining speed and acceleration to define car users’ safe
or unsafe driving behaviour. Transportation Research
Part C: Emerging Technologies, 68:113 – 125.
Eboli, L., Mazzulla, G., and Pungillo, G. (2019). Incor-
porating vertical acceleration for defining driving be-
haviour. International Journal of Information Re-
trieval Research, 9(2):38–48.
Fitzpatrick, C. D., Samuel, S., and Knodler, M. A. (2017).
The use of a driving simulator to determine how
time pressures impact driver aggressiveness. Accident
Analysis & Prevention, 108:131 – 138.
Fugiglando, U., Massaro, E., Santi, P., Milardo, S., Abida,
K., Stahlmann, R., Netter, F., and Ratti, C. (2019).
Driving behavior analysis through can bus data in an
uncontrolled environment. IEEE Transactions on In-
telligent Transportation Systems, 20(2):737–748.
Imkamon, T., Saensom, P., Tangamchit, P., and Pongpai-
bool, P. (2008). Detection of hazardous driving behav-
ior using fuzzy logic. In 2008 5th International Con-
ference on Electrical Engineering/Electronics, Com-
puter, Telecommunications and Information Technol-
ogy, volume 2, pages 657–660.
James, L. (2009). Road Rage and Aggressive Driving:
Steering Clear of Highway Warfare. Prometheus
Books.
Kar, G., Asiroglu, B., and Bir, F. S. (2019). Scotto: Real-
time driver behavior scoring using in-vehicle data.
In 2019 IEEE 89th Vehicular Technology Conference
(VTC2019-Spring), pages 1–5.
Kwak, B. I., Woo, J., and Kim, H. K. (2016). Know your
master: Driver profiling-based anti-theft method. In
2016 14th Annual Conference on Privacy, Security
and Trust (PST), pages 211–218.
Luo Yong and Li Hui (2009). The analysis of the aggres-
sive driving for the traffic safety. In 2009 International
Conference on Industrial Mechatronics and Automa-
tion, pages 117–120.
Ma, Y., Zhang, Z., Chen, S., Yu, Y., and Tang, K. (2019).
A comparative study of aggressive driving behavior
recognition algorithms based on vehicle motion data.
IEEE Access, 7:8028–8038.
Mainardi, N., Zanella, M., Reghenzani, F., Raspa, N., and
Brandolese, C. (2018). An unsupervised approach for
automotive driver identification. In Proceedings of the
Workshop on INTelligent Embedded Systems Architec-
tures and Applications, INTESA ’18, pages 51–52,
New York, NY, USA. ACM.
Mantouka, E. G., Barmpounakis, E. N., and Vlahogianni,
E. I. (2019). Identifying driving safety profiles from
smartphone data using unsupervised learning. Safety
Science, 119:84 – 90.
Marchetti, M. and Stabili, D. (2019). Read: Reverse engi-
neering of automotive data frames. IEEE Transactions
on Information Forensics and Security, 14(4):1083–
1097.
Paleti, R., Eluru, N., and Bhat, C. R. (2010). Examining
the influence of aggressive driving behavior on driver
injury severity in traffic crashes. Accident Analysis &
Prevention, 42(6):1839–1854.
Reif, K., editor (2011). Bosch Autoelektrik und Autoelek-
tronik. Vieweg+Teubner Verlag.
Rousseeuw, P. J. (1987). Silhouettes: A graphical aid to
the interpretation and validation of cluster analysis.
Journal of Computational and Applied Mathematics,
20:53 – 65.
Van Ly, M., Martin, S., and Trivedi, M. M. (2013). Driver
classification and driving style recognition using iner-
tial sensors. In 2013 IEEE Intelligent Vehicles Sympo-
sium (IV), pages 1040–1045.
VEHITS 2020 - 6th International Conference on Vehicle Technology and Intelligent Transport Systems
424
