
A Comparative Analysis of “Urban Expansion” using Remotely
Sensed Data of CORINE Land Cover and Global Human Settlement
Layer in Estonia
Najmeh Mozaffaree Pour
1a
and Tõnu Oja
2b
1
Department of Geography, University of Tartu, Tartu, Vanemuise 46, Tartu, Estonia
2
Department of Geography, University of Tartu, Tartu, Estonia
Keywords: Urban Expansion, Remote Sensing, CORINE (Coordination of Information on the Environment) Land Cover,
Global Human Settlement (GHSL)- Built-up Layer, Google Earth Engine (GEE), Estonia.
Abstract: Monitoring urban expansion is important because the policy makers in cities must detect the changes to
provide services and manage resources for urban dwellers. In this study we analyse the built-up areas extracted
from very high-resolution images of two important databases of CORINE land cover and GHSL; Built-Up
Grid to map urban expansion at local level of cities of Tallinn and Tartu in their context (County) in Estonia.
The reason for selecting these datasets was the representation of an available temporal data in many timespans
which allowed extracting urban expansion in our case studies. The analysis was carried out over a subset of
these datasets in ArcGIS environment and the data of GHSL- Built-Up Grid was extracted from Google Earth
Engine platform. Therefore, the results showed that there was an increase in the amounts of built-up areas and
its rate in these two counties while based on these two databases the results were not similar in areas and cells
but similar in rate and growth patterns.
1 INTRODUCTION
Monitoring urban expansion is important because the
policy makers in cities must detect the changes to
provide services and manage resources for urban
dwellers. While urbanization is universal, changes in
land cover and landscape pattern around the globe are
irrevocable. Therefore, the spatial and temporal
characteristics and consequences of urbanization
must be scientifically understood. A widely used
technique for detecting the urban expansion is
remotely sensed data. Remote sensing (RS)
technology enhances the availability of spatially
explicit and temporally consistent land use and land
cover change information (Herold et al., 2002;
Michishita et al., 2012).
Satellite remote sensing offers a tremendous
advantage over historical maps or air photos, as it
provides recurrent and consistent observations over a
large geographical area, reveals explicit patterns of
land cover and land use, and presents a synoptic view
of the landscape (Jensen et al., 1999). Increased
a
https://orcid.org/ 0000-0001-9969-6631
b
https://orcid.org/0000-0001-7603-220X
availability of very high-resolution remotely sensed
images in recent years, coupled with advancements in
high-performance computing resources and efficient
image processing algorithms have fostered the
development of high-resolution human settlement
datasets (Cheriyadat et al., 2007, Vijayaraj et al.,
2007, Patlolla et al., 2012).
The availability of regional and global land cover
products, provides us with a wide variety of options
to utilize for our own respective research. However,
these products differ on the basis of the methodology
used to create them and the classification systems
used to generate the several land use partitions
(Defries et al., 1994; Fritz et al., 2010).
Starting with the GHS-BUILT product, it was the
result of a large scale experiment conducted by the
European Commission in 2014 aimed at extracting
information on built-up areas from Landsat (Pesaresi
et al., 2016), producing the first multi-temporal
explicit description of the evolution of built-up
presence in the past 40 years. The Landsat product
contains a set of multi-temporal and multi-resolution
Mozaffaree Pour, N. and Oja, T.
A Comparative Analysis of “Urban Expansion” using Remotely Sensed Data of CORINE Land Cover and Global Human Settlement Layer in Estonia.
DOI: 10.5220/0009195101430150
In Proceedings of the 6th International Conference on Geographical Information Systems Theory, Applications and Management (GISTAM 2020), pages 143-150
ISBN: 978-989-758-425-1
Copyright
c
2020 by SCITEPRESS – Science and Technology Publications, Lda. All rights reserved
143
grids. The main product is the multi-temporal
classification layer on built-up presence derived from
the Global Land Survey (GLS) Landsat image
collections (GHSL homepage).
In particular, the GHSL project is focused on
innovative automatic image information extraction
processes, using metric and decametric scale satellite
data input (Pesaresi et al., 2013) and making the
information gathering is independent from any
rural/urban prior abstract definition (Pesaresi et
al.,2015). As Florczyk et al., 2016 mentioned “The
main characteristics of the developed methodology
for GHSL are a scene-based processing and a
multiscale learning paradigm that combines auxiliary
datasets with the extraction of textural and
morphological image features”.
Turning to the CORINE land cover database, the
project inventory was initiated in 1985 (reference
year 1990). Updates have been produced in 2000,
2006, 2012, and 2018. It consists of an inventory of
land cover in 44 classes. The CORINE uses a
Minimum Mapping Unit (MMU) of 25 hectares (ha)
for areal phenomena and a minimum width of 100 m
for linear phenomena. The CORINE is produced by
the majority of countries by visual interpretation of
high resolution satellite imagery. In a few countries
semi-automatic solutions are applied, using national
in-situ data, satellite image processing, GIS
integration and generalisation (CORINE Land Cover
homepage). The CORINE is recognized by decision-
makers as an essential reference dataset for spatial
and territorial analysis on different territorial levels
(Büttner, 2002).To provide more information about
the methodology used for the final products of these
two databases, as follows in Table 1.
In this study the built-up areas data extracted from
very high-resolution images will provide unique
understanding in the mapping of urban expansion and
further the knowledge of human signatures at local
levels. Therefore, we evaluated a set of two datasets,
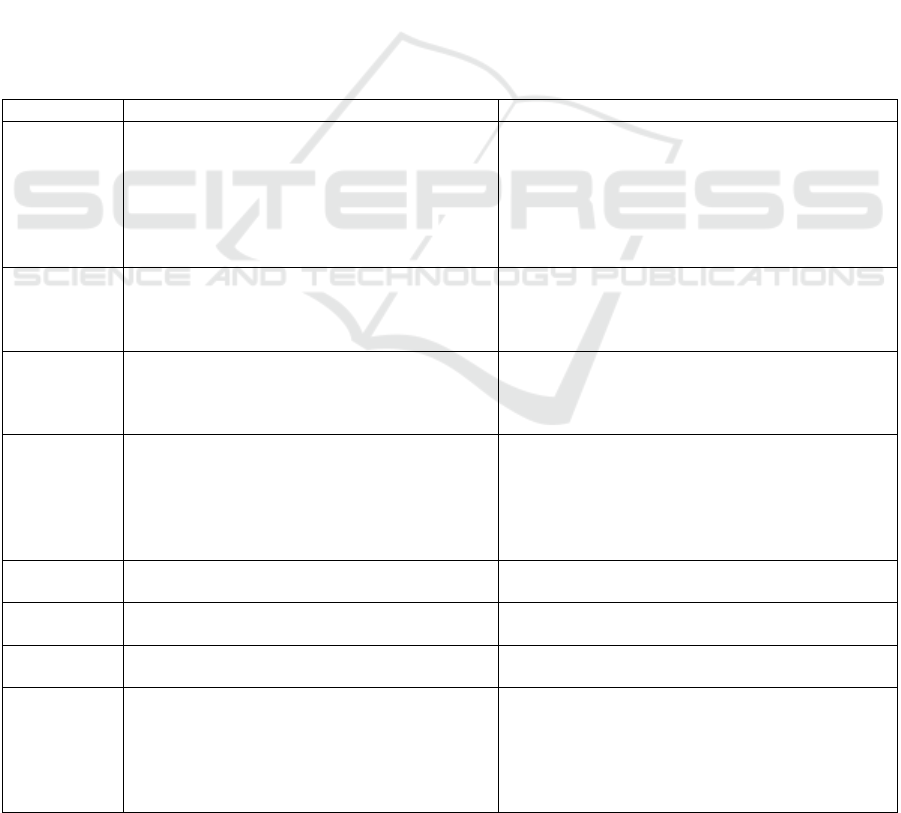
Table 1: Conceptual Frameworks for overview of COTINE and GHSL databases (CORINE Land Cover homepage, GHSL -
Global Human Settlement Layer homepage).
Subjects CORINE LAND COVER PROGRAMME GHSL PROGRAMME
Classification
of Urban area
The artificial surfaces shape the urban areas main
classes of which are Continuous urban fabric,
Discontinuous urban fabric, Industrial or
commercial units, Port areas, Airports, Mineral
extraction sites, Dump sites, Construction sites,
Road and rail networks and associated lands,
Green urban areas and Sport and leisure facilities.
The built-up area class is defined as the union of all the
spatial units collected by the specific sensor and
containing a building or part of it. Buildings are
enclosed constructions above ground which are
intended or used for the shelter of humans, animals,
things or for the production of economic goods and that
refer to any structure constructed or erected on its site.
Satellite data
and sensor
used
CORINE Land Cover from Copernicus Land
Monitoring Service of European Nations Website
for years 1990, 2000, 2006, 2012 and 2018.
The RS data used are the Landsat programme, which
used of 32808 scenes organized in four collections
corresponding to the epochs 1975, 1990, 2000, and
2014.
Scale The scale chosen for the project was 1:100 000
The surface area of the smallest unit mapped in the
project is 25 hectares.
The scale chosen for the project was 1:50 000
The capacity to discriminate built-up areas was
demonstrated with optical sensors in the spatial
resolution ran
g
e of 0.5m-10m.
Innovation At Community level, in the CORINE system,
information on land cover and changing land cover
is directly useful for determining and implementing
environment policy and can be used with other data
(on climate, inclines, soil, etc.) to make complex
assessments
(
e.
g
. ma
pp
in
g
erosion risks
)
.
The new method generalizes the single-variable
single-training set optimization techniques in the
machine learning phase, to the scenario where the
combination of multiple variables in input are taken
into consideration with a combination of multiple
trainin
g
set collections.
Access to the
data
Free access for all users Fully open and free data and methods access
Coordinate
S
y
stems
EPSG:3035, ETRS89 / LAEA Europe Spherical Mercator (EPSG:3857), World Mollweide
(
EPSG:54009
)
Temporal
extent
CLC1990, CLC2000, CLC2006, CLC2012,
CLC2018
1975-1990-2000-2014
Spatial extent Europe:
1990: 26 (27 with late implementation) countries
2000: 30 (35 with late implementation) countries
2006: 38 countries
2012: 39 countries
2018: 39 countries
Global
GISTAM 2020 - 6th International Conference on Geographical Information Systems Theory, Applications and Management
144
consisting of GHSL alongside CORINE land cover.
While GHSL dataset is available as global coverage,
CORINE land cover dataset is a continental program
for Europe. The reason for selecting these datasets
relies on the fact that they represent in temporal and
in many timespans which allowed extracting urban
expansion in our case studies. The analysis was
carried out over a subset of these datasets in ArcGIS
environment and the data of GHSL- Built-Up Grid
were extracted from GEE platform.
2 METHODS
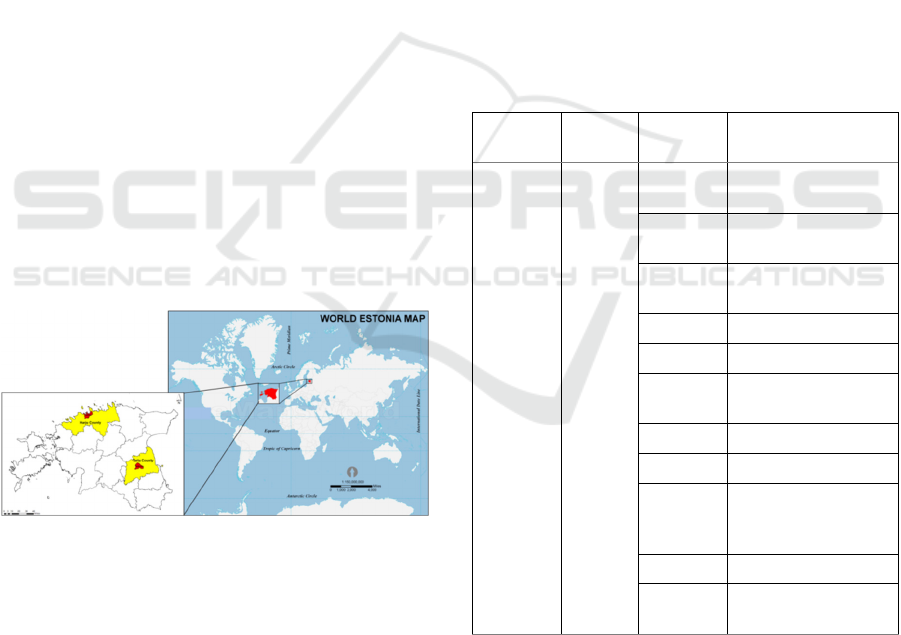
2.1 Study Area
Estonia is located in Northern Europe, on the eastern
coast of the Baltic Sea. Estonia’s neighbours are
Russia in the East, Latvia in the South, Sweden in the
West and Finland in the North. Its land border is 645
km long, with half of it running along rivers and lakes.
It lies between 57.3 and 59.5 latitude and 21.5 and
28.1 longitude (ESTONICA; Encyclopaedia about
Estonia). In this study we selected two major counties
of Estonia (Figure 1). Harju County which is located
in northern Estonia and the capital and largest city of
Estonia, Tallinn, is situated there. Tartu County
which is located in eastern Estonia and covers 6.9%
of its territory, whereas the city of Tartu is the centre
of the county located at a distance of 186 km from
Tallinn.
Figure 1: Study area.
2.2 Data and Data Processing
In this research spatial data includes
raster format of GHSL, Built-Up Grid 1975-1990-
2000-2015 (P2016) with Image ID:
JRC/GHSL/P2016/BUILT_LDSMT_GLOBE_V1 at
GEE platform code editor and raster data of CORINE
land cover dataset from Copernicus Land Monitoring
Service of European Nations Website (CORINE
Land Cover webpage). GIS vector data was county
boundary shapefiles obtained from Estonian Land
Board Geoportal of Estonia (Maa-amet webpage).
To employ geostatistical analysis methods to
compare and determine the urban expansion,
projection conversion and resolution resetting were
performed. The coordinate system of two datasets
was projected to Lambert Conformal Conic
(Estonia_1997_Estonia_National_Grid) provided by
the World Geodetic System 1984 (WGS84) reference
system. The spatial resolutions of these two datasets
were unified after the grid unit was determined and
data were prepared in the same grid unit size.
Raster data of CORINE land cover were 100-
meter resolution which was resampled to 30 meters’
resolution using nearest-neighbour interpolation to
match the pixel size of both extracted databases. GIS
(ArcMap from the products of ArcGIS Desktop 10.6)
was used to generate and analyze the data. We also
used built-up areas as the “artificial surface” layers of
CORINE land cover database (Table 2).
Table 2: The vector data from CORINE land cover database
reclass to built-up in this study.
CORINE
class
Reclass
Name
CORINE
code
Land cover names
Artificial
Surfaces
Built-
up
111
Continuous urban
fabric
112
Discontinuous
urban fabric
121
Industrial or
commercial units
123 Port areas
124 Airports
131
Mineral extraction
sites
132 Dump sites
133 Construction sites
122
Road and rail
networks and
associated land
141 Green urban areas
142
Sport and leisure
facilities
2.3 Data Analysis
2.3.1 Spatial Distribution of Built-up Areas
using Annual Growth Rate (AGR)
To monitor the spatial distribution of urban expansion
density, in this research we used two indicators, one
A Comparative Analysis of “Urban Expansion” using Remotely Sensed Data of CORINE Land Cover and Global Human Settlement Layer
in Estonia
145
was annual growth of urban land (AGU: equation 1)
to quantify the increasing urban land areas every year
and the other one was annual growth rate of urban
land (AGR: equation 2) to quantify the urban land's
growth rate every year (He et al., 2017). These two
indicators’ calculating formulas can be expressed as,
𝐴𝐺𝑈 𝑈𝑟
𝑈𝑟
/𝑛 (1)
Where, 𝑈𝑟
and 𝑈𝑟
are the urban land area in
year 𝑡𝑛 and 𝑡 and 𝑛 is the interval of the
calculating period (in years). Annual growth rate of
urban land can be calculated as:
𝐴𝐺𝑅
1 100% (2)
Where, 𝑈𝑟
and 𝑈𝑟
are the urban land area in
year 𝑡𝑛 and 𝑡, respectively. Generally, the target
calculating unit is set to the administrative districts of
two counties.
2.3.2 Built-up Density Analysis
Following Sabo et al., (2018), the analysis of built-up
density in a grid as cell size analysis; we used a cell
size of 30×30 m. It is suitable for understanding the
capabilities of mapping of GHSL and CORINE land
cover built-up density and their spatial characteristics.
Thus to derive the built-up density, the total sum of
built-up pixels in a cell is divided by the total area of
the cell. The formula is as follows in equation 3:
𝑑𝑒𝑛𝑠
∑
(3)
Where 𝑑𝑒𝑛𝑠
is the density for cell 𝑖, 𝑏𝑢
is the
kth built‐up pixel in the specific cell 𝑖, N is the
maximum number of built‐up pixels in one cell, 𝑤
and ℎ
are the width and height of the cell,
respectively.
3 RESULTS
3.1 Results of Spatial Distribution of
Built-up Areas
Table 3 displays AGU and AGR for the Tartu County
and the Harju County. The results of the two datasets
of GHSL and CORINE land cover showed that the
most common trend in the built-up area was the
consistent increase during the years. The area of built-
up based on GHSL database in the Harju County
increased from 7415.73 ha in 1990 to a peak of
8741.16 ha in 2014 which forms average annual
growth of 54.69 ha between 1990 and 2000 and 55.61
ha between 2000 and 2014. Similarly, there was an
increase in built-up area from 22710.96 ha in 1990 to
29879.19 ha in 2012 and 30480.57 ha in 2018 which
means 1.15% annual growth rate between 1990 and
2000 and 1.90% from 2012 to 2018. It was also
apparent trend in Tartu County.
The area built-up extracted from GHSL database
in Tartu County slightly grow from 1299.15 ha in
1990 to 1583.91 ha in 2014 with a smaller annual
growth rate of 0.44% from 2000 to 2014 compared to
AGR growth (0.59%) between 1990 to 2000.
Likewise, the built-up area extracted from CORINE
land cover database showed a rise from 6988.23 ha in
1990 and 7981.65 ha in 2012 and 8353.17 in 2018.
Respectively the annual growth was in the highest
level between 2000 and 2012 at 80.40 ha and the
annual growth of rate was in its peak at 1.68%
between 2012 and 2018.
Table 3: Annual Growth Of Urban Land and Annual Growth Rate in Harju County and Tartu County.
AREA OF BUILT-
UP/AGU/AGR
AREA OF BUILT-UP(ha) AGU(ha) AGR (%)
TO
1990
2000
2012/
2014
2018
1990-
2000
2000-
2012/
2014
2012-
2018
1990-
2000
2000-
2012/
2014
2012-
2018
Harju
County
GHSL 7415 7962 8741
54 55
0.87 0.60
CORINE 22710 24814 29879 30480 210 422 100 1.15 1.03 1.90
Tartu
County
GHSL 1299 1403 1583
10 12
0.59 0.44
CORINE 6988 7016 7981 8353 2 80 61 0.39 0.77 1.68
GISTAM 2020 - 6th International Conference on Geographical Information Systems Theory, Applications and Management
146
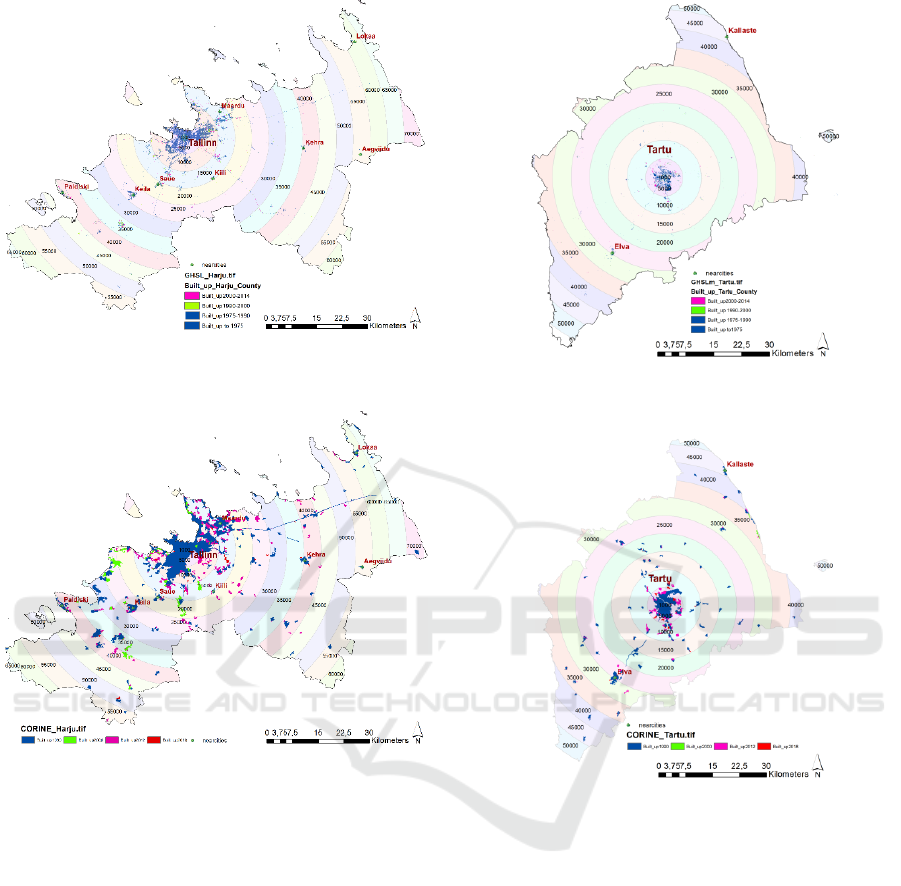
Figure 2: Built-up areas in Harju County extracted from
GHSL databases.
Figure 3: Built-up areas in Harju County extracted from
CORINE databases.
Figure 2, 3, 4 and 5 show the built-up area in both
counties extracted from GHSL database and
CORINE land cover database. Figure 2 and 3
represent the urban expansion in constant rings of
5km buffer from Tallinn. While the expansion
happened mostly in the third ring (15km) based on the
GHSL, the expansion of built-up areas significantly
occurred in the 8
th
ring (40km) from Tallinn.
Respectively the expansion of built-up area in
Tartu County took place mostly in the first ring (5km)
from Tartu based on GHSL database (Figure 4) and
continued in the 6
th
ring (30km) from Tartu based on
the CORINE land cover database (Figure 5).
Figure 4: Built-up areas in Tartu County extracted from
GHSL databases.
Figure 5: Built-up areas in Tartu County extracted from
CORINE databases.
3.2 Built-up Density Analysis Results
The results of the built-up area density analysis are
presented in Table 4 and Figures 6 and 7. The
densities are calculated per grid cells of 30×30m for
both counties. Regarding the ratio of built-up cells in
Harju County, the GHSL showed a rise from 82397
built-up cells to 97124 cells. The cell density also
increased from 0.017 (1.7%) to 0.020 (2.0%) from
year 1990 to 2014. Respectively the CORINE built-
up cells increased from 252344 to 338673 cells from
1990 to 2018 which expressed a density of 0.052
(5.2%) in 1990 developed to 0.070 (7.0%) in 2018.
A Comparative Analysis of “Urban Expansion” using Remotely Sensed Data of CORINE Land Cover and Global Human Settlement Layer
in Estonia
147
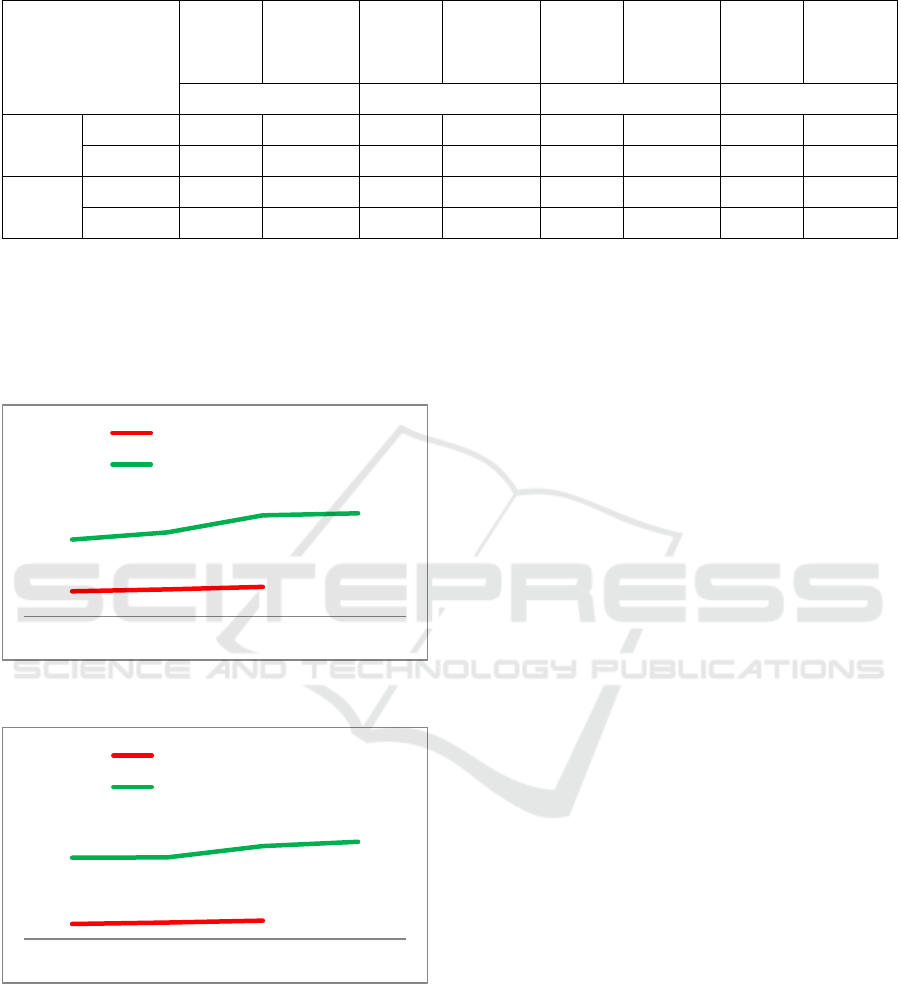
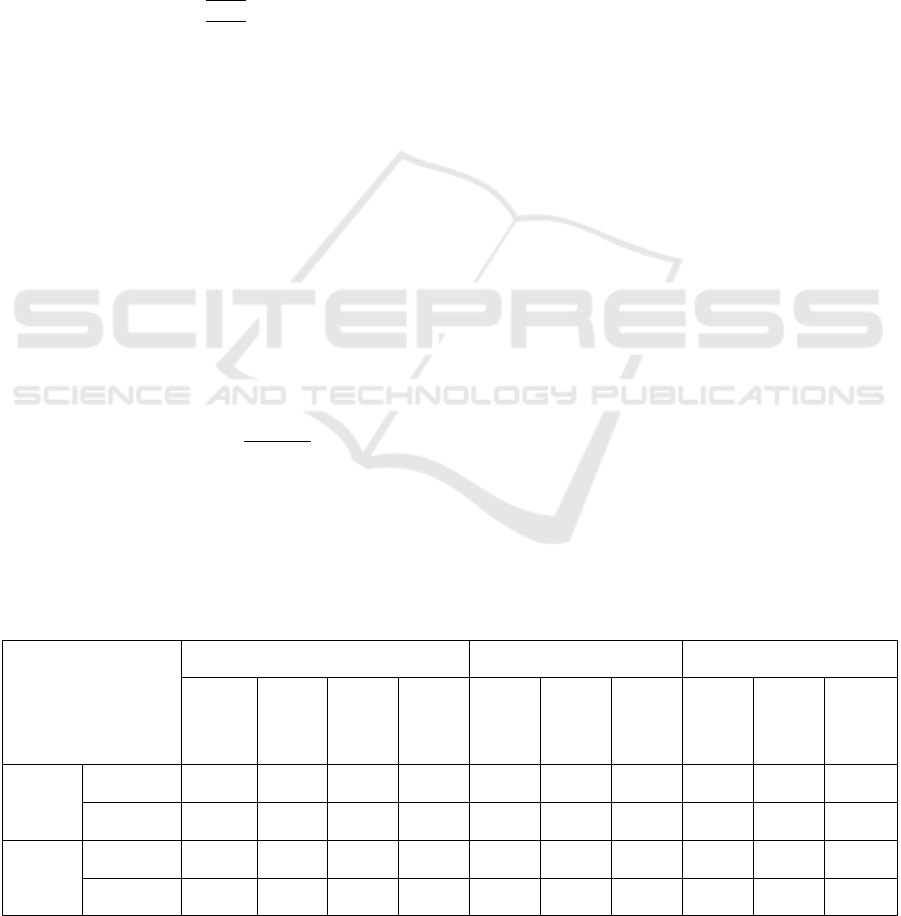
Table 4: Cell Density Analysis Results.
Cell Density
Analysis
CELL
OF
BUILT-
UP
AREA
OF
BUILT-
UP(ha)
CELL
OF
BUILT-
UP
AREA
OF
BUILT-
UP(ha)
CELL
OF
BUILT-
UP
AREA
OF
BUILT-
UP(ha)
CELL
OF
BUILT-
UP
AREA
OF
BUILT-
UP(ha)
TO 1990 2000 2012/2014 2018
Harju
County
GHSL 82397 7415 88474 7962 97124 8741
CORINE 252344 22710 275718 24814 331991 29879 338673 30480
Tartu
County
GHSL 14435 1299 15599 1403 17599 1583
CORINE 77647 6988 77965 7016 88685 7981 92813 8353
Similar growth pattern in Tartu County was
found. Based on the GHSL the density of built-up
cells was 0.3% in 1990 raised to 0.5 % in 2014.
According to CORINE there was a rise in cell density
from 2.1% in 1990 to 2.5% in 2018.
Figure 6: Built-up Cell Density (in %) in Harju County.
Figure 7: Built-up Cell Density (in %) in Tartu County.
4 DISCUSSION
The results provide evidence that the general trend of
urban expansion slightly increased in the built-up area
from 1990–2014 (extracted maps from GHSL-built-
up layer database) and from 1990- 2018 (extracted
maps from CORINE land cover database) in both
counties (Figures 8, 9, 10 and 11).
In terms of spatial distribution of built-up areas,
the two indicators of AGU and AGR were used.
While these two indicators showed increase in built-
up areas and its rate, there was a clear difference
between the data extracted from GHSL and CORINE
land cover databases.
The largest difference was related to AGU in the
Harju County from 2000 - 2014 (GHSL) / 2012
(CORINE). While 55.61 hectares added to urban
lands based on the GHSL, data of CORINE showed
increase by 422.05 hectares. Although the data
extracted from the GHSL showed less built-up areas
as compared to the CORINE during the study period,
there was a higher degree of AGU and AGR in the
GHSL in Tartu County between 1990 and 2000.
There are two main reasons for these differences.
First, it could be the difference in definition and
classification of built-up area by these two datasets.
In line with the ideas of Florczyk et al., (2016), in this
study the “artificial surface” layers of CORINE land
cover database were classified to built-up. These
consist of continuous and discontinuous urban fabric,
industrial or commercial units, port and airport areas,
construction sites, roads and even green urban areas
which are tightly related to built-up structures.
While in GHSL, as Pesaresi et al., (2013) have
mentioned, the built-up area consisted of buildings
and built-up areas. GHSL definition was based on
INSPIRE (Infrastructure for Spatial Information in
Europe) definition for buildings, but did not take into
accounts the underground buildings. Also
classification schema of the GHSL is more general
not assuming any embedded urban/rural dichotomy
(Pesaresi et al., 2009).
1.71%
1.84%
2.02%
5.25%
5.74%
6.91%
7.04%
TO 1990 2000 2012/2014 2018
Harju County GHSL
Harju County CORINE
0.39%
0.42%
0.47%
2.09%
2.09%
2.38%
2.49%
TO 1990 2000 2012/2014 2018
Tartu County GHSL
Tartu County CORINE
GISTAM 2020 - 6th International Conference on Geographical Information Systems Theory, Applications and Management
148
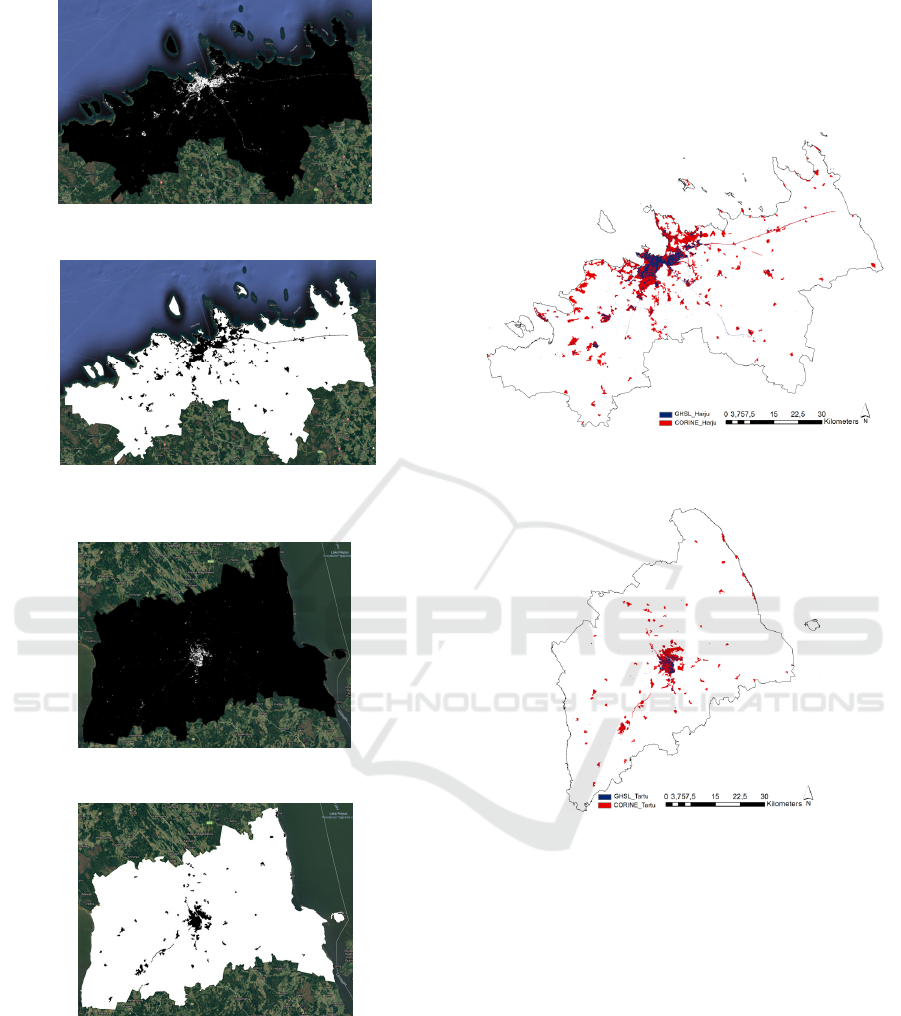
Figure 8: Urban extend maps of Harju County from GHSL.
Figure 9: Urban extend maps of Harju County from
CORINE.
Figure 10: Urban extend maps of Tartu County fromGHSL.
Figure 11: Urban extend maps of Tartu County from
CORINE.
The results of Figures 12 and 13 also represented
the urban expansion in concentric rings from the
cities of Tallinn and Tartu. While the results of urban
expansion indicated that the GHSL-built-up were
mostly in the third ring (15km) in the Harju County,
the expansion of built-up areas occurred even in the
8
th
ring (40km) from Tallinn. Respectively the results
of expansion of built-up in Tartu County showed
similar differences. Based on GHSL database the
expansion took place in the first ring (5km) from
Tartu while CORINE land cover database showed the
expansion in the 6
th
rings (30km) from Tartu.
Figure 12: Map of Built-up area difference between GHSL
and CORINE in Harju County.
Figure 13: Map of difference between GHSL and CORINE
in Tartu County.
5 CONCLUSIONS
This work presents spatial data extracted from two
important databases of CORINE land cover and
GHSL; Built-Up Grid to determine urban expansion
in two major cities of Estonia. We used temporal data
of the GHSL for 1975, 1990, 2000, and 2014 and
timespans of the CORINE data was 1990, 2000, 2012
and 2018 and the analysis was based on the last
product (2014 for GHSL and 2018 for CORINE). We
analysed the built-up areas and cells which represent
the physical dimension of human settlements and
definitely define the urban expansion of cities using
AGU, AGR and built-up density analysis.
A Comparative Analysis of “Urban Expansion” using Remotely Sensed Data of CORINE Land Cover and Global Human Settlement Layer
in Estonia
149

The results indicated the increase in the amounts
of built-up areas and its rate while in these two
databases the results were not similar in areas and
cells but similar in rate and growth patterns. We
demonstrated that the differences could be due to the
definition of built-up or as explained in conceptual
frameworks of CORINE and GHSL databases, it
could be the results of different satellite data and
sensor used for the final products, the scale of the two
datasets and the temporal extent of the data.
ACKNOWLEDGMENT
The research has been supported by the Estonian
Research Foundation grant PRG352.
REFERENCES
Cheriyadat, A., Bright, E., Potere, D., & Bhaduri, B. (2007).
Mapping of settlements in high-resolution satellite
imagery using high performance computing.
GeoJournal, 69(1-2), 119–129. doi: 10.1007/s10708-
007-9101-0
CORINE Land Cover. (2019, June 14). https://
land.copernicus.eu/pan-european/corine-land-cover
Defries, R. S., & Townshend, J. R. G. (1994). NDVI-
derived land cover classifications at a global scale.
International Journal of Remote Sensing, 15(17),
3567–3586. doi: 10.1080/01431169408954345
Florczyk, A. J., Ferri, S., Syrris, V., Kemper, T., Halkia, M.,
Soille, P., & Pesaresi, M. (2016). A New European
Settlement Map From Optical Remotely Sensed Data.
IEEE Journal of Selected Topics in Applied Earth
Observations and Remote Sensing, 9(5), 1978–1992.
doi: 10.1109/jstars.2015.2485662
Fritz, S., See, L., & Rembold, F. (2010). Comparison of
global and regional land cover maps with statistical
information for the agricultural domain in Africa.
International Journal of Remote Sensing, 31(9), 2237–
2256. doi: 10.1080/01431160902946598
GHSL - Global Human Settlement Layer. (2016, July 6).
Retrieved from https://ghsl.jrc.ec.europa.eu/
He, C., Li, J., Zhang, X., Liu, Z., & Zhang, D. (2017). Will
rapid urban expansion in the drylands of northern China
continue: A scenario analysis based on the Land Use
Scenario Dynamics-urban model and the Shared
Socioeconomic Pathways. Journal of Cleaner
Production, 165, 57–69. doi:
10.1016/j.jclepro.2017.07.018
Herold, M., Scepan, J., & Clarke, K. C. (2002). The Use of
Remote Sensing and Landscape Metrics to Describe
Structures and Changes in Urban Land Uses.
Environment and Planning A: Economy and Space,
34(8), 1443–1458. doi: 10.1068/a3496
Jensen, J. R. and Cowen, D. C. (1999). Remote sensing of
urban/suburban infrastructure and socioeconomic
attributes. Photogrammetric Engineering and Remote
Sensing, 65, 611–622.
Maa-amet. (n.d.). Avaleht. Retrieved from https://geo
portaal.maaamet.ee/eng/Spatial-Data/Administrative-
and-Settlement-Division-p312.html
Michishita, R., Jiang, Z., & Xu, B. (2012). Monitoring two
decades of urbanization in the Poyang Lake area, China
through spectral unmixing. Remote Sensing of
Environment, 117, 3–18. doi: 10.1016/j.rse.2011.
06.021
Patlolla, D. R., Bright, E. A., Weaver, J. E., & Cheriyadat,
A. M. (2012). Accelerating satellite image based large-
scale settlement detection with GPU. Proceedings of
the 1st ACM SIGSPATIAL International Workshop on
Analytics for Big Geospatial Data - BigSpatial 12. doi:
10.1145/2447481.2447487
Pesaresi, M., & Ehrlich, D. (2009). A Methodology to
Quantify Built- Up Structures from Optical VHR
Imagery. Global Mapping of Human Settlement Remote
Sensing Applications Series. doi: 10.1201/9781420
083408-c3
Pesaresi, M., Ehrlich, D., Ferri, S., Florczyk, A., Carneiro
Freire Sergio, M., Halkia, S., Julea, A., Kemper, T.,
Soille, P., and Syrris, V. (2016a). Operating procedure
for the production of the Global Human Settlement
Layer from Landsat data of the epochs 1975, 1990,
2000, and 2014 (Publications Office of the European
Union).
Pesaresi, Martino, Ehrlich, Daniele, Ferri, Stefano,
Florczyk, Aneta, Freire, Sergio, Haag, F. Halkia,
Matina, Julea, Andreea, Kemper, Thomas, Soille,
P.,(2015). Global Human Settlement Analysis for
Disaster Risk Reduction, ISPRS - International
Archives of the Photogrammetry, Remote Sensing and
Spatial Information Sciences, doi:10.5194/isprsarchi
ves-XL-7-W3-837-2015
Pesaresi, M., Huadong, G., Blaes, X., Ehrlich, D., Ferri, S.,
Gueguen, L., … Zanchetta, L. (2013). A Global Human
Settlement Layer From Optical HR/VHR RS Data:
Concept and First Results. IEEE Journal of Selected
Topics in Applied Earth Observations and Remote
Sensing, 6(5), 2102–2131. doi: 10.1109/jstars.2013.
2271445
Sabo, F., Corbane, C., Florczyk, A. J., Ferri, S., Pesaresi,
M., & Kemper, T. (2018). Comparison of built‐up area
maps produced within the global human settlement
framework. Transactions in GIS, 22(6), 1406–1436.
doi: 10.1111/tgis.12480
Vijayaraj, V., Bright, E. A., & Bhaduri, B. L. (2007). High
resolution urban feature extraction for global
population mapping using high performance
computing. 2007 IEEE International Geoscience and
Remote Sensing Symposium. doi: 10.1109/igarss.2007.
4422784.
GISTAM 2020 - 6th International Conference on Geographical Information Systems Theory, Applications and Management
150
