
Prediction of the Impact of Physical Exercise on Knee Osteoarthritis
Patients using Kinematic Signal Analysis and Decision Trees
M. Mezghani
1,2
, N. Hagemeister
2
, M. Kouki
1
, Y. Ouakrim
2,4
, A. Fuentes
3
and N. Mezghani
2,4
1
´
Ecole Sup
´
erieure de la Statistique et de l’Analyse de l’Information, Universit
´
e de Carthage, Tunisia
2
Laboratoire de Recherche en Imagerie et Orthop
´
edie (LIO), Centre de Recherche du CHUM, Montreal, Canada
3
EMOVI Inc, Quebec, Canada
4
LICEF Reserach Center, TELUQ University, Montreal, Canada
Keywords:
3D Kinematics, Decision Trees, Knee Osteoarthritis, Physical Exercise, Knee Kinesiography.
Abstract:
The evaluation of knee biomechanics provides valuable clinical information. This can be done by means of a
knee kinesiography exam which measures the three-dimensional rotation angles during walking, thus provid-
ing objective knowledge about knee function (3D kinematics). 3D kinematic data is quantifiable information
that provides opportunities to develop automatic and objective methods for personalized computer-aided treat-
ment systems. The purpose of this study is to explore a decision tree based method for predicting the impact of
physical exercise on a knee osteoarthritis population. The prediction is based on 3D kinematic data i.e., flex-
ion/extension, abduction/adduction and internal/external rotation of the knee. Experiments were conducted on
a dataset of 309 patients who have engaged in physical exercise for 6 months and have been grouped into two
classes, Improved state (I) and not-Improved state (nI) based on their state before (t
0
) and after the exercise
(t
6
). The method developed was able to predict I and nI patien with knee osteoarthritis using 3D kinematic
data with an accuracy of 82%. Results show the effectiveness of 3D kinematic signal analysis and the decision
tree technique for predicting the impact of physical exercise based on patient knee osteoarthritis pain level.
1 INTRODUCTION
The knee is a joint of great anatomical and biome-
chanical complexity, and is the basis for the mobility
and stability of the human body. This joint under-
goes various static and dynamic stresses that make
it subject to several degenerative diseases, including
knee osteoarthritis (OA). The World Health Organi-
zation estimates that 10% of the adult population in
developed countries suffers from osteoarthritis, 6.1%
of which affects the knee (Woolf and Pfleger, 2003).
In Canada, hundreds of thousands of people suffer
from osteoarthritis of the knee, which affects their
functional abilities and undermines their quality of
life. The prevalence of osteoarthritis is increasing as
the population ages. Indeed, professionals estimate
that it will have doubled by the year 2020 (Creamer
and Hochberg, 1997). Knee osteoarthritis is also one
of the most important chronic diseases in terms of
the use of health services (Health Council of Canada,
2007).
Although there are protocol and practice guide-
lines for better management of osteoarthritis, several
studies show that the treatment of this pathology is
far from optimal and that significant deficiencies ex-
ist both for the diagnosis and for the therapeutic man-
agement of knee osteoarthritis.The diagnosis of os-
teoarthritis can be made either by a family doctor
(general practitioner) or by an orthopedic surgeon af-
ter a musculoskeletal evaluation that can be combined
with an imaging examination (X-ray). However, be-
cause radiological examinations are performed in a
static state, they collect data on the integrity of knee
structures but do not describe the functional aspects
of the knee. While such examinations allow us to de-
termine the impact of an injury on knee function, they
are not sensitive enough to allow clinicians to make an
informed choice about the treatment to be prescribed,
particularly when it comes to prescribing physical ex-
ercise. Properly formulated exercises are very im-
portant because they aim to delay the progression of
the disease while improving symptoms and joint func-
tion. In addition, exercise is among the non-surgical
treatments that have the most scientific evidence to
support their effectiveness (Fransen et al., 2015). De-
spite this, no studies have investigated the effect of
Mezghani, M., Hagemeister, N., Kouki, M., Ouakrim, Y., Fuentes, A. and Mezghani, N.
Prediction of the Impact of Physical Exercise on Knee Osteoarthritis Patients using Kinematic Signal Analysis and Decision Trees.
DOI: 10.5220/0009191401150120
In Proceedings of the 13th International Joint Conference on Biomedical Engineering Systems and Technologies (BIOSTEC 2020) - Volume 4: BIOSIGNALS, pages 115-120
ISBN: 978-989-758-398-8; ISSN: 2184-4305
Copyright
c
2022 by SCITEPRESS – Science and Technology Publications, Lda. All rights reserved
115

exercises to predict their impact on the osteoarthritis
and thus examine whether they could improve state of
the knee.
In this context, functional evaluation of the knee
provides valuable clinical information. It can be
done by means of a knee kinesiography exam which
measures the three-dimensional rotation angles (3D
kinematics) of the knee during walking, thus mak-
ing it possible to identify mechanical biomarkers di-
rectly related to the progression of the disease and
the patient’s symptoms. This type of evaluation can
easily be performed in a clinical setting using the
KneeKG
T M
system (EMOVI Inc, Montreal, Canada).
Figure 1: Knee kinematic acquisition system.
Several studies have demonstrated the accuracy,
validity and reproducibility of 3D knee movements
measured by this technology (Lustig et al., 2011). For
the first time, then, the use of this system allows to
assess a valid and accurate functional evaluation of
the knee in a clinical setting. This evaluation is non-
invasive and reliable allows the biomechanical func-
tion of the knee to be evaluated and analyzed in 3D,
in real time, in motion and under load. 3D kine-
matic data, which is quantifiable information about
knee function, provides an opportunity to objectively
study the impact of a physical exercise program on
knee function.
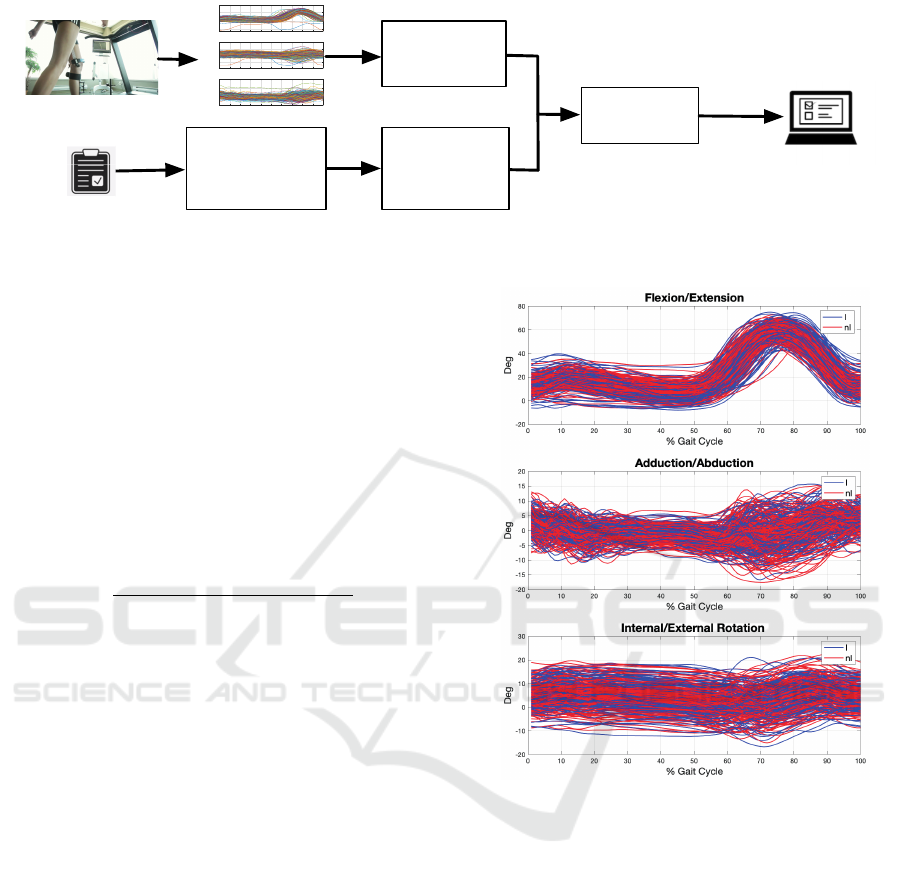
2 METHODOLOGY
To achieve our objective, we adopted the methodol-
ogy described in the block diagram of Figure 2 which
is based on the following main steps. The first step
was to establish a database of knee OA patients who
had completed a 6-month exercise program. The state
of the patient was assessed before starting and after
six months of exercise. This assessment was based
on the Knee Injury and Osteoarthritis Outcome Score
(KOOS) questionnaire, which assesses the patient’s
knee pain (9 items), other symptoms (7 items), func-
tion and daily life (17 items), sport and recreation
(5 items) and knee related quality of life (4 items).
These scores range from 0 to 100 with a score of 0 in-
dicating the worst possible knee symptoms and 100
indicating no symptoms of knee pathology. Based
on the questionnaire responses, the participants were
grouped into two classes: a class of patients whose
condition has been improved (I) and a class whose
condition has not been improved (nI). The second step
was to develop a classification system to predict the
impact of physical exercise, using knee 3D kinematic
data as input. The predicted state is displayed via an
interactive platform in order to better serve clinicians.
2.1 Data-base
A total of 309 participants with knee osteoarthritis
took part in this study. All had completed an exercise
program. Participants are described by their demo-
graphic characteristics (age, gender and Body Mass
Index(BMI)) and one clinical characteristic, the ra-
diographic severity grade of their osteoarthritis mea-
sured by the Kellgren-Lawrence scale (grade 2: mild;
grade 3: moderate; grade 4: severe). These character-
istics were measured at the beginning of the project
(t
0
) and after 6 months (t
6
). All participants also com-
pleted the KOOS questionnaires before (t
0
) and af-
ter the exercise program (t
6
), to assess whether or not
there was an improvement in the patient’s condition
(as described in section 2.2).
Table 1: Demographic characteristics of I (improved) and
nI (not-improved) classes (BMI designates the mean body
mass index).
Class I Class nI
N = 141 N = 168
Age (years) 62.9 ± 9.51 63.66 ± 8.44
BMI (kg / m
2
) 30.2 ± 6.54 29.89 ± 6.0
Proportion of
men / group
36% 40%
2.2 Identification of Patients According
to their Improvement Status
Patient improvement was determined based on the
KOOS. This questionnaire provided us with a global
evaluation of the knee as well as five specific evalua-
tions of particular aspects (pain, symptoms, function
and daily life, sport and leisure and quality of life).
The score values measured before (at time t
0
) and
after the physical exercise (at time t
6
) were used to
deduce whether the patient’s condition had improved
(Class I) or not (Class nI). Indeed, according to the
literature , a condition can be considered improved
BIOSIGNALS 2020 - 13th International Conference on Bio-inspired Systems and Signal Processing
116
Biomechanical
feature
extraction
0 10 20 30 40 50 60 70 80 90 100
-50
0
50
Angle in deg (°)
Flexion/Extension
0 10 20 30 40 50 60 70 80 90 100
-40
-20
0
20
40
Angle in deg (°)
Adduction/Abduction
0 10 20 30 40 50 60 70 80 90 100
Gait Cycle %
-20
0
20
40
Angle in deg (°)
Internal/External rotation
Decision tree
classifier
State
prediction
I / nI
KOOS evaluation
before and after
the physical
exercices
Identification of
the
improvement
state
Figure 2: Block diagram of the methodology adopted.
if the end state assessment exceeds that of the ini-
tial state by a threshold of 10 % (Roos and Lohman-
der, 2003). This threshold can be applied to the six
variables (the five KOOS subscales and the overall
KOOS), which may introduce several sources of vari-
ability in the identification of patients based on their
improvement state. Preliminary research (Bensalma
et al., 2019) suggests that the KOOS
pain
is the most
representative score. In the discussion below, states I
and nI are therefore determined using KOOS
pain
. In
other words, for each patient, the variable η is com-
puted as follows:
η =
KOOS
pain
(t
6
) − KOOS
pain
(t
0
)
KOOS
pain
(t
0
)
and, the assigned state (class) is then:
{
I, if η ≥ 10%
nI, otherwise
(1)
2.3 Kinematic Factor Extraction
Kinematic data describes the joint angles between the
tibia and femur in the three-dimensional space (3D).
These are in the form of 3D curves corresponding
to flexion-extension in the sagittal plane, abduction-
adduction in the frontal plane and internal-external
rotation in the transverse plane. These curves are
normalized to a range from 1% to 100% where 1
corresponds to the beginning and 100 to the end
of the cycle. From these curves, parameters of in-
terest are then extracted to characterize the pattern
of each participant. The parameters in our case,
are 11 kinematic factors extracted from the flexion-
extension, abduction-adduction and internal-external
rotation curves.
2.4 Classification System
In order to predict the patient’s improvement status (I
or nI), we have developed a supervised classification
Figure 3: Kinematic curves of the 309 subjects in the
database (I: improved state and nI: not improved state).
system based on decision trees. The decision trees
were built using the Classification And Regression
Tree (CART) algorithm and allows to reach the end
of each path from the root to a leaf, a description of
one of the classes.
The algorithm for building a binary decision tree
using CART operates node by node, running through
the M attributes (x
1
,x
2
,...,x
M
) one by one, starting
with x
1
and continuing until x
M
. For each attribute,
it explores all possible tests (splits) and chooses the
best split, i.e., the one that maximizes impurity (un-
certainty) reduction. Then, it compares the M best
splits to choose the best one. The function that mea-
sures impurity will necessarily reach its maximum
when the instances are equitably distributed among
the different classes and its minimum when one class
contains all the examples (the node is pure). In order
Prediction of the Impact of Physical Exercise on Knee Osteoarthritis Patients using Kinematic Signal Analysis and Decision Trees
117

to build the nodes of the tree, ”most discriminating”
questions are chosen by the Gini index (Girard, 2007).
This index measures the frequency with which a
random element of the set would be misclassified if
its label were randomly selected based on the distribu-
tion of labels in the sub-set. The index ranges between
0 and 1 and reaches its minimum value (zero) when
all the elements of the set are in the same class of the
target variable. The Gini diversity index used by the
CART algorithm can be calculated by the following
formula: on a node t with a probability distribution of
the classes on this node P( j|t), j = 1, ...,J, we have
(Hawarah, 2008):
G(t) = i(t) = ϕ(p(1/t), p(2/t),..., p(J/t))
= 1 −
∑
j
(P( j|t))
2
where p( j/t) is the proportion of individuals belong-
ing to class j and ϕ is the proportion function to mea-
sure the impurity i(t).
It should be noted that the decision trees were
pruned by the post-pruning method to avoid over-
learning. This approach proceeds as follows: after
completing the decision tree building process, the tree
is pruned. To this end, classification errors are esti-
mated at each node. The subset is replaced by a leaf
(class) or by the most frequent branch. We then start
at the bottom of the tree and examine each of the sub-
trees (non-folio) to see whether replacing the sub-tree
by a leaf or its most frequent branch would result in
to a lower error rate. If so, we trim the sub-tree by
performing the replacement(Hawarah, 2008).
2.5 Evaluation of Classification System
The evaluation of the classification system was car-
ried out by dividing the database into two sub-
databases: a training database and a test database.
This division allows the model to be developed and
tested on different data to verify its relevance. In our
case, we opted for a division allocating 2/3 of the data
for training and the remaining 1/3 for testing. This
gave us 206 participants for the learning process and
103 participants for the validation of the model.
Following training, we considered the classifica-
tion rate as an evaluation criterion. This rate is the
ratio of the total number of well classified data points
to the total number of data points.
Classification rate =
Well classified observations
Total number of observations
The confusion matrix can also be presented for a
better interpretation of the results. This is a matrix
representation that determines the classification error
from a set of test data. The confusion matrix is a
square matrix of size [C ×C] where C is the number of
classes. The columns of this matrix correspond to the
number of occurrences of an estimated class, while
the rows correspond to the number of occurrences of
an actual class. The following table shows an example
of a confusion matrix with two classes. The precision
of the classifier is calculated by formula (2), and the
sensitivity and specificity by formulas (4) and (5), re-
spectively.
Predicted class
Real class C1 C2
C1 True Positive False Negative
C2 False Positive True Negative
True Positive (TP) = C1 group participant correctly
classified.
True Negative (TN) = C2 group participant correctly
classified.
False Positive (FP) = C2 group participant classified
as C1.
False Negative (FN) = C1 group participant classified
as C2.
The mathematical formulas for the evaluation param-
eters of a classifier are as follows:
Accuracy =
T P + T N
Total number o f observations
(2)
Precision =
T P
T P + FP
(3)
Sensitivity =
T P
T P + FN
(4)
Speci f icity =
T N
T N + FP
(5)
To be considered accurate, a classifier must be
both highly sensitive and highly specific.
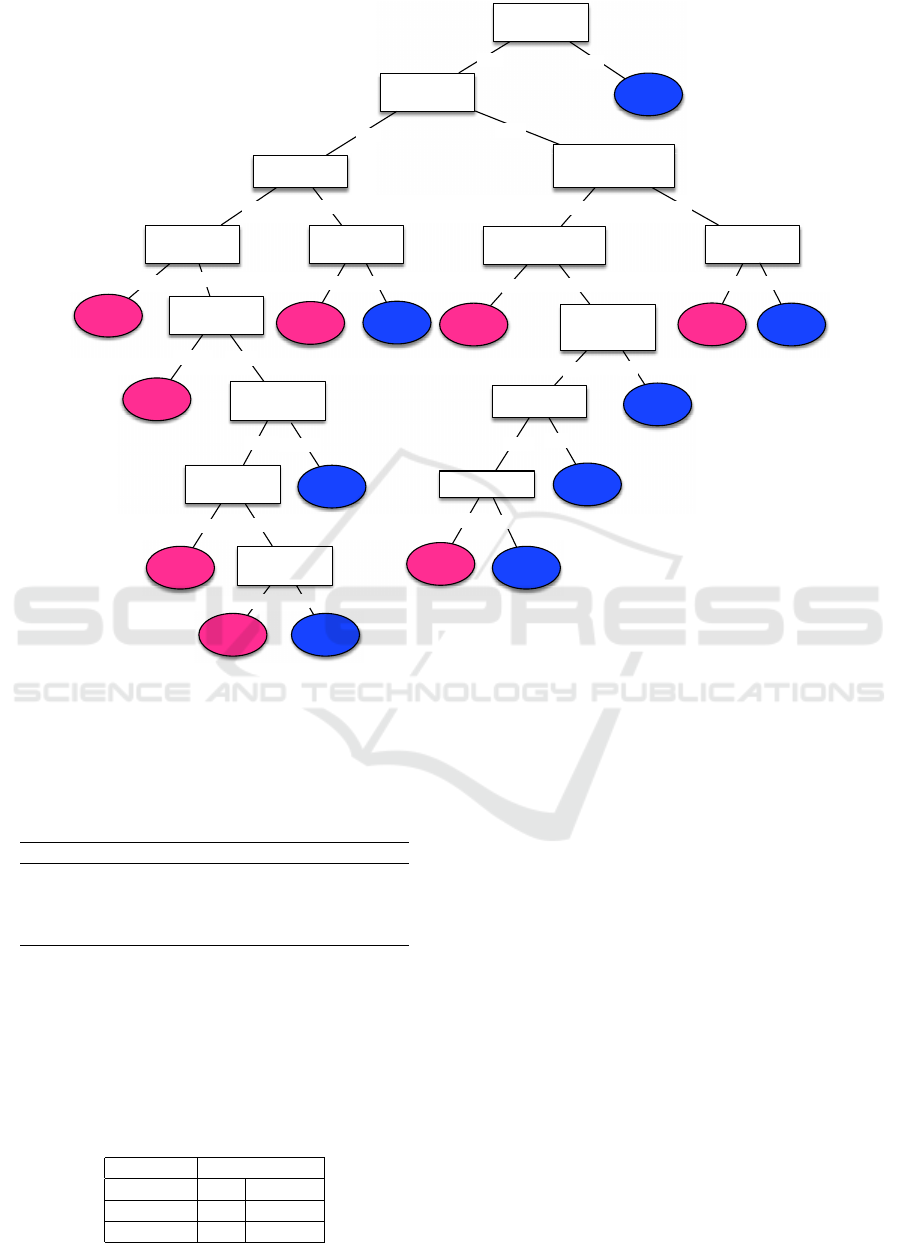
3 RESULTS: CLASSIFICATION
BASED ON DECISION TREES
We developed the classification system using the
CART algorithm and an input vector of 13 variables,
i.e., 9 kinematic factors, 2 demographic variables
(BMI and Age) and the KOOS
pain
score at t
0
. Train-
ing was performed using both the hold out approach
(2/3 of the data for training and 1/3 for testing) and
leave-one out cross validation. Table 2 shows that the
classification rate reaches 82% for leave-one out cross
BIOSIGNALS 2020 - 13th International Conference on Bio-inspired Systems and Signal Processing
118
Koos pain at t0
< 76
Koos pain at t0
nI
48 / 54
< 76
Maximum of flexion
during swing
BMI
Flexion Amplitude
during the stance
nI
27 / 30
I
4 / 5
< 15
>= 15
Maximum of flexion
during swing
Flexion amplitude
at stance phase
nI
7 / 7
Age
nI
34 / 55
BMI
>= 7
< 7
< 67
>= 67
nI
5 / 7
I
16 / 20
>= 25
< 25
>= 54
< 54
>= 55
< 55
< 56
>= 56
I
13 / 16
Flexium initial at
contact
Flexion excursion
at loading
< 37
>= 37
>= 8.1
I
21 / 22
Internal rotation
at loading
< 8.1
nI
14 / 17
I
4 / 4
>= 20
< 20
Internal rotation
at loading
nI
8 / 9
>= -0.52
Varus thrust
at loading
< -0.52
I
6 / 6
< 1.1
Varus thrust
at loading
>= 1.1
nI
5 / 5
I
7 / 10
>= 2
< 2
I
34 / 42
>= 0.25
< 0.25
Figure 4: The KOOS
pain
decision tree.
validation and 75% for hold out approach based on
the 1/3 testing data.
Table 2: Classification rates using the CART algorithm.
Training and testing Classification rate
2/3 of the database for training 75%
and 1/3 for testing
Leave-one-out cross validation 82%
(309 patients)
Figure 4 illustrates the decision tree obtained. Of
the 13 input variables used, 9 were retained by the
CART algorithm. The KOOS
pain
score at t
0
was iden-
tified as the most important variables ranked by impu-
rity.
Table 3: Confusion matrix for the training based on leave-
one-out cross validation.
Predicted class
Real class I nI
I 105 36
nI 20 148
4 CONCLUSION
To our knowledge, this study is the first to explore,
the use of machine learning techniques to predict the
impact (improvement or not) of physical exercise on
the knee in a gonarthrotic population. To this end, we
first developed a large database composed of subjects
who had completed a personalized physical exercise
program, whose condition was measured at the begin-
ning of the project (time t
0
) and after 6 months (time
t
6
). In a second step, we developed a classification
system based on decision trees. This classification
system uses 3D knee kinematic data as input to per-
form an objective, evidence-based decision. The deci-
sion trees achieved a classification rate of 82% based
on KOOS
pain
using a leave-one-out procedure (75%
based on KOOS
pain
on test data only). Unlike many
classification methods, decision trees are intuitive and
provide a graphic, meaningful and easy-to-read repre-
sentation. This advantage has been exploited by im-
plementing a user-friendly graphical interface that al-
lows clinicians to query patient characteristics for a
Prediction of the Impact of Physical Exercise on Knee Osteoarthritis Patients using Kinematic Signal Analysis and Decision Trees
119

better understanding of the classification system’s de-
cision.
ACKNOWLEDGMENTS
This research was supported in part by the Natural
Sciences and Engineering Research Council Grant
(RGPIN-2015-03853) and the Canada Research Chair
on Biomedical Data Mining (950-231214).
REFERENCES
Bensalma, F., Mezghani, N., Ouakrim, Y., Fuentes, A.,
Choiniere, M., Bureau, N., Durand, M., and Hage-
meister, N. (2019). A multivariate relationship be-
tween the kinematic and clinical parameters of knee
osteoarthritis population. Applied Bionics and Biome-
chanics, 2019:14.
Creamer, P. and Hochberg, M. (1997). Osteoarthritis.
Lancet, 350:503–8.
Fransen, M., McConnell, S., Harmer, A., der Esch, M. V.,
Simic, M., and Bennell, K. (2015). Exercise for os-
teoarthritis of the knee: a cochrane systematic review.
British Journal of Sports Medicine.
Girard, A. (2007). Exploration d’un algorithme g
´
en
´
etique
et d’un arbre de d
´
ecision
`
a des fins de categorisa-
tion. Master’s thesis, Universit
´
e du Qu
´
ebec
`
a Trois-
Rivi
`
eres.
Hawarah, L. (2008). Une approche probabiliste pour le
classement d’objets incompletement connus dans un
arbre de d
´
ecision. Master’s thesis, Ecole Doctorale
MSTII.
Lustig, S., Magnussen, R., Cheze, L., and Neyret, P. (2011).
The kneekg system: A review of the literature. Knee
Surgery, Sport. Traumatol. Arthrosc.
Roos, E. M. and Lohmander, L. S. (2003). The knee injury
and osteoarthritis outcome score (koos): from joint in-
jury to osteoarthritis. Health Qual Life Outcomes.
Woolf, A. and Pfleger, B. (2003). Burden of major mus-
culoskeletal conditions. Bulletin of the World Health
Organisation, 81(9):646–56.
BIOSIGNALS 2020 - 13th International Conference on Bio-inspired Systems and Signal Processing
120
