
Noninvasive Portal Pressure Estimation Model using Finite Element
Analysis
P. Senthil Kumar
1
, A. K. Thittai
2
and R. Krishna Kumar
1
1
Department of Engineering Design, Indian Institute of Technology Madras, Chennai, India
2
Department of Applied Mechanics, Indian Institute of Technology Madras, Chennai, India
Keywords: Finite Element Method, Microbubbles, Non-invasive, Portal Pressure, Subharmonic Scattering, Ultrasound.
Abstract: Currently, portal pressure is measured by the standard method known as hepatic venous pressure gradient
(HVPG). But it is an invasive procedure; therefore, an alternative noninvasive technique to estimate portal
pressure is required to monitor portal hypertension. In this work, a 3D portal vein model is developed to study
the acoustic interaction with microbubbles in the portal vein. Ultrasound scattering by ultrasound contrast
agent (UCA) is modelled and analyzed using finite element analysis in order to estimate portal pressure. It
was found from the analysis that the subharmonic component dropped by 1.5 dB as the portal pressure raised
from 0 mmHg to 10 mmHg. Over the same pressure range, the fundamental component reduced by only 0.2
dB. The results suggest that the subharmonic component from the nonlinear response of microbubble is
strongly affected by the ambient pressure, and the proposed model may be used to estimate portal pressure
noninvasively.
1 INTRODUCTION
Portal hypertension (PH) is defined as a condition
when the pressure in the portal vein is greater than 6-
10 mmHg, or the pressure gradient is greater than 5
mmHg between the portal vein and the hepatic vein
or the inferior vena cava (Cokkinos et al., 2009).
Portal pressure is usually measured by the hepatic
venous pressure gradient (HVPG), which is the
difference between wedged and free hepatic vein
pressure (Berzigotti et al., 2018).
The objective of the work reported in this paper
was to develop a methodology to estimate the portal
pressure noninvasively, through the use of Ultrasound
signal. Ultrasound contrast agents (UCA) consists of
gas-filled bubbles (encapsulated by lipids, proteins,
or polymers) with diameters ranging from 0.5 to 10
µm (Sirsi et al., 2009). Microbubble provides a
nonlinear response, when driven by the acoustic
pressure, and generate signals at integer and
fractional multiples (i.e., harmonic components
including subharmonic components) of exciting
frequency (Tremblay-Darveau et al.,2014). The
technique of noninvasively measuring and predicting
changes in scattering from UCA as a function of
ambient pressure was reported four decades ago
(Fairbank et al., 1977). However, the unavailability of
stable microbubble has prevented the practical
exploitation of this understanding (Fairbank et al.,
1977, Hok et al., 1981). The compressibility of
microbubble is different from the compressibility of
blood. A change in size and acoustic characteristics
of the microbubbles results from pressure changes
around it (Adam et al., 2005).
There have been studies to estimate ambient
pressure using microbubble as a pressure sensor.
Techniques based on resonance frequency shift
(Fairbank et al., 1977), and amplitude of single
bubble echos (Hok et al.,1981) and later dual-
frequency excitation technique (Shankar et al., 1986)
have been developed, but the resolution of these
techniques are not clinically useful. A technique to
determine ambient fluid pressure based on the
subharmonic response from UCA called subharmonic
aided pressure estimation (SHAPE) has been reported
(Shi et al.,1999). The reported sensitivity of the
technique based on SHAPE is -6.58 mmHg/dB in
simulation (Andersen et al.,2009), whereas in vitro
studies, it has a range of -13.98 to -4.55 mmHg/dB
(Dave et al., 2011, Halldorsdottir et al., 2011). In vivo
studies had a range of -4.92 to -1.44 mmHg/dB (Dave
et al., 2012, Forsberg et al., 2005). Analytical models
such as the Rayleigh Plesset model and its modified
forms were developed to study the acoustic response
of microbubble in free space (Faez et al., 2012). But
analytical techniques have assumed that the
306
Kumar, P., Thittai, A. and Kumar, R.
Noninvasive Portal Pressure Estimation Model using Finite Element Analysis.
DOI: 10.5220/0009190903060311
In Proceedings of the 13th International Joint Conference on Biomedical Engineering Systems and Technologies (BIOSTEC 2020) - Volume 1: BIODEVICES, pages 306-311
ISBN: 978-989-758-398-8; ISSN: 2184-4305
Copyright
c
2022 by SCITEPRESS – Science and Technology Publications, Lda. All rights reserved

microbubble oscillation is spherical, and has not
considered non-spherical oscillations, bubble-bubble
interaction, and bubble wall interaction.
Portal pressure estimation using the finite element
method has not been carried out till recently (Cai et
al., 2018). Therefore, the objective of this work is to
develop a finite element method to understand the
mechanisms of hydrostatic pressure on subharmonic
oscillations, and to utilize the subharmonic
component to estimate portal pressure noninvasively.
2 MATERIALS AND METHODS
The acoustic wave propagation in the fluid
surrounding the bubble is described by the acoustic
medium, the fluid is assumed to be compressible,
linear, adiabatic and inviscid, and the equation of
motion can be given as (Abaqus Manual, 2014).
1
k
P
γ
ρ
K
P
∂
∂x
1
ρ
∂P
∂x
0
(1)
Where P
'
and P'' are the first and second
derivatives of the pressure with respect to time, x is
the spatial position of the fluid particle, ρ
is the
density of the fluid, γ is the volumetric drag and
K
is the bulk modulus of the fluid.
The surface-based fluid-filled cavity can be
modelled to couple the deformation of the
microbubble shell and the gas pressure. The behavior
of the gas is described by an ideal gas equation
(Abaqus Manual, 2014).
PP
ρ
RTT
(2)
Where P is the gauge pressure, P
is the ambient
pressure, R
is the gas constant, T
is the absolute zero
temperature. The gas constant can be determined as
follows.
R
R
MW
(3)
Where R
is the universal gas constant, and MW
is the molecular weight, the contents of the gas within
the microbubble are considered to be air. The
hyperelastic material model is used to describe the
microbubble shell, and hyperelastic materials are
described by a strain energy potential. Arruda-Boyce
strain energy potential can be written as (Abaqus
Manual, 2014).
Where, U is the strain energy per unit of a
reference volume, μ,
, and D are the material
parameters, I
is the first deviatoric strain invariant,
J
is the elastic volume ratio. The initial shear
Uμ
1
2
I
3
1
20
I
9
11
1050
I
27
19
7000
I
81
519
673750
I
243
1
D
J
1
2
lnJ
(4)
modulus μ
is related to the material parameter μ
with the expression (Abaqus Manual, 2014).
μ
μ1
(5)
The initial bulk modulus K
and material parameter
D is related by an expression (Abaqus Manual, 2014).
K
2
D
(6)
A tie type constraint is applied between the
microbubble shell and the surrounding fluid to ensure
acoustic shell interaction. The coupling between the
shell motion and acoustic pressure can be expressed
by (Abaqus Manual, 2014).
n.u
n.
1
ρ
∂p
∂x
(7)
Where u is the fluid particle acceleration.
Similarly, vessel wall and fluid are coupled by tie
type constraint to ensure coupling of acoustic
pressure between the vessel wall and the fluid.
Fig.1 shows the 3D Geometry of the portal vein
model, where the microbubble is located at the center.
Figure 1: The geometry of the 3-D portal vein model with
microbubble placed at the center.
The vessel length L, was set to be 5 mm, the
diameter of the vessel D was set to 10 mm, the radius
of the microbubble was R
= 3 µm and the thickness
of the vessel wall was set to W= 0.5 mm. These values
Noninvasive Portal Pressure Estimation Model using Finite Element Analysis
307
were taken so as to be consistent with the normal
portal vein dimension.
A plane wave was incident on the vessel boundary
with peak pressure amplitude P
, the local spherical
coordinate system was defined at the center of the
microbubble, and only the radial motion of the
spherical bubble has been considered.
The numerical solution was obtained by the finite
element software ABAQUS
®
(Dassault Systems
SIMULIA, version 6.14). The material parameter
values used in this work are shown in Table.1 and
correspond to those reported in the literature (Bei et
al., 2010, Hoff et al., 2001).
Table 1: Material Parameters.
Medium
Parameters
Values
lood
Density
Bulk Modulus
Speed of sound
1000 kg/m
3
2250 MPa
1500 m/s
Shell
Thickness
Density
Initial Shear
Modulus
Initial Bulk
Modulus
Speed of sound
4 nm
1100 kg/m
3
50 MPa
2816 MPa
1600 m/s
Vessel
wall
Speed of sound
Density
1580 m/s
1100 kg/m
3
Gas
Density
Universal Gas
constant
Molecular Weight
Initial gas pressure
1.225 kg/m
3
8.314510 J mol
-1
K
-1
0.0289
101325 Pa
Figure 2: Mesh of the portal vein model with microbubble
at the center.
The mesh of the portal vein model is shown in Fig.2
The element type “AC3D8R” was used for fluid
and vessel wall, with only acoustic pressure
degree of freedom.
Microbubble's encapsulation discretized by the
element type “S4R”.
The fluid and vessel wall were discretized by
766153 acoustic elements.
The microbubble's encapsulation was discretized
by 60000 shell elements.
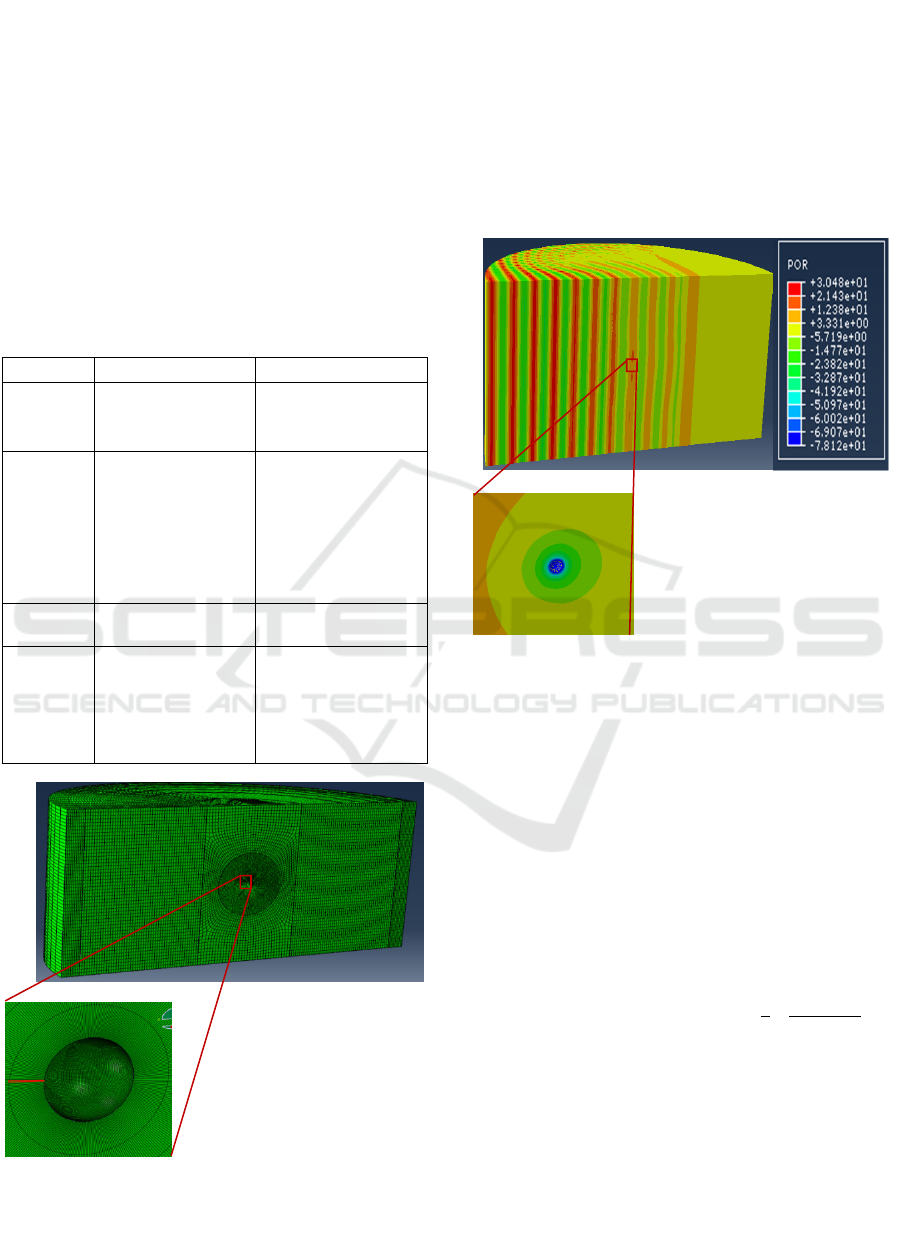
Figure 3: Acoustic pressure profile from portal vein with
microbubble at the center and magnified view of
microbubble response.
3 RESULTS AND DISCUSSION
Fig. 3 shows the response of microbubble in the portal
vein, where the microbubble radius R
of 3 µm, and
the acoustic pressure amplitude P
0,
and transmitting
frequency f, of the continuous wave ultrasound are
0.02 MPa and 2 MHz, respectively.
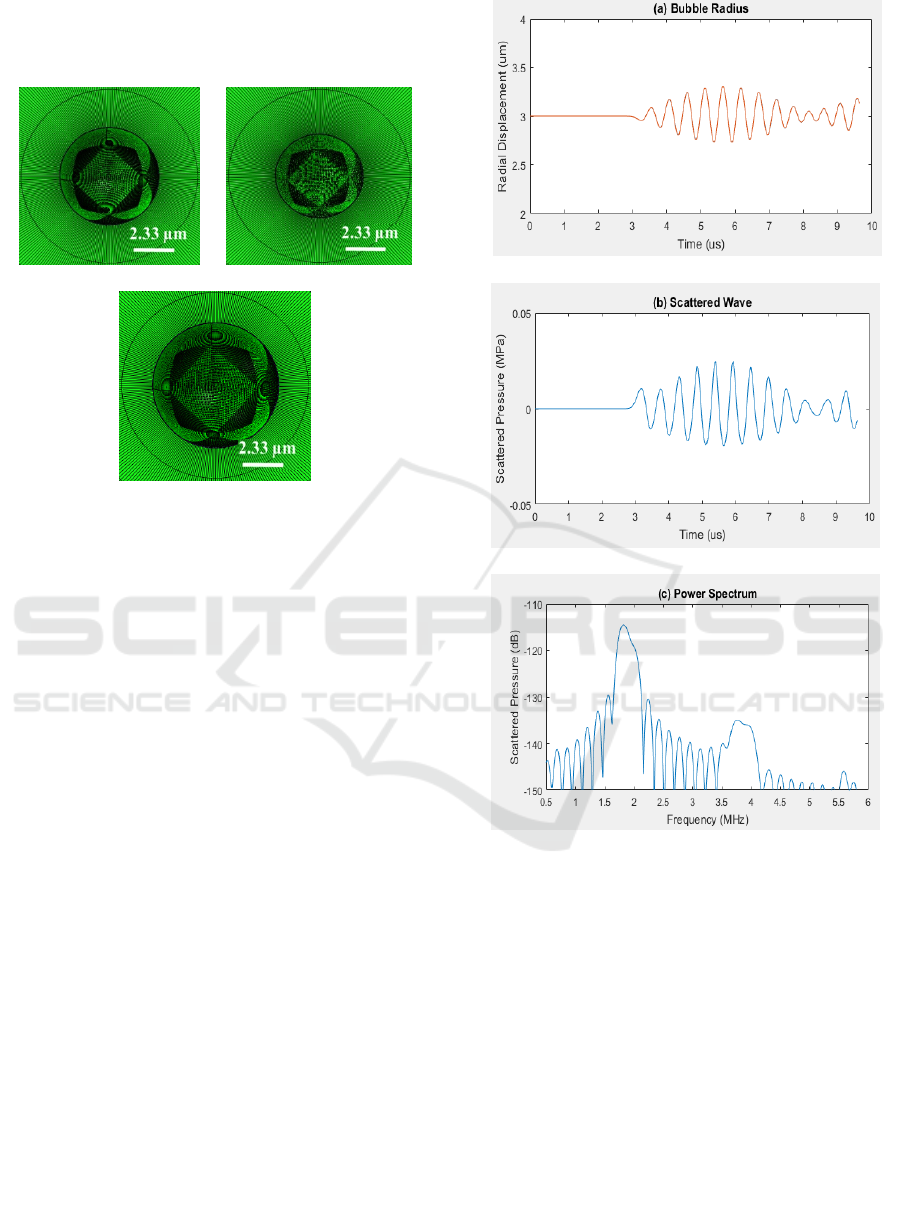
Fig.4 Shows the microbubble expansion and
compression phase when the ultrasound wave
interacts with the microbubble. Ultrasound wave
takes approximately 3.67μs (
=
.∗
/
) to
reach the microbubble surface. It compresses the
microbubble during the positive half cycle and
expands it during the negative half cycle. This can be
noticed in Fig.5a. The volumetric compression and
expansion phase are symmetric with lower acoustic
pressure amplitude. When the applied ultrasound
pressure is less than 0.3 MPa, the subharmonic
amplitude is weak. As a result, the subharmonic
component is absent as shown in Fig 5c. The time and
BIODEVICES 2020 - 13th International Conference on Biomedical Electronics and Devices
308
2
3
frequency resolution of the numerical solutions
plotted in Fig 5 and 6 are 0.04 µs and 0.7 kHz,
respectively.
(a) (b)
(c)
Figure 4: Snapshots of radial oscillations of the
microbubble, (a) initial bubble size at 3 μs, (b) bubble
compression at 3.8333 μs and (c) bubble expansion at 4.125
μs.
Fig. 6 shows the response of microbubble in the
portal vein, where the microbubble radius R
of 3 µm,
and the acoustic pressure amplitude P
0,
and
transmitting frequency f, of the continuous wave
ultrasound are 0.5 MPa and 4 MHz, respectively. The
threshold ultrasound pressure is minimum, if the the
excitaion frequency (2*2 MHz) is twice the resonance
frequency, here the resonance frequency of portal
vein model is around 2 MHz. It can be noticed that
the volumetric compression and expansion phase are
not symmetric.
Damping of radial oscillation and acoustic
response are produced due to the ambient pressure
raise of 10 mmHg. As a result, the ambient pressure
dependent radial oscillations and the acoustic
responses are produced, with an ambient pressure
increase of 0 and 10 mmHg, it can be observed in Fig.
6a and 6b. It has been reported that when the applied
ultrasound pressure in the range 0.3-0.6 MPa, the
subharmonic response is maximum (Shi et al.,1999).
Since the applied ultrasound pressure in our study
was 0.5 MPa, the expected subharmonic component
is developed that can be observed in Fig. 6c.
It is also observed that the subharmonic scattering
is sensitive to the ambient fluid pressure changes, and
decreases with an increase in fluid pressure. Subhar-
Figure 5: Acoustic response of the microbubble placed at
the center of the portal vein, (a) radial oscillation of the
microbubble, (b) scattered wave and (c) Power spectrum of
acoustic response.
monic component reduction linearly with an ambient
fluid pressure raise has been reported (Shi et al.,1999,
Andersen et al., 2009, Andersen et al., 2010). In the
present model, the subharmonic amplitude dropped
by 1.5 dB as the portal pressure is raised from 0
mmHg to 10 mmHg. Over the same pressure range,
the fundamental component reduced only by 0.2 dB.
Further development of the model is required to
include the effects such as, bubble-bubble interaction
and population behaviour, to validate with realistic
experimental conditions.
Noninvasive Portal Pressure Estimation Model using Finite Element Analysis
309
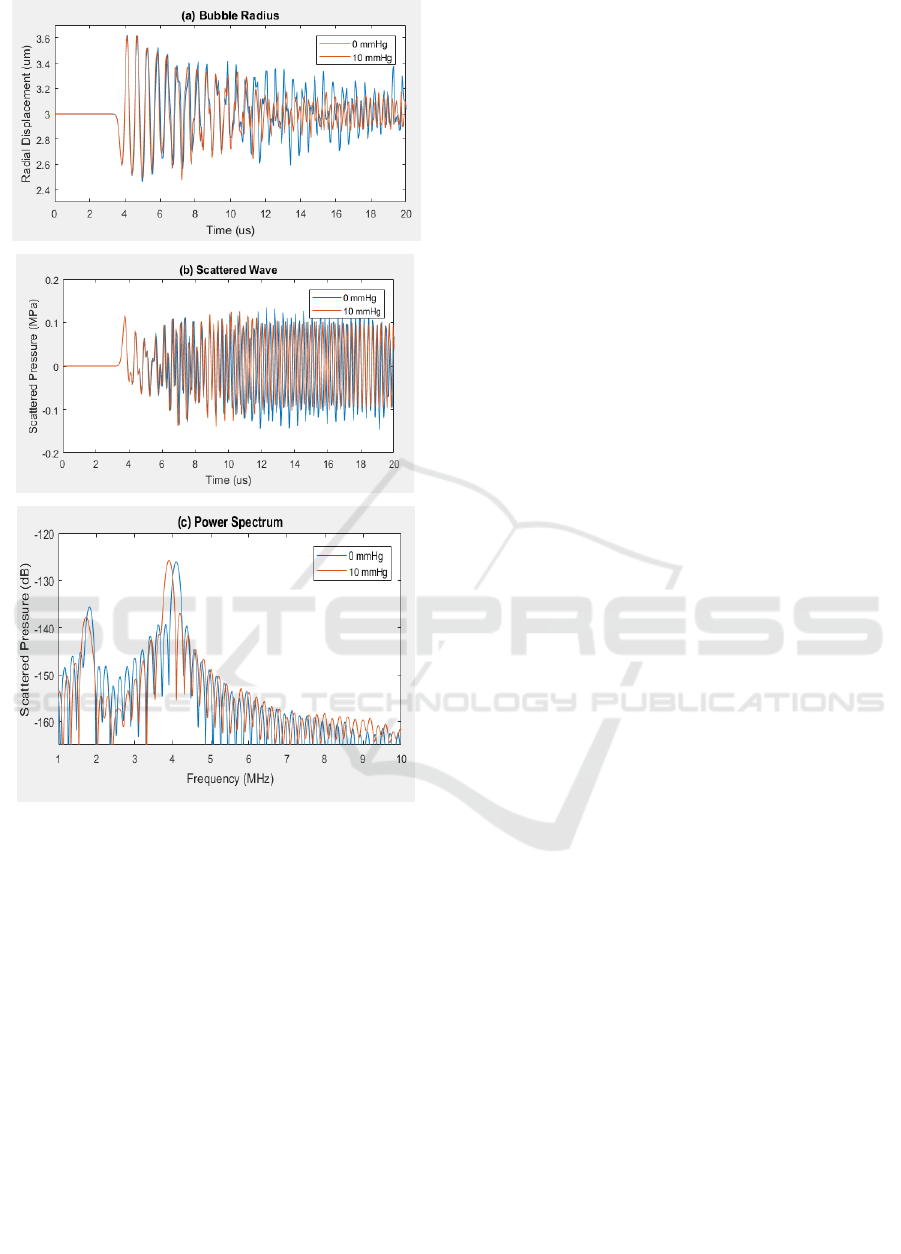
Figure 6: Acoustic response of the portal vein with
microbubble placed at the centre, due to an ambient
pressure raise of 0 mmHg (blue curves) and 10 mmHg
(orange curves), (a) radial oscillation of the microbubble,
(b) scattered wave and (c) Power spectrum of acoustic
response.
4 CONCLUSIONS
The finite element model has been developed that can
allow to study the relationship between the
subharmonic response from microbubble and
ambient pressure, which may be used to estimate the
portal pressure non-invasively. It can be observed
from the results that as the portal pressure is changed,
the change at the subharmonic component is more
compared to that at the fundamental component.
REFERENCES
Adam, D., Sapunar, M., & Burla, E. (2005). On the
relationship between encapsulated ultrasound contrast
agent and pressure. Ultrasound in medicine &
biology, 31(5), 673-686.
Andersen, K. S., & Jensen, J. A. (2009). Ambient pressure
sensitivity of microbubbles investigated through a
parameter study. The Journal of the Acoustical Society
of America, 126(6), 3350-3358.
Andersen, K. S., & Jensen, J. A. (2010). Impact of acoustic
pressure on ambient pressure estimation using
ultrasound contrast agent. Ultrasonics, 50(2), 294-299.
Bei, H., Hai-Rong, Z., & Dong, Z. (2010). Asymmetric
oscillation and acoustic response from an encapsulated
microbubble bound within a small vessel. Chinese
Physics Letters, 27(6), 064302.
Berzigotti, A., & Bosch, J. (2018). Hepatic Venous Pressure
Measurement and Other Diagnostic Hepatic
Hemodynamic Techniques. In Diagnostic Methods for
Cirrhosis and Portal Hypertension (pp. 33-48).
Springer, Cham.
Cai, C. L., Yu, J., Tu, J., Guo, X. S., Huang, P. T., & Zhang,
D. (2018). Interaction between encapsulated
microbubbles: A finite element modelling
study. Chinese Physics B, 27(8), 084302.
Cokkinos, D. D., & Dourakis, S. P. (2009).
Ultrasonographic assessment of cirrhosis and portal
hypertension. Current Medical Imaging Reviews, 5(1),
62-70.
Dave, J. K., Halldorsdottir, V. G., Eisenbrey, J. R., Liu, J.
B., McDonald, M. E., Dickie, K., ... & Forsberg, F.
(2011). Noninvasive estimation of dynamic pressures in
vitro and in vivo using the subharmonic response from
microbubbles. IEEE transactions on ultrasonics,
ferroelectrics, and frequency control, 58(10), 2056-
2066.
Dave, J. K., Halldorsdottir, V. G., Eisenbrey, J. R., Merton,
D. A., Liu, J. B., Zhou, J. H., ... & Lin, F. (2012).
Investigating the efficacy of subharmonic aided
pressure estimation for portal vein pressures and portal
hypertension monitoring. Ultrasound in medicine &
biology, 38(10), 1784-1798.
Dave, J. K., Halldorsdottir, V. G., Eisenbrey, J. R.,
Raichlen, J. S., Liu, J. B., McDonald, M. E., ... &
Forsberg, F. (2012). Subharmonic microbubble
emissions for noninvasively tracking right ventricular
pressures. American Journal of Physiology-Heart and
Circulatory Physiology, 303(1), H126-H132.
Dave, J. K., Halldorsdottir, V. G., Eisenbrey, J. R.,
Raichlen, J. S., Liu, J. B., McDonald, M. E., ... &
Forsberg, F. (2012). Noninvasive LV pressure
estimation using subharmonic emissions from
microbubbles. JACC: Cardiovascular Imaging, 5(1),
87-92.
Faez, T., Emmer, M., Kooiman, K., Versluis, M., van der
Steen, A. F., & de Jong, N. (2012). 20 years of
ultrasound contrast agent modeling. IEEE transactions
on ultrasonics, ferroelectrics, and frequency
control, 60(1), 7-20.
BIODEVICES 2020 - 13th International Conference on Biomedical Electronics and Devices
310

Fairbank, W. M., & Scully, M. O. (1977). A new
noninvasive technique for cardiac pressure
measurement: resonant scattering of ultrasound from
bubbles. IEEE Transactions on Biomedical
Engineering, (2), 107-110.
Forsberg, F., Liu, J. B., Shi, W. T., Furuse, J., Shimizu, M.,
& Goldberg, B. B. (2005). In vivo pressure estimation
using subharmonic contrast microbubble signals: Proof
of concept. IEEE transactions on ultrasonics,
ferroelectrics, and frequency control, 52(4), 581-583.
Halldorsdottir, V. G., Dave, J. K., Leodore, L. M.,
Eisenbrey, J. R., Park, S., Hall, A. L., ... & Forsberg, F.
(2011). Subharmonic contrast microbubble signals for
noninvasive pressure estimation under static and
dynamic flow conditions. Ultrasonic imaging, 33(3),
153-164.
Hoff, L. (2001). Acoustic characterization of contrast
agents for medical ultrasound imaging. Springer
Science & Business Media.
Hök, B. (1981). A new approach to noninvasive
manometry: Interaction between ultrasound and
bubbles. Medical and Biological Engineering and
Computing, 19(1), 35-39.
Manual, A. U. (2014). Abaqus Theory Guide. Version
6.14. USA.: Dassault Systemes Simulia Corp.
Shankar, P. M., Chapelon, J. Y., & Newhouse, V. L. (1986).
Fluid pressure measurement using bubbles insonified
by two frequencies. Ultrasonics, 24(6), 333-336.
Shi, W., Forsberg, F., Raichlen, J., Needleman, L., &
Goldberg, B. (1999). Pressure dependence of
subharmonic signals from contrast
microbubbles. Ultrasound in medicine &
biology, 25(2), 275-283.
Sirsi, S. R., & Borden, M. A. (2009). Microbubble
compositions, properties and biomedical
applications. Bubble Science, Engineering &
Technology, 1(1-2), 3-17.
Tremblay-Darveau, C., Williams, R., & Burns, P. N.
(2014). Measuring absolute blood pressure using
microbubbles. Ultrasound in medicine &
biology, 40(4), 775-787.
Noninvasive Portal Pressure Estimation Model using Finite Element Analysis
311
