
Design of a Percutaneous Left Ventricular Assist Device
Shivam Gupta
1
, K. R. Balakrishnan
2
and R. Krishna Kumar
1
1
Department of Engineering Design, Indian Institute of Technology Madras, Chennai, India
2
MGM Hospitals, Chennai, India
Keywords: Percutaneous Left Ventricular Assist Device (PVAD), Computational Fluid Dynamics (CFD), Systemic Mock
Circulation Loop (SMCL), Particle Image Velocimetry (PIV).
Abstract: Percutaneous Left Ventricular Assist Device is used for short (1-2 weeks) of cardiac support and have
strenuous design methodology as compared to conventional Left Ventricular Assist Device (LVAD). The aim
of this study is (i) to design a micro-axial blood pump (ii) valídate the design using Computational Fluid
Dynamics (CFD) and Systemic Mock Circulation Loop (SMCL), and (iii) flow visualization using Particle
Image Velocimetry (PIV). The diameter of the impeller is 7.6 mm and length is 15 mm. One of the most
important aspect of the design was the elimination of the bearing. The optimum parameters ascertained
includes a wrap angle of 250
0
,
blade thickness of 0.5 mm and shroud clearance of 0.25 mm. The straightener
and diffusor were eliminated to reduce the net surface area exposed to blood. The pump characteristics were
obtained using a Systemic Mock Circulation Loop (SMCL), developed in-house. The dynamic response was
recorded by varying arterial compliance from 0.5 mL/mm Hg to 2 mL/mm Hg in SMCL. The design showed
a consistent pump characteristics over a range of arterial compliance and an optimum flow rate of 2.5L/min
at 60mm Hg, whereas the maximum flow rate of 2.8L/min at 80 mm Hg. The flow characteristics obtained
using PIV were in good agreement with the CFD results.
1 INTRODUCTION
Every year 17.9 million deaths are reported
worldwide from Cardiovascular Disease (CVD),
which is 31% of all deaths worldwide (Benjamin et
al., 2019). The number of Heart Transplants
performed worldwide in 2018 is approximately 3500
(Cook et al., 2015). Percutaneous Left Ventricular
Assist Device (henceforth called PVAD) is used to
support a failing heart. Unlike conventional Left
Ventricular Assist Device (LVAD), the PVAD, is
transplanted and used for a duration of only 6 to 14
days allowing the heart to recover (Casassus et al.,
2015). Currently available PVAD’s includes,
Impella (2.5/CP/5.0) by Abiomed Corporations and
HeartMate PHP by Thoratec Corporation. The
Impella 2.5 (size 12 Fr) delivers a maximum flow
rate of 2.5 L/min at 50,000 rpm whereas Impella 5.0
(size 21 Fr) delivers maximum flow rate of 5L/min
at 33,000 rpm (Lima et al., 2016). The HeartMate
PHP (size 21 Fr) delivers a maximum flow rate of
5L/min at 21,000 rpm (Van et al., 2016).
Three criteria are generally used for the design of
the PVAD. They are: a) Flow rate and pressure head,
which in this case is 2.5 L/min at 60 mm Hg b)
reduction of the exposure time of the blood in the
high shear regions, c) reduction of high shear region.
PVAD design is an iterative process where authors
have used conventional pump design theories to
develop the initial design (Gregory et al., 2017),
(Song et al., 2004) and (Yu H., 2015). Nevertheless
these theories and calculations requires
modifications to design PVAD, especially at various
regions between hub and shroud, wrap angle of
blades, shroud clearance, and changes in pump
parameters when the diffusor is not used. The wrap
angle, which governs the exposure time, clearance
gap which governs the wall shear stress, and changes
in design parameters to avoid high shear zones by
eliminating the diffusor, are critical aspects to be
considered while designing the PVAD.
The development of PVAD requires in vitro
performance test to analyse flow rates, pressure
variations, dynamic response with respect to
conditions like preload and after-load. Identifying
these parameters helps to validate the PVAD’s initial
design. Mock circulation loops (MCL) have been
developed for a simple non-pulsatile prototypes as
well as for a more complex pulsatile prototypes
(Gregory et al., 2009). Though mock circulation loop
298
Gupta, S., Balakrishnan, K. and Kumar, R.
Design of a Percutaneous Left Ventr icular Assist Device.
DOI: 10.5220/0009190702980305
In Proceedings of the 13th International Joint Conference on Biomedical Engineering Systems and Technologies (BIOSTEC 2020) - Volume 1: BIODEVICES, pages 298-305
ISBN: 978-989-758-398-8; ISSN: 2184-4305
Copyright
c
2022 by SCITEPRESS – Science and Technology Publications, Lda. All rights reserved

represents the human arterial system, consisting of
both pulmonary and systemic circulations, in this
work only systemic circuit has been used to validate
the PVAD (Vilchez et al., 2016). Gregory et al. has
developed a Mock Circulation Loop (MCL) which
has been widely used as a benchmark design, which
includes peripheral resistance, compliance,
inertance, systemic and pulmonary circuits, VAD
connections and adjustable cardiac connections
(Gregory et al., 2011). Pantalos et al. used MCL to
mimic the Frank-Starling response under normal
heart, diseased heart, and cardiac recovery conditions
(Pantalos et. al., 2004). Timms et al. developed a
MCL which represents pulsatile left and right
ventricles (Timms et al., 2005)
In order to visualize the flow field in the pump
region, for miniaturized rotary centrifugal (Day et al.,
2004) and axial blood pumps (Apel et al., 2001),
particle image velocimetry (PIV) has been widely
used. Flow visualization can either be done using a
single camera (in two dimensions), or using two
cameras for a three dimensional visualization. Due to
the small size of the percutaneous pumps, a region to
provide an optical access has always been a
challenge. Moreover the velocity gradients
resolution in the clearance space between tip and the
shroud requires a high resolution CCD camera,
which is not covered in this study.
2 MATERIALS AND METHODS
2.1 Pump Design Theory
PVADs are micro axial pumps of less than 8 mm and
their speed is inversely proportional to their size. Red
blood cells which are 10 microns in size are the most
affected part of the blood due to the high rotational
speed of these pumps (Lund et al., 2016). Another
major design parameter which affects the shear stress
on RBCs is the clearance gap between the shroud and
the impeller tip (Yu H., 2015). Moreover regions of
vortices and stagnation in the pump can cause
hemolysis and thrombosis (Gregory et al., 2017).
Considering these major criteria, design of the PVAD
is a cumbersome process compared to a conventional
axial flow pump. The impeller geometry includes
impeller hub and shroud diameter, inlet and outlet
blade angles, wrap angle, clearance gap and blade
profiles. The Design condition imposed for current
PVAD is 2.5 L/min at a pressure head of 60 mm Hg.
Cordier Diagram being the most common starting
point for the selection of any pump in the
conventional design theory was used, after which
Table 1: Initial design parameters.
Location Hub T1 T2
T3 Shroud
24.3
0
22.8
0
21.4
0
20.2
0
19.1
0
36.2
0
32.1
0
28.9
0
26.3
0
24.1
0
Calculated parameters: De Haller Ratio (HR)= 0.75,
Hub diameter (d)= 6 mm, Chord length (c)= 8 mm.
Assumed parameters : Number of blades (Z), Wrap
angle (), Clearance gap (c), Blade thickness (t).
velocity triangles were used to calculate the blade
angles at various locations of hub, shroud and points
between them (Song et al., 2004), Since there lies
infinite points between the hub and the shroud, we
have selected a total three points at a span (T) of 0.25,
0.5, 0.75, thus making it a total five points to calculate
the inlet and the outlet blade angles.
=
. @
. @
(1)
= { − }
(2)
The de Haller ratio (HR) and angle of deflection ()
provides an insight on the loading of the blades. A
smaller de Haller ratio results in more blade loading.
Normally, the de Haller ratio should be larger than 0.7
to avoid stalling of flow, where flow separation
occurs on the suction side of the blade (Gregory et al.,
2017). On the other hand, angle of deflection is
directly proportional to the work done by the
impeller. Table 1 shows the initial design parameters
calculated from the conventional designed
methodology. These design calculations does not
give number of blades, wrap angle, clearance gap,
blade thickness and the effect of variable hub
diameter on the flow characteristics of impeller. So
these initial design parameters were assumed as listed
in Table 1 which is later optimized with an iterative
design process using CFD results. The impeller of
PVAD was modelled using BladeGen (ANSYS®
Academic Research Mechanical, Release 18.1), the
blade profile at the leading edge and trailing edge was
estimated as an ellipse for smooth entry and exit.
2.2 CFD Study
Computational Fluid Dynamics study has proven to
be an efficient method to get good insights of impeller
designs and also for initial validation of the design
(Song et al., 2004).
The study used Ansys TurboGrid
for meshing and Ansys CFX for solving the RANS
Design of a Percutaneous Left Ventricular Assist Device
299

Table 2: Study for optimum wrap angle.
Wrap
angle ()
Head (m) Power (W) O= H/P (m/W)
90
0
0.95 m 0.83 W 1.140 m/W
150
0
0.79 m 0.76 W 1.048 m/W
250
0
0.73 m 0.64 W 1.137 m/W
360
0
0.41 m 0.39 W 1.050 m/W
equations, which are commercial available software.
(ANSYS Inc., Canonsburg, PA, USA). TurboGrid is
an interactive hexahedral grid generation system,
specifically designed for turbo machinery. It is
preprogrammed with several templates tailored to the
complex curvatures of various types of turbines,
compressors and pumps. BladeGen files were
imported to TurboGrid, which generates the flow
domain for the impeller geometry. Tip clearance at
shroud was directly given in TurboGrid which was
varied from 0.1-0.25 mm, based on different models
at different iteration steps. The meshing was further
refined at trailing edge by keeping the trailing edge
cut- off factor at 3.
The meshed data of fluid domain was then
transferred to CFX, where the inlet boundary
condition was kept as
mass flow rate and the outlet
was kept open to let the pressure develop over time.
The flow domain was given a counterclockwise
rotation and a no-slip boundary condition was
applied to the walls. Rotational periodicity interface
was used to reduce the computational time.
A frequently used turbulence model in the field
of rotary blood pumps is the Shear Stress Transport
(SST) model, which is regarded as an industry
standard due to good validation results. K-Ɛ turbulent
models used in conventional VAD’s predicts fluid
flow outside the boundary layer, but fails to capture
near field flow regimes (Song et al., 2004) and (Demir
et al., 2011). Since PVAD is micro-axial entity with
high rotational speed, it is important to track the near
boundary phenomenon and hence SST turbulent
model has been used in our study.
Due to the very high rotational speed, N (nearly
12000 to 27000 rpm) and the small dimension of the
pump, the computational time step must be very
small in order to capture flow field adequately. Thus,
time required for 1 revolution (t) is given by
=
60
× 1000
(3)
Table 3: Study for optimum chord length.
Chord length
(mm)
Head (m) Power
(W)
O= H/P
(m/W)
8 mm 0.7336 m 0.645 W 1.137 m/W
12 mm 0.878 m 0.86 W 1.02 m/W
Moreover, if the number of blades is ‘z’ and hence for
a periodic fluid domain, time taken to spin one pitch
(
) is given by
=
(4)
To capture more information about the flow field, we
have further reduced the time step by a factor of 5,
which solely depends on the amount of information
needed and the computational power. So, the final
time step (T
F
) is given by
T
=
T
5
(5)
The total time taken is 0.8 sec. The streamlines are
shown in figure 1a.
2.3 Design Iterations
Based upon initial parameters adopted from
conventional design theory, a CFD model was
generated and an initial analysis was carried out.
Based on the CFD results, the design parameters were
altered, and the process was repeated. Four assumed
variable parameters which were not possible to be
calculated from conventional pump theories, namely
wrap angle (P1), clearance gap (P2), blade thickness
(P3), and the number of blades (P4), were fixed with
this approach. The number of blades is assumed to be
two. More blades were not considered, as the net
blood exposure surface area increases with number of
blades, along with drive power requirements. The
clearance gap is fixed to 0.25 mm due to the limitation
in manufacturing. The blade thickness, should be as
minimum as possible to increase the net flow area
between the blades. As per the current manufacturing
methods, a blade thickness of 0.5 mm has been
chosen, which results in a unit head loss of 0.1 m/W,
but an increase of 7.9 % of flow area was achieved.
Different wrap angles of 90
0
, 180
0
, 250
0
and 360
0
were analysed, as shown in Table 2.
Table 3 shows the effect of chord length for one
of the iterations on the pump characteristics.
BIODEVICES 2020 - 13th International Conference on Biomedical Electronics and Devices
300
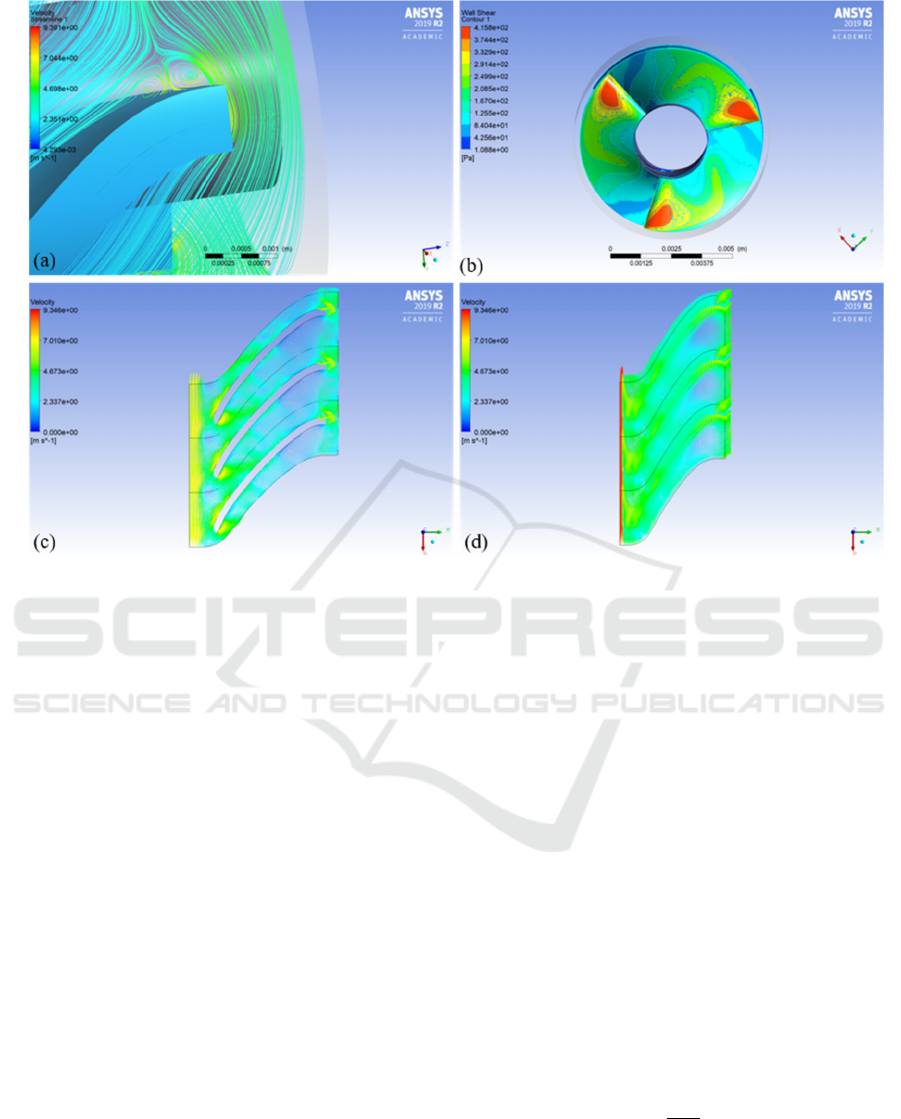
Figure 1: a) Vortices at trailing edge, b) shear stress distribution at leading edge, c) velocity vectors at 50% span, and d)
velocity vectors at 95% span.
Head per unit power obtained from CFD has been
used for comparisons. Maximum pressure rise
increases with blade length. However, blade length
affects the torque required to rotate the PVAD and an
increase in length increases the exposure time of the
RBC’s causing an increase in damage to these cells.
The blade length from the leading edge (LE) to
the trailing edge (TE) is fixed as 12mm to
accommodate motor shaft, which is 7 mm in length.
Figure 2c shows the geometry of the final design.
The configuration does not include flow straightener
or diffusor to reduce exposure time.
2.4 Prototyping and Assembly
The impeller illustrated in figure 2c is manufactured
using additive manufacturing technology of PolyJet
printer (Stratasys Systems, US), which has an
accuracy of 16 microns. VeroClear material is used
for the prototyping. A BLDC motor of 8 mm in
diameter with 7mm shaft length (Faulhaber GmbH,
Germany) was tight fitted with the impeller. The
casing for the pump with 0.25 mm clearance was
initially 3D printed and later on manufactured with
glass for PIV experiment.
3
SYSTEMIC MOCK
CIRCULATION LOOP
A mock circulation loop was designed and
constructed as shown in figure 2b. A two-element
Windkessel model is used to model the MCL
(Catanho et al., 2012). Two compliance chambers to
mimic aortic compliance and venous compliance
were used. Aortic compliance (AoC) of 1.65 mL/mm
Hg and a Venous Compliance (VoC) of 10 mL/mm
Hg have been used (Timms et al., 2005). The
compliance chamber is made of an acrylic cylinder,
filled with air and sealed at the top at a desired
pressure to produce the desired value of compliance.
Table 4 shows the designed MCL parameters. The
compliance is given by
=
(6)
Where
are the volume of air and
pressure of air above water column in the chamber.
From expression (6), it can be seen that the
Design of a Percutaneous Left Ventricular Assist Device
301
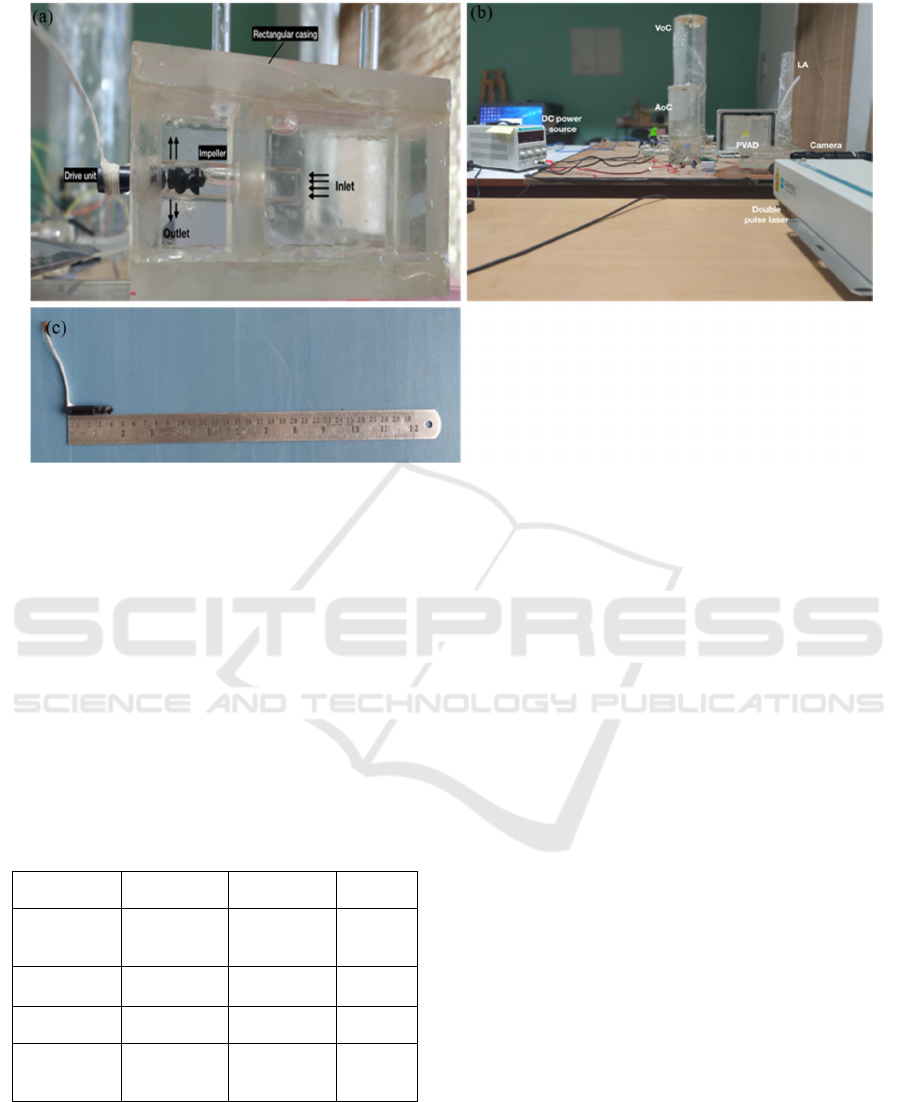
Figure 2: a) Pump Assembly inside rectangular acrylic casing, b) Systemic Mock Circulation Loop. (VoC: Venous
Compliance Chamber) (AoC: Arterial Compliance Chamber) (LA: Left Atrium), and c) Impeller with motor
compliance can be varied either by varying volume of
air or by varying the pressure exerted by air in the
compliance chamber. The resistance of the blood
vessels is modelled as a lumped parameter, adjusted
by a flow control valve. To prevent interference with
the pressure flow rate response of the MCL due to
connecting tubes, the resistance of all the tubes
combined is set at 0.06 mm Hg.s/mL (Gregory et al.,
2017). Clear acrylic tubes of internal diameter of 20
mm were used for the arteries and veins to lower the
frictional losses.
Table 4: Design parameters for systemic mock circulation
loop.
Parameter
AoC VoC LA
Compliance 1.65
mL/mm Hg
10
mL/mm Hg
-
Diameter 100 mm 150 mm 40 mm
Height 250 mm 600 mm 400 mm
Pressure Variable Variable atmosph
eric
An Arduino Uno is used to link the sensors with the
workstation. Two MPX-5100 AP pressure sensors
(NXP Semiconductors, Netherlands), are used, along
with a non-invasive ultrasonic flow sensor -
UF08B100 (Cynergy 3, UK).
4
PARTICLE IMAGE
VELOCIMETRY
Particle Image Velocimetry was used as a flow
visualization methodology. Due to the small size of
the pump, there were several constraints, namely a)
the observational area should be optically accessible,
which was achieved by making a glass casing, b) the
seeding particles should follow the flow field and
should reflect the laser light in sufficient amount to
be captured by the camera, for which hollow glass
particles, coated with silver, of 10 micron diameter
were used. In order to avoid the effect of the
curvature, of pump casing, a rectangular acrylic
casing was made to enclose the pump and was filled
with a mixture of water-glycerol (35% glycerol and
65% water) to match the refractive index. The study
was conducted in two parts, (i) the laser was
illuminated in the vertical plane and the camera was
placed in the front (figure 3a) and (ii) the laser was
illuminated in the horizontal plane and the camera
was placed at the top (figure (3b, 3c and 3d)).
Image acquisition is accomplished with a
commercial available PIV system (Dantec Dynamics,
BIODEVICES 2020 - 13th International Conference on Biomedical Electronics and Devices
302
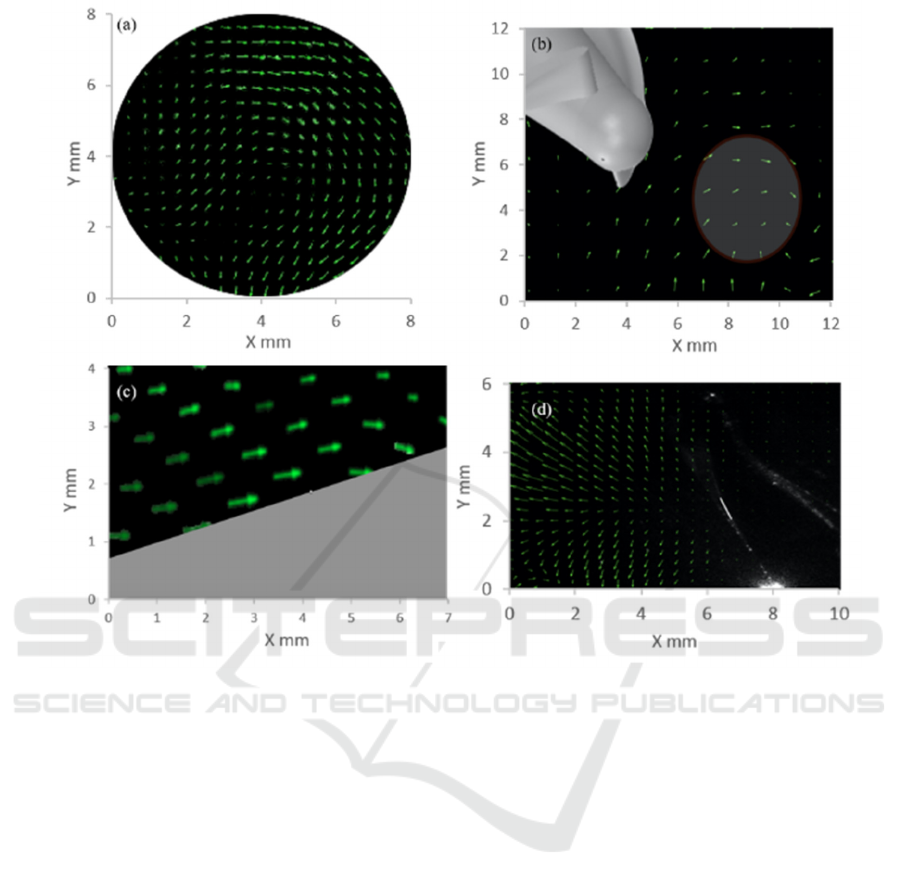
Figure 3: a) Inlet flow regimes, b) flow vortices at Leading edge, c) no vortices or stagnation at middle of the impeller, and
f) bifurcation zone at the outlet.
GmbH, Germany) using a 400 mJ Nd:YAG laser at
532 nm. A CCD camera along with Navitar zoom
6000 lens was used to capture the flow field. Single
frame double-pulse laser mode was used to arrest the
motion of the impeller at high speed. PIVlabs toolbox
in Matlab (The Mathworks, Inc., Natick, MA, USA)
was used to analyse the flow fields (Thielicke et al.,
2014). The impeller was painted black to minimise
the pseudo reflections from impeller surface. Figure
3 explains the flow fields in various regions of the
pump.
5
RESULTS AND DISCUSSIONS
A PVAD with diameter 7.6 mm and impeller length
15 mm has been successfully prototyped to achieve
an optimum flow rate of 2.5 L/min at 60 mm Hg.
There was a trade-off between pressure rise, power
requirement and net blood exposed area when wrap
angle and chord length is varied (Table 2 and Table
3). The increase in wrap angle from 90
0
to 250
0
have
shown an increase in flow rate. The final prototype
has a wrap angle of 250
0
, to achieve 2.5 L/min of flow
rate and chord length of 12 mm, to accommodate 7
mm of shaft length. The reduction in constant hub
diameter of 5.8 mm to variable hub diameter of 3 mm
at the leading edge and 5.8 mm at the trailing edge
has increased the net flow rate at the same pump
speed. Moreover, reducing the blade thickness from 1
mm to 0.5 mm has increased the flow area for the
same size of PVAD. Figure 1a represents regions of
vortices at the trailing edge possibly caused to the
absence of the diffusor. The trailing edge angle of the
impeller can further be modified to eliminate this
recirculation region. Figure 1b shows that the shear
stress distribution at the entry is below 400 Pa, which
is within the acceptable limits (Song et al., 2004) and
(Yu H., 2015). The highest shear stress regions were
at the leading edge of the impeller when the fluid is
expected to make its first contact.
Figure 1c represents the velocity vectors at 50%
Design of a Percutaneous Left Ventricular Assist Device
303

Figure 4: a) CFD results at inlet, b) PIV results at inlet, c) H-Q curve of designed PVAD at various speeds, d) Comparison of
CFD and Experimental HQ curve, and e) Pump performance at different Arterial compliance value.
span, with a maximum velocity of 9.3 m/sec and
figure 1d represents the leakage losses in the pump
due to the clearance gap which are not accounted for
in the conventional pump design theory being used.
Figure 3a and 3b illustrates the flow regime at the
inlet to impeller under front and top view
respectively, and shows recirculation at inlet as
expected, due to the elimination of flow straightener.
Figure 3c shows straight flow fields without any
vortices at the middle section of the impeller. Figure
3d shows a bifurcation region at the outlet of impeller
possibly due to sudden increase in flow area. The
spatial resolution is 16 pixels which corresponds to
approximately 0.125 mm.
Figure 4a illustrates the CFD velocity contour
and vectors for the optimum design and figure 4b
illustrates the experimental PIV contour and vectors.
The maximum velocity is near the shroud and it
decreases towards the centre. The difference between
the CFD and the experimental results is less than
10%.
Figure 4c represents the H-Q curve for various
conditions ranging from 27000 rpm (A1) to 12000
rpm (A6). It can be seen that the designed point is
achieved with A1 condition. The region Q1
represents points at which pressure difference above
60 mm Hg can be achieved. Region Q2 refers to the
extreme working region of the PVAD mainly during
the condition of multiple organ failure. Region Q3
represents the working region under recovering heart
condition and region Q4 refers to high flow rate
conditions under low pressure.
Figure 4d is a comparison between experimental
and CFD results. It can be seen that CFD has
marginally over predicted the PVAD’s performance.
Figure 4e shows the pump performance by varying
the Aortic Compliance, from (2 mL/mm Hg to 0.5
mL/mm Hg). The designed PVAD showed a
consistent performance with less than 6% variation
under diseased heart condition.
The results shown agree with the defined
problem, that is, the PVAD developed is capable to
deliver 2.5 L/min at 60 mm of Hg. These
characteristics very well matches with the state of the
art devices available as of now (Lima et al., 2016)
and (Van et al., 2016). Moreover the size of the
PVAD is within anatomical space constraint. Current
limitation of this PVAD, due to unavailability of low
power high rpm motors, is to deliver higher flow
rates, upto 5 L/min, with same dimensions. The
future work will be focused on a) testing the
prototype with blood to measure Normalised Index
of Hemolysis (NIH), to better interpret the trade-off
between wrap angle and chord length and b) to insert
the motor impeller assembly into a catheter and
check dynamic response of PVAD with blood in
SMCL.
BIODEVICES 2020 - 13th International Conference on Biomedical Electronics and Devices
304

6 CONCLUSION
In this study a Percutaneous Left Ventricular Assist
Device (PVAD) is designed and validated via
Systemic Mock Circulation Loop (SMCL), and
Computational Fluid Dynamics (CFD). The flow
field was visualized using Particle Image
Velocimetry (PIV). The iterative design procedure
successfully eliminates the variables one by one to
reach an optimum design parameter using
conventional pump theory. SMCL and PIV turns out
to be insightful in an early stage development of
PVAD to predict pump performance under varied
arterial compliance and visualizing regions of
vortices at various regions of the impeller. The PVAD
showed consistent performance under diseased heart
condition with a reduced arterial compliance.
REFERENCES
Benjamin, E. J., Muntner, P., & Bittencourt, M. S. (2019).
Heart disease and stroke statistics-2019 update: a report
From American Heart Association. Circulation,
139(10), doi:10.1161/CIR.0000000000000659.
Cook, J. A., Shah, K. B., Quader, M. A., Cooke, R. H.,
Kasirajan, V., Rao, K. K., & Tang, D. G. (2015). The
total artificial heart. Journal of thoracic disease, 7(12),
2172.
Casassus, F., Corre, J., Leroux, L., Chevalereau, P.,
Fresselinat, A., Seguy, B., & Barandon, L. (2015). The
use of Impella 2.5 in severe refractory cardiogenic
shock complicating an acute myocardial
infarction. Journal of interventional cardiology, 28(1),
41-50.
Lima, B., Kale, P., Gonzalez-Stawinski, G. V., Kuiper, J.
J., Carey, S., & Hall, S. A. (2016). Effectiveness and
safety of the Impella 5.0 as a bridge to cardiac
transplantation or durable left ventricular assist
device. The American journal of cardiology, 117(10),
1622-1628.
Van Mieghem, N. M., Daemen, J., Den Uil, C., Dur, O.,
Joziasse, L., Maugenest, A., & van Geuns, R. J.
(2016). Design and Principle of Operation -HeartMate
PHPTM(Percutaneous (Vol. 74, p. 9). EIJ-‐ D-‐ 15-‐
00467.
Gregory, S., Stevens, M., & Fraser, J. F. (Eds.).
(2017). Mechanical Circulatory and Respiratory
Support. Academic Press.
Song, X., Untaroiu, A., Wood, H. G., Allaire, P. E.,
Throckmorton, A. L., Day, S. W., & Olsen, D. B.
(2004). Design and transient computational fluid
dynamics study of a continuous axial flow ventricular
assist device. ASAIO journal, 50(3), 215-224.
Yu, H. (2015). Flow design optimization of blood pumps
considering hemolysis (Doctoral dissertation, Otto von
Guericke Universität Magdeburg).
Gregory, S. D. (2009). Simulation and development of a
mock circulation loop with variable
compliance (Doctoral dissertation, Queensland
University of Technology).
Vilchez-Monge, M., Truque-Barrantes, A., & Ortiz-Leon,
G. (2016, November). Design and construction of a
hydro-pneumatic mock circulation loop that emulates
the systemic circuit of the circulatory system. In 2016
IEEE 36th Central American and Panama Convention
(CONCAPAN XXXVI) (pp. 1-6). IEEE.
Gregory, S. D., Stevens, M., Timms, D., & Pearcy, M.
(2011, January). Replication of the Frank-Starling
response in a mock circulation loop. In 2011 Annual
International Conference of the IEEE Engineering in
Medicine and Biology Society (pp. 6825-6828). IEEE.
Pantalos, G. M., Koenig, S. C., Gillars, K. J., Giridharan,
G. A., & Ewert, D. L. (2004). Characterization of an
adult mock circulation for testing cardiac support
devices. ASAIO journal, 50(1), 37-46.
Timms, D., Hayne, M., McNeil, K., & Galbraith, A. (2005).
A complete mock circulation loop for the evaluation of
left, right, and biventricular assist devices. Artificial
organs, 29(7), 564-572.
Day, S. W., & McDaniel, J. C. (2004). PIV measurements
of flow in a centrifugal blood pump: steady flow.
Apel, J., Neudel, F., & Reul, H. (2001). Computational fluid
dynamics and experimental validation of a microaxial
blood pump. ASAIO journal, 47(5), 552-558.
Lund, L. H., Edwards, L. B., Dipchand, A. I., Goldfarb, S.,
Kucheryavaya, A. Y., Levvey, B. J., & Stehlik, J.
(2016). The registry of the International Society for
Heart and Lung Transplantation: thirty-third adult heart
transplantation report—2016; focus theme: primary
diagnostic indications for transplant. The Journal of
Heart and Lung Transplantation, 35(10), 1158-1169.
Demir, O., Biyikli, E., Lazoglu, I., & Kucukaksu, S.
(2011). Design of a centrifugal blood pump: Heart
Turcica Centrifugal. Artificial organs, 35(7).
Catanho, M., Sinha, M., & Vijayan, V. (2012). Model of
aortic blood flow using the windkessel
effect. University of California of San Diago, San
Diago.
Thielicke, W., & Stamhuis, E. (2014). PIVlab–towards
user-friendly, affordable and accurate digital particle
image velocimetry in MATLAB. Journal of Open
Research Software, 2(1).
Design of a Percutaneous Left Ventricular Assist Device
305
