
Analysing Risk of Coronary Heart Disease through Discriminative
Neural Networks
Ayush Khaneja
1
, Siddharth Srivastava
2
, Astha Rai
2
, A. S. Cheema
2
and P. K. Srivastava
2
1
Vellore Institute of Technology, Vellore, India
2
Centre for Development of Advanced Computing, Noida, India
Keywords:
Deep Learning, Health Informatics, Discriminative Metric Learning.
Abstract:
The application of data mining, machine learning and artificial intelligence techniques in the field of diagnos-
tics is not a new concept, and these techniques have been very successfully applied in a variety of applications,
especially in dermatology and cancer research. But, in the case of medical problems that involve tests resulting
in true or false (binary classification), the data generally has a class imbalance with samples majorly belonging
to one class (ex: a patient undergoes a regular test and the results are false). Such disparity in data causes prob-
lems when trying to model predictive systems on the data. In critical applications like diagnostics, this class
imbalance cannot be overlooked and must be given extra attention. In our research, we depict how we can
handle this class imbalance through neural networks using a discriminative model and contrastive loss using
a Siamese neural network structure. Such a model does not work on a probability-based approach to classify
samples into labels. Instead it uses a distance-based approach to differentiate between samples classified under
different labels.
1 INTRODUCTION
The medical practitioners especially in tertiary care
hospitals work under tremendous workload result-
ing in a considerable impact on patient care (Mich-
talik et al., 2013; Lemaire et al., 2019). Further,
machine learning has shown promise in assisting
medical practitioners such as predicting diseases(Liu
et al., 2018), prognosis(Sun et al., 2019), complica-
tions(Meyer et al., 2018) and many more (Beam and
Kohane, 2018). Therefore, there is a need for auto-
mated diagnostic systems that can work based on pa-
tient details such as age, gender, medical history etc.
Also, the level of skill and knowledge of medical pro-
fessionals is highly variable (Cuthbert et al., 1999;
Basugi et al., 2011). Through our work, we aim at
providing a solution to these problems by developing
a model that can perform binary classification (pre-
dicting if a patient is at risk of suffering from a partic-
ular disease or not) while handling problems of real-
life data like class imbalance (Basugi et al., 2011). To
demonstrate the effectiveness of the proposed method
we select the Heart diseases are one of the most com-
mon ailments in the current times due to a lifestyle of
During this work, Ayush Khaneja was an intern at Cen-
tre for Development of Advanced Computing, Noida, India
fast food, stress, no exercise, and vices like smoking
and drinking. Thus, it becomes an important medical
problem to be able to predict heart-related problems
efficiently. We build our model to predict the risk of
coronary heart disease in patients using the publicly
available Framingham Heart Study data(Kannel et al.,
1971). The data is captured over a wide variety of pa-
tients and is amongst the most established datasets for
heart disease prediction (Zhu et al., 2018).
Automated prediction of diagnoses based on pa-
tient data has been a subject of interest for long
now (Chen et al., 2017). Various techniques have
been successfully applied to different types of data
and varied styles of diagnoses. Machine learning
models made to classify data follow one of the two
paradigms, generative or discriminative. Generative
classifiers model how data is generated in order to
classify a signal. Discriminative classifiers do not
care how data is generated, they just categorize a
given signal through a distance or similarity metric.
In our work, we propose a discriminative approach
to classification through the use of Siamese networks
with a contrastive loss function for binary classifica-
tion of coronary heart disease. We show that the pro-
posed method is highly stable and handles bias due to
class imbalance better than a vanilla neural network.
Khaneja, A., Srivastava, S., Rai, A., Cheema, A. and Srivastava, P.
Analysing Risk of Coronary Heart Disease through Discriminative Neural Networks.
DOI: 10.5220/0009190106150620
In Proceedings of the 9th International Conference on Pattern Recognition Applications and Methods (ICPRAM 2020), pages 615-620
ISBN: 978-989-758-397-1; ISSN: 2184-4313
Copyright
c
2022 by SCITEPRESS – Science and Technology Publications, Lda. All rights reserved
615

The rest of the paper is organized as follows. In
Section 2, we describe the works tackling health care
data for disease classification. In Section 3, we pro-
vide background of the techniques used and describe
the proposed method. In Section 4. Finally, the con-
clusion is provided in Section 5.
2 RELATED WORKS
A lot of research has been done in the field of disease
prediction. But none of the system is put in real life
picture to the best of our knowledge. Some of the ear-
liest Machine Learning based disease prediction was
done by W. Nick et al in 1995(Street et al., 1995).
They used a linear programming function for the pre-
diction of the disease. Haq et al (Haq et al., 2018)
used Logistic regression to detect heart related prob-
lems from patients demographic and diagnosis data.
Miotto et al (Miotto et al., 2016) used Decision Tree,
Artificial Neural Network and Support Vector Ma-
chine for detecting Breast Cancer from demographic
and EHR data of the patient. Benjamin Shickel et
al (Shickel et al., 2017) conducted a survey on the
deep learning technologies for the analysis of Elec-
tronic Health Record data. They compared in total of
6 projects in their paper.
Guo et al (Guo et al., 2016) have studied time
series with Recurrent Neural Network. In the WG-
Learning, they introduce the weighted gradient to the
online SGD for the RNN models, based on the lo-
cal features of time series. The method enables to
update the RNN models with down weighted gradi-
ents for outliers while full gradients for change points.
Shiyue Zhang et al (Zhang et al., 2017) proposed a
Variational Recurrent Neural Networks (VRNN) and
Discriminative Neural Network for the analysis of lab
test and their relation to diseases prediction. They
used a dataset of more than 46000 patients covering
50 lab tests to diagnose 50 common diseases. De-
trano et al. Authors in (Detrano et al., 1989) proposed
a logistic regression classifier-based decision support
system for heart disease classification. Leveraging
large historical data in electronic health record (EHR),
Edward Choi(Choi et al., 2016a) developed Doctor
AI, a generic predictive model that covers observed
medical conditions and medication uses. Doctor AI
is a temporal model using recurrent neural networks
(RNN) and was developed and applied to longitudi-
nal time stamped EHR data from 260K patients and
2,128 physicians over 8 years.
Edward Choi (Choi et al., 2016b) explored
whether use of deep learning to model temporal re-
lations among events in electronic health records
(EHRs) would improve model performance in pre-
dicting initial diagnosis of heart failure (HF) com-
pared to conventional methods that ignore temporal-
ity. Recurrent neural network (RNN) models using
gated recurrent units (GRUs) were adapted to detect
relations among time-stamped events (eg, disease di-
agnosis, medication orders, procedure orders, etc.)
with a 12- to 18-month observation window of cases
and controls. Model performance metrics were com-
pared to regularized logistic regression, neural net-
work, support vector machine, and K-nearest neigh-
bor classifier approaches. In contrast to the above
method, the proposed method works on the premise
that it is important to learn a discriminative embed-
ding among the classes to be classified rather than
only a good embedding.
3 METHODOLOGY
3.1 Background
Prior to explaining the proposed method, we briefly
describe the background concepts for the paper.
3.1.1 Discriminative Networks
Discriminative or conditional models are commonly
used in supervised learning applications. Instead of
modelling class-conditional probability distributions
and prior probabilities, they directly estimate poste-
rior probabilities directly from training data and do
not try to model the core probability distributions. Es-
sentially, discriminative models do not try to model
how a particular data sample might have been gener-
ated. Instead, they measure how similar or dissimilar
a data sample is from data of a particular class. Dis-
criminative models do not learn how to predict the
probability of data belonging to a particular class, but
learn how to differentiate between data from different
classes by observing its features.
3.1.2 Siamese Networks
They are a type of artificial neural networks that
are made up of two or more identical networks that
have identical weights. Working in tandem, each of
these inner networks receives an input vector based
on which an output vector is generated. These out-
put vectors can then be compared to see how similar
they are. Usually, Siamese networks are used to per-
form binary classification. This classification is done
by seeing how similar or dissimilar a data sample is to
samples of the two classes. The class exhibiting more
ICPRAM 2020 - 9th International Conference on Pattern Recognition Applications and Methods
616

similarity is decided as the predicted class. These
networks generally find use in applications like facial
identification, signature verification etc.
3.1.3 Contrastive Loss
It is a loss function typically used to learn the datas
discriminative features, i.e. learn to differentiate be-
tween samples from different classes. It is a distance-
based loss function that tries to ensure that data sam-
ples that are semantically similar are embedded closer
together, hence, calculated on pairs.
3.2 Proposed Network
The network we propose has two identical feed-
forward neural networks that work together and share
weights. An input pair is given to the Siamese net-
work and the inner networks receive one sample each
from the pair. The inner networks then calculate the
embeddings for their respective inputs and then the
distance is calculated on these embeddings. This dis-
tance is then used to calculate the contrastive loss.
Based on this calculate loss and the accuracy of the
whole network, the weights are accordingly updated.
3.2.1 Missing Value Imputation
All missing values were imputed and the whole data
was normalized. Then, the input pairs were gener-
ated. To generate these pairs, we used random num-
ber generation. The first step was to split our data
based on its label. Next, these new datasets were
shuffled to ensure randomness. Then, pairs were cre-
ated based on the generation of random numbers. ran-
dom samples were picked from our new data sets and
paired together. 100000 pairs were generated where
data was picked from different classes. 50000 sam-
ples each were generated here data was selected from
the same classes, i.e. 0 paired with 0 and 1 paired with
1. The 200000 pairs obtained were split in an 80-20
ratio to generate our training and testing data respec-
tively. Since our goal is to differentiate between the
two classes, we do not need to worry about samples
being repeated in the data.
4 EXPERIMENTS
4.1 Dataset
The dataset used is the Framingham dataset, which
contains 4240 samples and has 16 columns. the prop-
erties of the dataset is given in Table 1.
Table 1: Summary of the dataset.
Data Type Column Name Missing Values
Nominal male 0
currentSmoker 0
BPMeds 53
prevalentStroke 0
prevalentHyp 0
diabetes 0
TenYearCHD
(Label)
0
Continuous age 0
cigsPerDay 29
totChol 50
sysBP 0
diaBP 0
BMI 19
heartRate 1
glucose 388
Discrete education 105
4.2 Base Network
A simple feed-forward network with fully connected
layers was trained on regular data and its character-
istics were evaluated. This gave us a basis to im-
prove upon. The Siamese networks job was to im-
prove upon the performance of this network. The fol-
lowing table summarizes the final results obtained on
the base network after tweaking its hyperparameters.
During training 25% of the data was used for valida-
tion. The parameters of base network are shown in
Table 2 along with training loss and confusion matri-
ces over the classes. The goal was not only to increase
accuracy, but to keep the number of false negative er-
rors (1 classified as 0) at a minimum, because in the
case of medical data, a positive diagnosis being iden-
tified correctly is more important.
4.3 Results on the Proposed Network
The model was trained and its hyperparameters were
tweaked to reach accuracies of almost 100% in be-
ing able to differentiate between samples belonging
to different classes. Again, during training, a 25%
validation split was used. Now, to make predictions,
all that is needed is to take the new data and pair it
with data from both the class 0 and the class 1. The
network will tell us which class our data is closer to in
terms of distance and we can the classify our new data
accordingly. Table 2 summarizes the network param-
eters. Additionally, Fig 2 and 3 show the training and
testing curves for accuracy and loss of the proposed
network.
Analysing Risk of Coronary Heart Disease through Discriminative Neural Networks
617
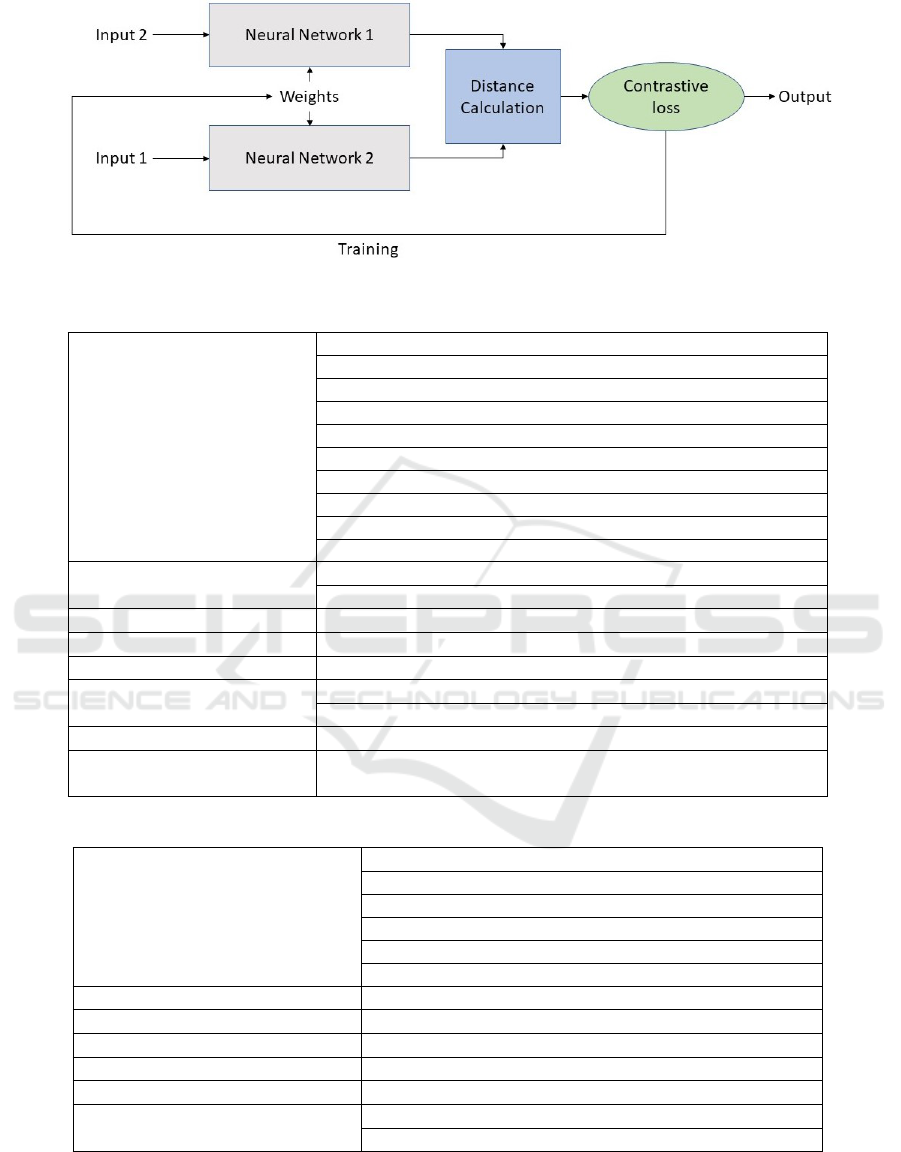
Figure 1: Structure of the proposed Siamese network.
Table 2: Parameter and experiments on base network.
Model Layers
Input layer (size = 15)
Hidden layer 1 (size = 256, L2 activity regularization = 0.01)
Dropout = 0.175
Activation layer 1 (ReLU)
Hidden layer 2 (size = 256, L2 activity regularization = 0.01)
Dropout = 0.175
Activation layer 2 (ReLU)
Output layer (size = 1, L2 activity regularization = 0.01)
Dropout = 0.175
Activation layer 3 (Sigmoid)
Optimizer
Adam optimizer
(learning rate = 0.001)
Loss Function Binary Crossentropy
Evaluation Metric Accuracy
Batch Size / No. of Epochs 16 / 250
Class Weights
Class 0: 1.0
Class 1: 5.0
Loss on Training data 1.01
Confusion Matrix
[ [508, 211],
[ 42, 87] ]
Table 3: Parameter and experiments on the proposed network.
Model Layers
Input layer (Dense, size = 15),
Hidden layer 1 (Dense, size = 256, activation = ReLU)
Dropout = 0.2
Hidden layer 2 (Dense, size = 256, activation = ReLU)
Dropout = 0.2
Output layer (Dense, size = 256, activation = ReLU)
Optimizer RMSProp (learning rate = 0.001)
Loss Function Contrastive Loss
Evaluation Metric Accuracy
Batch Size / Number of Epochs 64 / 10
Loss on Training data 0.0029
Confusion Matrix
[[19913, 133],
[0, 19954]]
4.4 Comparison Among Networks
The results on the base network and proposed network
are shown in Table 4. It can be observed that the pro-
posed method obtains a significant improvement over
the base network while achieving nearly 100% accu-
racy. It shows that while classification based on feed-
ICPRAM 2020 - 9th International Conference on Pattern Recognition Applications and Methods
618
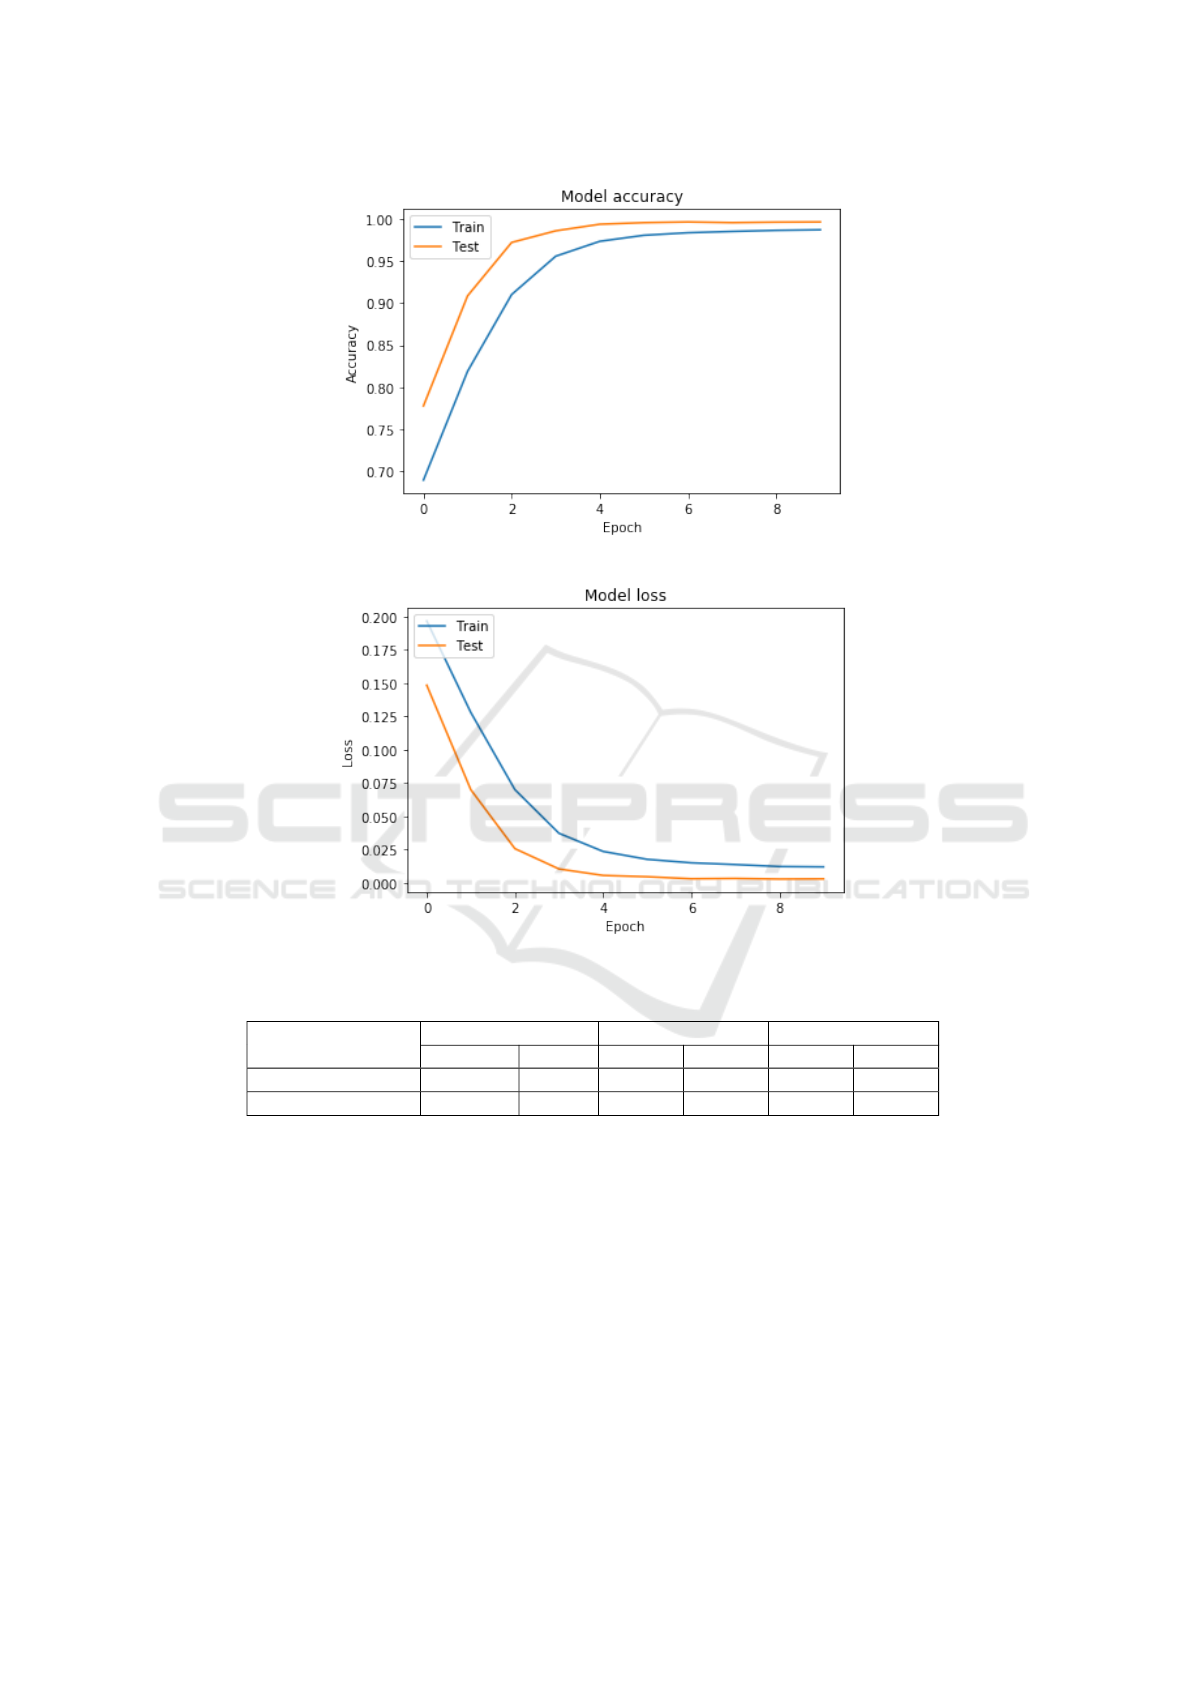
Figure 2: Accuracy.
Figure 3: Loss.
Table 4: Empirical Results on the Framingham dataset.
Method/metric
Accuracy Precision Recall
Training Test Class 0 Class 1 Class 0 Class 1
Base Network 0.72 0.70 0.92 0.29 0.71 0.67
Proposed Network 0.9966 0.9966 1.00 0.99 0.99 1.00
forward network work well if the data is balanced,
the discriminative network, with their ability to learn
a distance metric to map the input classes to separate
embedding space, allow for stronger representation of
the inputs, and hence result in more stable classifica-
tion. This is indicated by the fact that while the pre-
cision for class 1 using the base network is 0.29 as
compared to 0.92 for class 0, with the proposed net-
work the precision is nearly same for both the classes.
5 CONCLUSION
In this paper we proposed a method based on discrim-
inative network for classifying coronary heart disease.
We showed that such networks are more stable on im-
balanced data as compared to vanilla neural networks.
In future, we believe that our work has potential to be
integrated in practice with Hospital Management In-
formation Systems and used in real time for patient
diagnosis.
Analysing Risk of Coronary Heart Disease through Discriminative Neural Networks
619

REFERENCES
Basugi, A., Ohira, Y., and Ikusaka, M. (2011). Comparison
of the outpatient diagnostic process between novice
and trained residents. General medicine, 12(1):35–41.
Beam, A. L. and Kohane, I. S. (2018). Big data and machine
learning in health care. Jama, 319(13):1317–1318.
Chen, M., Hao, Y., Hwang, K., Wang, L., and Wang, L.
(2017). Disease prediction by machine learning over
big data from healthcare communities. Ieee Access,
5:8869–8879.
Choi, E., Bahadori, M. T., Schuetz, A., Stewart, W. F., and
Sun, J. (2016a). Doctor ai: Predicting clinical events
via recurrent neural networks. In Machine Learning
for Healthcare Conference, pages 301–318.
Choi, E., Schuetz, A., Stewart, W. F., and Sun, J. (2016b).
Using recurrent neural network models for early de-
tection of heart failure onset. Journal of the American
Medical Informatics Association, 24(2):361–370.
Cuthbert, L., Duboulay, B., Teather, D., Teather, B.,
Sharples, M., and Duboulay, G. (1999). Expert/novice
differences in diagnostic medical cognition-a review
of the literature.
Detrano, R., Janosi, A., Steinbrunn, W., Pfisterer, M.,
Schmid, J.-J., Sandhu, S., Guppy, K. H., Lee, S., and
Froelicher, V. (1989). International application of a
new probability algorithm for the diagnosis of coro-
nary artery disease. The American journal of cardiol-
ogy, 64(5):304–310.
Guo, T., Xu, Z., Yao, X., Chen, H., Aberer, K., and Funaya,
K. (2016). Robust online time series prediction with
recurrent neural networks. In 2016 IEEE International
Conference on Data Science and Advanced Analytics
(DSAA), pages 816–825. Ieee.
Haq, A. U., Li, J. P., Memon, M. H., Nazir, S., and Sun,
R. (2018). A hybrid intelligent system framework for
the prediction of heart disease using machine learning
algorithms. Mobile Information Systems, 2018.
Kannel, W. B., Castelli, W. P., Gordon, T., and McNamara,
P. M. (1971). Serum cholesterol, lipoproteins, and the
risk of coronary heart disease: the framingham study.
Annals of internal medicine, 74(1):1–12.
Lemaire, J. B., Miller, E. N., Polachek, A. J., and Wong, H.
(2019). Stakeholder groups unique perspectives about
the attending physician preceptor role: A qualitative
study. Journal of general internal medicine, pages 1–
9.
Liu, J., Zhang, Z., and Razavian, N. (2018). Deep ehr:
Chronic disease prediction using medical notes. arXiv
preprint arXiv:1808.04928.
Meyer, A., Zverinski, D., Pfahringer, B., Kempfert, J.,
Kuehne, T., S
¨
undermann, S. H., Stamm, C., Hofmann,
T., Falk, V., and Eickhoff, C. (2018). Machine learn-
ing for real-time prediction of complications in criti-
cal care: a retrospective study. The Lancet Respiratory
Medicine, 6(12):905–914.
Michtalik, H. J., Yeh, H.-C., Pronovost, P. J., and Brotman,
D. J. (2013). Impact of attending physician workload
on patient care: a survey of hospitalists. JAMA inter-
nal medicine, 173(5):375–377.
Miotto, R., Li, L., Kidd, B. A., and Dudley, J. T. (2016).
Deep patient: an unsupervised representation to pre-
dict the future of patients from the electronic health
records. Scientific reports, 6:26094.
Shickel, B., Tighe, P. J., Bihorac, A., and Rashidi, P. (2017).
Deep ehr: a survey of recent advances in deep learning
techniques for electronic health record (ehr) analysis.
IEEE journal of biomedical and health informatics,
22(5):1589–1604.
Street, W. N., Mangasarian, O. L., and Wolberg, W. H.
(1995). An inductive learning approach to prognostic
prediction. In Machine Learning Proceedings 1995,
pages 522–530. Elsevier.
Sun, D., Wang, M., and Li, A. (2019). A multimodal
deep neural network for human breast cancer progno-
sis prediction by integrating multi-dimensional data.
IEEE/ACM Transactions on Computational Biology
and Bioinformatics (TCBB), 16(3):841–850.
Zhang, S., Xie, P., Wang, D., and Xing, E. P. (2017). Medi-
cal diagnosis from laboratory tests by combining gen-
erative and discriminative learning. arXiv preprint
arXiv:1711.04329.
Zhu, Z., Zheng, Z., Zhang, F., Wu, Y., Trzaskowski, M.,
Maier, R., Robinson, M. R., McGrath, J. J., Visscher,
P. M., Wray, N. R., et al. (2018). Causal associations
between risk factors and common diseases inferred
from gwas summary data. Nature communications,
9(1):224.
ICPRAM 2020 - 9th International Conference on Pattern Recognition Applications and Methods
620
