
Parkinson’s Disease Glottal Flow Characterization: Phonation
Features vs Amplitude Distributions
Agustín Álvarez
1a
, Andrés Gómez
2b
, Daniel Palacios
3c
, Jiri Mekyska
4d
,
Athanasios Tsanas
2e
, Pedro Gómez
1f
and Rafael Martínez
1g
1
Neuromorphic Speech Processing Lab, Center for Biomedical Technology, Universidad Politécnica de Madrid,
Campus de Montegancedo, 28223 Pozuelo de Alarcón, Madrid, Spain
2
Usher Institute, The University of Edinburgh, Edinburgh Bioquarter, 9 Little France Road, Edinburgh, EH16 4UX, U.K.
3
Escuela Técnica Superior de Ingeniería Informática, Universidad Rey Juan Carlos, Calle Tulipán, s/n, 28933 Móstoles,
Madrid, Spain
4
Department of Telecommunications, Brno University of Technology, Technicka 10, 61600 Brno, Czech Republic
Keywords: Neuromotor Disease Phonation, Glottal Signature, Parkinson’s Disease, Aging Voice.
Abstract: The study of speech and voice in people diagnosed with a neurodegenerative disorder for the purposes of
detection and monitoring has known a very relevant push forward in these last years, but it is far from being
completed. One of the main concerns nowadays is that once the deterioration of speech and phonation quality
has been informed by machine learning relying upon clinical expertise, there is insufficient evidence to resolve
if quality deterioration may come from organic causes, neuromotor degeneration or simply from aging. The
present work is part of a more ambitious plan to shed light on this problem by resorting to a theoretical
modelling of glottal signals under the main known causes affecting phonation quality, which are closure
deficits during the phonation cycle. These deficits may be due to anatomical, organic pathologic or
neuromotor reasons. Simulation examples explaining them in the glottal excitation signals are given and
contrasted with real examples. Finally, relevant scores from an experimental separation of Parkinson Disease
phonation samples from 24 male and 24 female subjects against aging 24 male and 24 female controls on the
same age taken from a male-female balanced dataset confronted to a normative subset of 24 male and 24
female speakers are presented to exemplify an analysis study deepening into this problem. Although
classification accuracy scores as high as 99.69 and 99.59 were attained in 10-fold cross-validation using an
SVM classifier, there is still the impression that co-morbidity and aging effects are not well taken into account,
requiring a further semantic study on the features behind the discrimination scores obtained.
1 INTRODUCTION
Parkinson’s Disease (PD) is a neurodegenerative
disorder second in prevalence to Alzheimer’s Disease
(Dorsey et al., 2007). Its origin is mainly caused by
the lack of a specific neurotransmitter known as
dopamine in midbrain (Dauer & Przedboski, 2003),
resulting in important neuromotor deterioration
affecting body movement (Jankovic, 2008). Other
comorbidities associated to PD are e. g. depression,
and cognitive decay (Reijnders et al., 2008). Since the
a
https://orcid.org/0000-0002-3387-6709
b
https://orcid.org/0000-0001-8643-9871
c
https://orcid.org/0000-0001-6063-4898
d
https://orcid.org/0000-0002-6195-193X
e
https://orcid.org/0000-0002-0994-8100
f
https://orcid.org/0000-0003-3283-378X
g
https://orcid.org/0000-0003-2336-9145
early work of Dr. James Parkinson (Parkinson, 1817)
describing observable neuromotor alterations in
patients of shaking palsy, it is a well-established fact
that PD produces important disorders in speech and
phonation (Ricciardi et al., 2016, Brabenec et al.,
2017). Basically, speech alterations may be classified
as dysphonia (alterations to the production of voice),
dysarthria (alterations in the articulation of speech),
dysprosody (alterations in the definition of the
fundamental frequency) and dysfluency (alterations
in the rhythm and in speech blocking). Therefore
Álvarez, A., Gómez, A., Palacios, D., Mekyska, J., Tsanas, A., Gómez, P. and Martínez, R.
Parkinson’s Disease Glottal Flow Characterization: Phonation Features vs Amplitude Distributions.
DOI: 10.5220/0009189403590368
In Proceedings of the 13th International Joint Conference on Biomedical Engineering Systems and Technologies (BIOSTEC 2020) - Volume 4: BIOSIGNALS, pages 359-368
ISBN: 978-989-758-398-8; ISSN: 2184-4305
Copyright
c
2022 by SCITEPRESS – Science and Technology Publications, Lda. All rights reserved
359
speech analysis may become a non-invasive and cost-
efficient tool to characterize and monitor PD in the
sense that there is “compelling evidence to suggest
that speech can help quantify not only motor symptoms
... but generalized diverse symptoms in PD” (Tsanas,
2012). The first aim of this study is answering in which
way neuromotor deterioration affecting the larynx may
result in phonation alterations, and which are the
observable correlates to be expected. The second aim
of the study is to assess in which extent neuromuscular
alterations can help in differentiating PD patients
against age-paired Healthy Controls (HC) in reference
to the phonation of normative subjects (NS), see
Gómez et al. (2019). The paper is organized as follows:
in Section 2 the main glottal pattern deteriorations
expected from altered phonation are described and a
phonation model is presented to simulate these altered
patterns; in Section 3 the phonation databases and the
classification methods used are being described; in
section 4 results are presented and discussed, as well as
the semantic characteristics of the main features
responsible for categorical classification based on
phonation; section 5 summarizes the main conclusions
and findings.
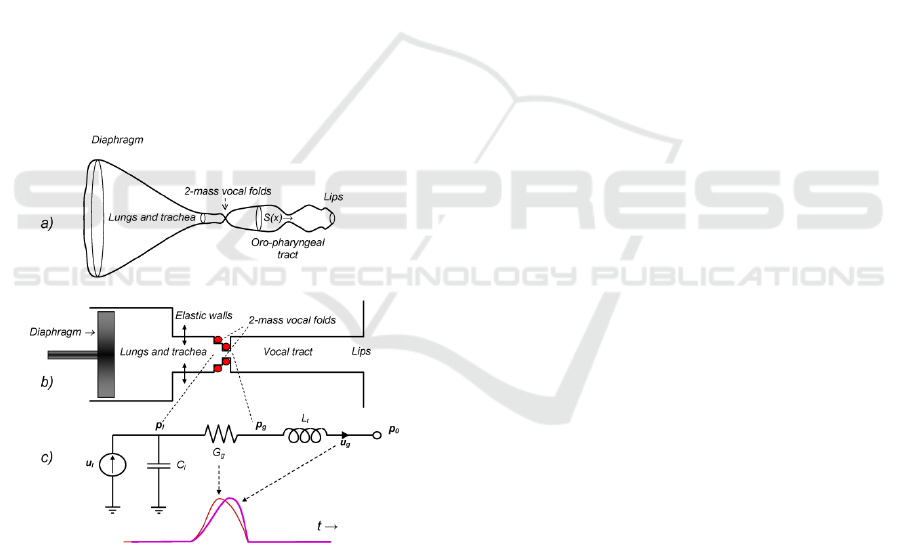
Figure 1: The human phonation system. a) Idealized axial
representation. b) Simplified cylindrical representation. c)
Electromechanical equivalent model, where G
g
is the glottal
aperture (time-varying electromechanical equivalent
conductance, thin red line) u
g
is the glottal flow
(electromechanical equivalent current, thick purple line), t
is the time. The model explains how the injection of flow u
l
is transformed in a difference of pressure between the
supraglottal (p
g
) and subglottal (p
l
) sides of the moving
vocal folds (represented by the red bullets) and transformed
into a glottal excitation by the inertial effects of air in the
vocal tract (L
t
). C
l
explains the reactive elastic behavior of
lungs and bronchi. See the explanation below.
2 PHONATION ALTERATIONS
Voiced speech is the result of the continuous opening
and closing of the vocal folds, specific muscle bands
and ligaments found in the neuromuscular and
cartilaginous structure of the larynx (Titze, 1994).
This section is devoted to explain certain phonation
defects resulting from the imperfect closure of the
vocal folds during the phonation cycle, which may be
related to different causes, organic pathology,
neuromotor instability or aging, among them. The
Human Phonation System (HPS) is part of the
respiratory organs, and as such, it is integrated by the
respiratory system in itself, the larynx, and the oro-
naso-pharyngeal cavities, as seen in 0. The HPS
comprises different flow/pressure propagating
structures (lungs, bronchi, trachea, larynx, pharynx,
nasopharynx and oral and nasal cavities), ending at
the lips. In the present work it must be taken into
account that:
• The system of cavities may be seen on their
equivalent transversal section as a volume closed
by an ideal revolving surface of varying section
along a single axial line (x axis, see 0.a). The
axial line in the sagittal plane may be
straightened to an axis normal to the mouth
radiation plane (medial). The distances along this
rectified axis will be denoted by x. The origin x=0
will be taken at the lips, pointing to the glottis
(space separating both vocal folds at x=x
g
).
• This structure may be represented by a chain of
cylindrical structures for the lungs, bronchi,
trachea, larynx and vocal tract
(0.b).Electromechanical equivalence convention
used in the HPS assumes that pressures are
equivalent to voltages and flows to currents in an
electric circuit. With this convention in mind the
equivalent cylindrical structure may be
represented by its electromechanical equivalent
given in 0.c, integrated by a flow injector
(diaphragm and lungs acting as a piston and
chamber) represented by a current source u
l
(glottal lung flow) and an elastic compliance C
l
,
a larynx passage represented by moving bullets
(vocal folds) which open and close following
transversal muscle forces and Bernoulli’s effect,
represented by a time-variable conductance G
g
(t)
and the vocal tract tube, represented by an inertial
reactance L
t
through which a current u
g
(glottal
flow) will be pushed to the lips. The pressure
build-up at the subglottal side of the glottis will
be represented by a voltage p
l
(subglottal
pressure), whereas the voltage p
g
(supraglottal
SERPICO 2020 - Special Session on Mining Self-reported Outcome Measures, Clinical Assessments, and Non-invasive Sensor Data
Towards Facilitating Diagnosis, Longitudinal Monitoring, and Treatment
360
pressure) will appear at the other side of the
glottis. The pressure at the lips will be the
atmospheric reference pressure p
0
. This is the
basis of Rothenberg’s model of phonation
(Rothenberg, 1973), which will be used in this
study to reproduce basic phonation defects.
• Only oral phonations will be studied here, in
order for the HPS to be modeled as a single tube
with no lateral derivations. This condition will
exclude the production of phonations related
with [m, n, ɲ] and nasalized vowels ([ῦ], with
open velo-pharyngeal switch).
The idealized HPS will assume that plane wave
propagation is to be considered along the transversal
section of the equivalent cylindrical model S(x). It
will be possible to represent the HPS three main
subsystems described by the following models:
• The respiratory subsystem, comprising the
diaphragm, lungs, bronchi and trachea, where C
l
is the mechanical compliance of the respiratory
cavities, and u
l
=u(x=x
l
,t) and u
g
=u(x=x
g
,t) are the
airflows at the subglottal (x=x
l
) and supraglottal
(x=x
g
) sides of the vocal folds given by the
following relationship:
(
,
)
=
(
,
)
+
,
(1)
• The glottal subsystem, comprising vocal fold
biomechanics will be represented by its
electromechanical equivalent conductance G
g
which under the pressure difference between the
subglottal p
l
=p(x
l
,t) and supraglottal p
g
=p(x
g
,t)
sides of the vocal folds induces a flow of air as:
,=
()(
(
,
)
−(
,)) (2)
• The Oro-Naso-Pharyngeal Tract (ONPT), which
may be represented by a tube of uniform section
and inertial parameter L
t
, and the contour
conditions at x=0 (open space) and x=x
g
as
follows:
,=
,
;
(
0,
)
=0
(3)
The HPS considers that voice is produced by the
vibrations of the vocal folds, represented by red
bullets moving transversally to the axial line x, which
result in strong pressure changes in the supraglottal
side of the vocal folds. This pressure signal p
g
=p(x
g
,t)
is known as the glottal source. Indeed, the movement
of the vocal folds is much more complex, as it has to
be observed in the transversal section of the glottis, as
seen in Figure 2.a-f. The idealized model used in this
study assumes that the transversal motion of the vocal
folds is represented by the average space left by both
vocal folds in their medial section (midpoint between
the lower and upper bands on the vertical axis of any
of the templates a-f in Figure 2).
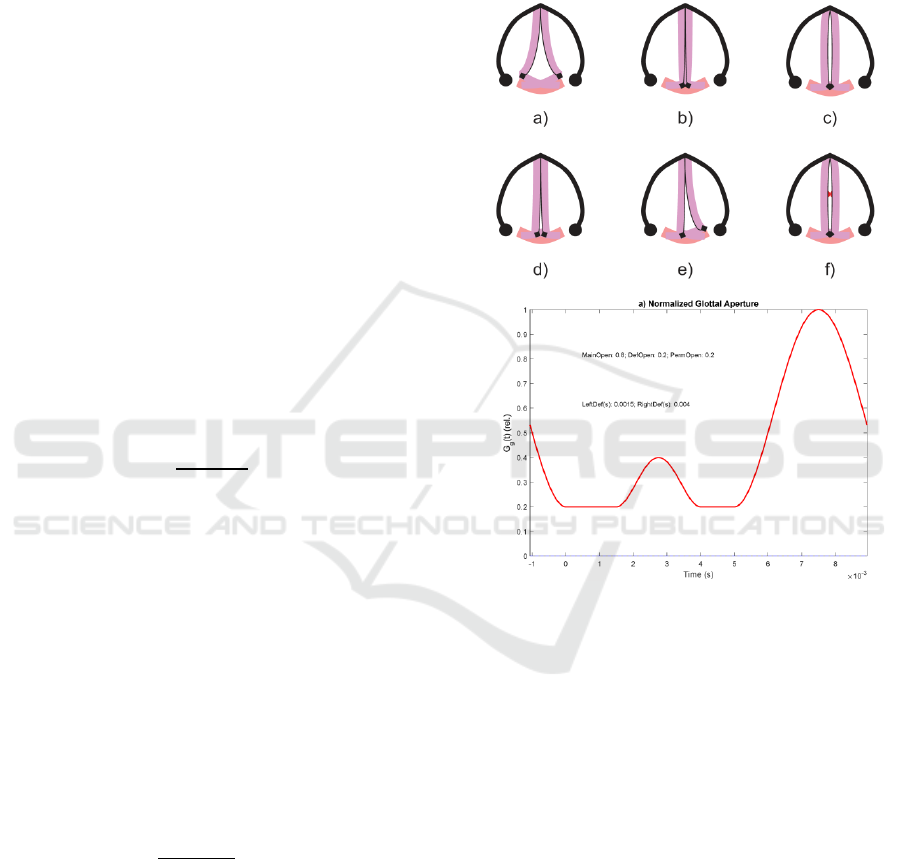
Figure 2: Glottal aperture (Top): a) Inspiration or
Expiration; b) Full closure; c) Phonation open phase; d)
incomplete permanent gap defect; e) unilateral vocal fold
paresis; f) medial contact gap defect; (Bottom): glottal
aperture function G
g
(t) corresponding to permanent and
temporary contact gap defects.
In the upper template six different patterns of the
vocal fold closure are seen, corresponding to:
a) Inspiration or Expiration. Both vocal folds are
separate and allowing the flow to and from lungs.
b) Full closure. The vocal folds are brought close
together by their attachments to the aritenoid
cartilages (black diamonds). No glottal space is
left. This may happen when breath is held or
during the contact phase of the phonation cycle.
c) Phonation open phase. The vocal folds are
brought together but air pressure from lungs can
Parkinson’s Disease Glottal Flow Characterization: Phonation Features vs Amplitude Distributions
361

separate them momentarily when an air puff is
released (glottal pulse).
d) Permanent gap defect. Both vocal folds cannot be
brought together to a complete closure, and some
glottal space is left in the aritenoid side. This gap
defect is usually of anatomical nature.
e) Asymmetric contact defect. One of the vocal
folds is not reacting to neuromotor activation and
cannot be taken to its medial position, therefore
a complete closure cannot be reached. It is
usually due to physiological paralysis of one of
the vocal folds, or to a lesion of laryngeal nerves.
f) Contact gap defect. Both vocal folds cannot be
taken to a complete closure during the contact
phase due to some organic lesion on their
structure, as nodules, polyps or cysts, among
others. If the lesion affects the medial part of the
vocal folds two spaces are left on the aritenoid
(bottom) or thyroid (top) sides in a shape of an
hourglass. This defect appears as a temporary
undue opening during the contact phase, during
which an improper escape of flow is produced,
as seen in the lower template of Figure 2, where
the time pattern of a hypothetical aperture
function (Gg) is represented, in which a
permanent escape of air is present due to a
permanent defect of amplitude 0.2 relative to the
maximum flow (supposed 1.0), besides a
temporary contact defect of relative amplitude
0.15 between 1.5 and 3.5 ms. The main aperture
(proper flow escape) is observed between 5.5 and
10 ms (assumed to be cyclic). The time axis is
referenced to the Maximum Flow Declination
Ratio (MFDR), therefore part of the closing
phase of the glottal aperture has assigned
negative time values.
In general, gaps and contact defects lead to the
creation of vortices and noise turbulence, which are
effects out of the scope of the present study. Different
patterns of the glottal flow and source are shown in
the next plots from Figure 3 to Figure 6, as a response
of different glottal aperture functions when
synthesized by Rothenberg’s model. All of them
show the amplitude-normalized glottal flow (a), its
amplitude distribution from a 100-bin normalized
histogram (b) the amplitude-normalized glottal
source (c) and its amplitude distribution (d). The
glottal source in c) is synchronized with the strong
decay resulting from the closing of the glottis aligned
with the origin and end of the glottal cycle (MFDR),
as it is produced by the sharp pressure decay when the
flow is decreasing at its fastest rate in a), according to
(3). The glottal source cycle is initiated with a fast
pressure raise to 0 (resting state at atmospheric
pressure), the flow in a) being zero (contact or closed
phase). At t=5 ms the aperture function in Figure 2.f)
starts opening, which results in a raise in flow (Figure
3.a) and a build-up in glottal pressure (Figure 3.c).
The maximum in the glottal pressure (source) is
aligned with the maximum slope in the glottal flow.
When the glottal flow (a) reaches a maximum value,
the glottal source crosses the zero line and becomes
negative (c). At the point that the glottal flow reaches
its minimum negative slope (a) the glottal source (c)
reaches its minimum (MFDR). This evolution of the
glottal source is known as the Liljencrants-Fant cycle
or LF pattern (Fant and Liljencrants, 1985).
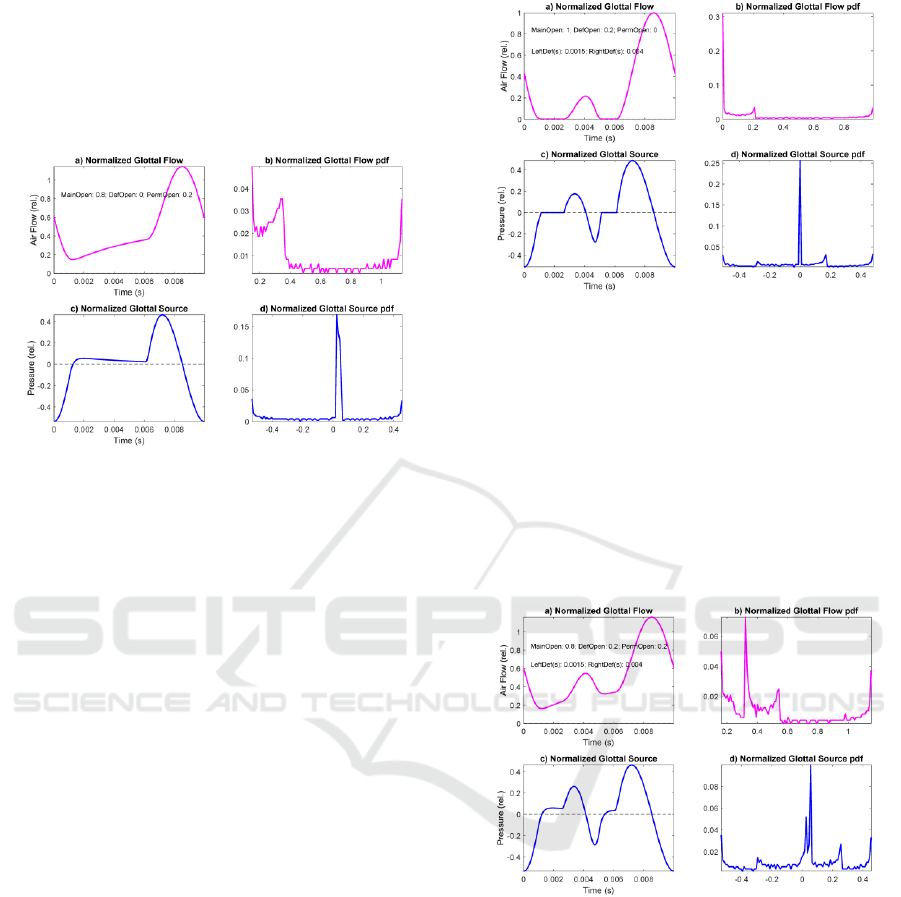
Figure 3: Glottal flow and source response of Rothenberg’s
Model to a normative aperture function (no permanent or
gap defects): a) Normalized glottal flow; b) 100-bin
amplitude histogram of the glottal flow; c) Normalized
glottal source under the same conditions; d) 100-bin
amplitude histogram of the glottal source.
The glottal source in c) is synchronized with the
strong decay resulting from the closing of the glottis
aligned with the origin and end of the glottal cycle
(MFDR), as it is produced by the sharp pressure
decay when the flow is decreasing at its fastest rate in
a), according to (3). The glottal source cycle is
initiated with a fast pressure raise to 0 (resting state at
atmospheric pressure), the flow in a) being zero
(contact or closed phase). At t=5 ms the aperture
function in Figure 2.f) starts opening, which results in
a raise in flow (Figure 3.a) and a build-up in glottal
pressure (Figure 3.c). The maximum in the glottal
pressure (source) is aligned with the maximum slope
in the glottal flow. When the glottal flow (a) reaches
a maximum value, the glottal source crosses the zero
line and becomes negative (c). At the point that the
glottal flow reaches its minimum negative slope (a)
the glottal source (c) reaches its minimum (MFDR).
SERPICO 2020 - Special Session on Mining Self-reported Outcome Measures, Clinical Assessments, and Non-invasive Sensor Data
Towards Facilitating Diagnosis, Longitudinal Monitoring, and Treatment
362
This evolution of the glottal source is known as the
Liljencrants-Fant cycle or LF pattern (Fant and
Liljencrants, 1985). In Figure 4 a case of permanent
gap defect is simulated. The vocal folds leave a
permanent space for airflow, usually by the aritenoid
zone, as depicted in Figure 2.d.
Figure 4: Glottal flow and source response of Rothenberg’s
Model to an anomalous aperture function (permanent gap).
a) Normalized glottal flow. b) 100-bin amplitude histogram
of the glottal flow. c) Normalized glottal source under the
same conditions. d) 100-bin amplitude histogram of the
glottal source.
It may be seen that after reaching a non-zero
minimum the glottal flow (a) experiences an
increment in time during what should be the contact
phase, to the point where it burst-up (open phase) to
start a decay. The glottal source (c) does not recover
to the resting state, but it overpasses it, and a small
and almost steady overpressure is observed till the
opening burst-up and posterior decay to its MFDR.
The glottal flow amplitude distribution (b) suffers a
relevant distortion, most of the accumulation at lower
amplitudes being displaced to mid amplitudes. The
glottal source amplitude distribution (d) does not
suffer important changes (a widening and a small
jump of the expected spike at the resting position).
In Figure 5 a case of temporary contact defect is
simulated. A puff of flow is produced during the
contact phase, similar to the one represented in Figure
2.f, but with no permanent gap. It may be seen that
the temporary contact defect appearing between 1.5
and 3.5 ms produces a reduced replica of the main
glottal source LF pattern (c), which may be
considered a wavelet of the main cycle (Mallat,
1998). Thus, wavelet description techniques have
been used in characterizing it (Gómez et al., 2013a).
The glottal flow and source amplitude distributions
are not strongly affected with respect to the normative
case (Figure 3).
Figure 5: Glottal flow and source response of Rothenberg’s
Model to an anomalous aperture function (temporary
contact gap). a) Normalized glottal flow. b) 100-bin
amplitude histogram of the glottal flow. c) Normalized
glottal source under the same conditions. d) 100-bin
amplitude histogram of the glottal source.
In Figure 6 a case of joint permanent and temporary
contact defects is simulated. A puff of flow is
produced during the contact phase, similar to the one
represented in Figure 5, and a steady flow escape as
in Figure 4 are present simultaneously, as given in
Figure 2.f.
Figure 6: Glottal flow and source response of Rothenberg’s
Model to an anomalous aperture function (permanent and
temporary contact gaps). a) Normalized glottal flow. b)
100-bin glottal flow amplitude histogram c) Normalized
glottal source under the same conditions. d) 100-bin glottal
source amplitude histogram.
The simulation results show a combined behavior of
the cases presented in Figure 4 and Figure 5, a steady
increment in the flow (a) as a consequence of the
permanent defect, and a wavelet replica of the main
glottal cycle (c) as a consequence of the contact
defect. Glottal flow amplitude distribution
experiments a larger distortion due to permanent
defect than to contact defect. The question now is to
Parkinson’s Disease Glottal Flow Characterization: Phonation Features vs Amplitude Distributions
363
which extent these synthesized simulations can
represent real phonation defects. For such, a real
glottal flow and source cycle and its associated
amplitude distribution, resulting from the analysis of
a segment of vowel [a:] by a male speaker with
anomalous phonation are given as an example in 0
(Top four templates), whereas in the bottom four
templates synthetic glottal flow and source patterns
produced by Rothenberg’s Model are shown.
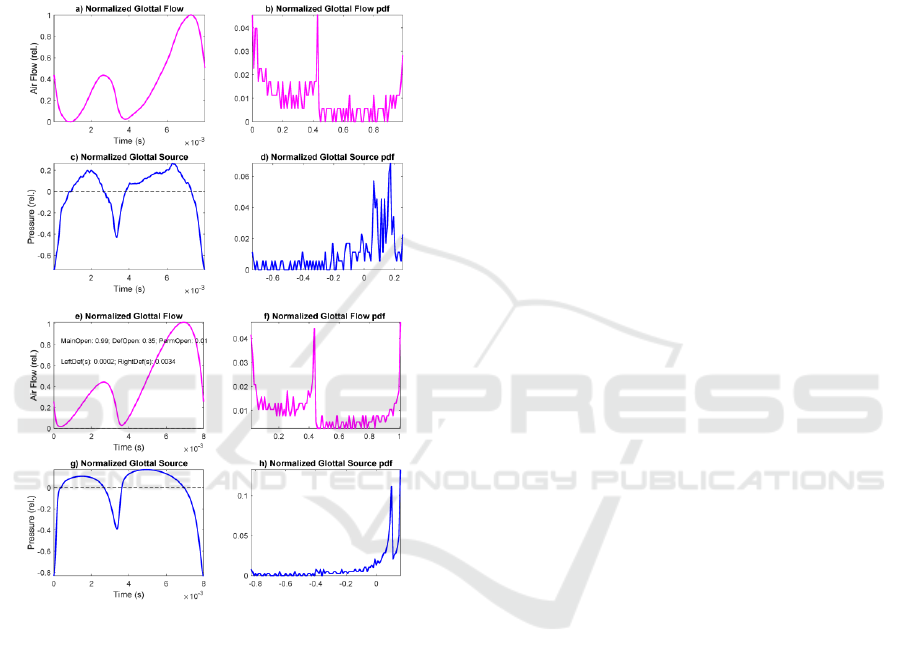
Figure 7: Top: Glottal flow and source estimated from a
pathological phonation of [a:] by a male speaker: a) Glottal
flow; b) Glottal flow distribution; c) Glottal source; d)
Glottal source distribution. Bottom: Glottal flow and source
synthesized by Rothenberg’s Model from an anomalous
aperture (permanent and contact gaps): e) Normalized
glottal flow; f) 100-bin amplitude histogram of the glottal
flow; g) Normalized glottal source; h) 100-bin amplitude
histogram of the glottal source. Model settings: Contact
defect t
cd
=3.2 ms; Amplitude of contact defect A
cd
=35%
max aperture; Phonation period t
cy
=8 ms; Open phase
t
op
=3.6 ms.
It may be seen that the synthetic glottal signals
replicate the anomalous contact behavior of the real
ones (obtained by vocal tract inversion) in amplitude
and time. The similarity between the real and
synthetic amplitude normalized histograms is
evident. This example gives support to the use of
amplitude distributions in pattern matching tasks
related with pathology detection and monitoring from
phonation samples (see Kreiman, 2012).
3 MATERIALS AND METHODS
Following this reasoning, the possibility of using
phonation stability features in maintained open
vowels as [a:] has been evaluated in characterizing
neurologic PD patient phonation from that of
normative and healthy controls within the same age
range. The validation of phonation and contact
defects in the separation of pathological PD and aging
voice samples from normative ones has been carried
out using features from PD patients’ phonations vs
healthy controls, and normative speakers. The data
used were extracted from vowel utterances of [a:]
from 24 male and 24 female PD patients randomly
selected from male and female databases (Mekyska et
al., 2015) within an age range of 67.5±7.7 and
67.4±9.1 years (respectively) processed to produce a
PD database (MPD from male subjects, and FPD for
female ones). The average time interval since their
first diagnostic to the recording instant was of
8.17±4.21 years and 6.46±3.59 years respectively.
Patients were recorded in ON state about 2 hours after
medication intake. Similar utterances from another
set of 24 male and 24 female control subjects
randomly selected within an age of 61.3±9.3 and
65.1±8.9 years old respectively from the same
database were also processed and stored in a healthy
control database (MHC from male subjects and FHC
from female ones). The database (PARCZ) was
collected at St. Anne’s University Hospital in Brno
(Czech Republic), including demographic and
clinical information from each patient as gender, age,
time since first diagnosis, scores of the Unified
Parkinson’s Disease Rating Scale part III (UPDRS-
III: motor examination), medication and other non-
motor evaluations. Recordings were sampled at 48
kHz with 16-bit resolution. All patients signed an
informed consent form that was approved by the local
ethics committee. This partial study was also
approved by the Ethical Committee of Universidad
Politécnica de Madrid. Similarly, 24 male and 24
female subjects were randomly selected from a
normative database recorded at Hospital Gregorio
Marañón, of Madrid (HUGM), Spain, within an age
range of 42.3±11.2 and 37.3±11.7 (years)
respectively to serve as the normative male and
female datasets. In this case the recordings were
sampled at 44.1 kHz with 16-bit resolution. The
normative subsets are (Male Normative Set) and FNS
SERPICO 2020 - Special Session on Mining Self-reported Outcome Measures, Clinical Assessments, and Non-invasive Sensor Data
Towards Facilitating Diagnosis, Longitudinal Monitoring, and Treatment
364

(Female Normative Set). Although the databases
PARCZ and the HUGM have been recorded at
different sampling rates, down-sampling to 16 kHz
under channel equalization conditions grant similar
signal quality. Their main difference is on the
phonation characteristics, in PARCZ subjects
produced vowels no long than 2 s, whereas in HUGM
speakers could sustain vowels for 5 s and more. The
analysis has been conducted on 300 ms segments
taken from the middle of the vowel nucleus for best
results, down-sampling them to 16 kH to grant good
spectral contents at a reasonable computational cost.
The features used in the study are of two types:
average and standard deviation of jitter, shimmer,
noise-harmonic ratio, biomechanical parameters and
tremor estimations on one side (Gómez et al., 2017),
and glottal flow amplitude distributions as described
in section 2 on the other side. Feature extraction was
carried out according to the protocol described below:
• Recordings of [a:] from MNS, FNS, MHC, FHC,
MPD and FPD are down-sampled to 16 kHz.
• The ONPT transfer function is evaluated by a 20-
pole adaptive inverse lattice-ladder filter (Deller,
Proakis and Hansen, 1993). This transfer function
is removed from the spectral contents of the
speech signal (inversion). A complete description
of the adaptive inversion filter details can be
found in Gómez et al. (2009).
• The inverse filtering residuals are integrated twice
to give the glottal source and flow (p(x
g
,t), u(x
g
,t)).
• A normalized 50-bin amplitude histogram of
u(x
g
,t) is estimated for each subject sample.
• The histograms are used to estimate the
Amplitude Distributions (AD) by Kolmogorov-
Smirnov approximations (Webb, 2002).
• An average amplitude distribution is estimated for
each subset: avADMNS, avADFNS, avADMHC,
avADFHC, avADMPD and avADFPD.
• The glottal cycle-synchronous average (av)
estimates of the standard features (SF) as jitter,
shimmer, noise-harmonic ratio, vocal fold mass
and stiffness, their one-cycle unbalances, the three
termor band amplitudes, and their standard
deviations (sd) are also estimated as: avSFMNS,
avSFFNS, avSFMHC, avSFFHC, avSFMPD and
sdSFFPD and sdSFMNS, sdSFFNS, sdSFMHC,
sdSFFHC, sdSFMPD and sdSFFPD.
The classification methodology used is based on a
standard Support Vector Machine classifier
according to the following protocol:
• Feature selection is applied to each feature set
(FSA and FSB) using ReliefF (Kononenko et al.,
1997, Robnik-Šikonja and Kononenko, 2003),
with a number of neighbors varying between 1
and 50. As a result, 50 different arrangements in
ranking order for the total number of features
considered (144 from feature averages and
standard deviations and 100 from amplitude
distributions) are produced. Features are selected
in subsets of N features (between 15 and 120) in
order of ranking, from the highest to the lowest,
accordingly to the ranking provided by ReliefF.
• Each feature subset is the input to a Support
Vector Machine (SVM) with a Gaussian radial
basis function (RBF) kernel (Cortes and Vapnik,
1995) following the implementation given in
(Chang and Lin, 2011). In the present work SVMs
were used as an alternative to generate
classification results using cross-validation of all
the datasets distributed in 10 groups (10-fold
cross-validation). The process described is carried
on all the combinations of SVM grid space
parameters (C, γ) given as C=[2
-3
, 2
-2
,..., 2
12
] and
γ = [2
-1
, 2
-2
, ..., 2
-10
].
• The subset of N features producing the best results
in terms of accuracy is selected, using the classical
definition for sensitivity (STV), specificity (SPC)
and accuracy (ACC)
=
=
+
=
=
+
=
( + )
+ + +
(4)
with TP: true positives, TN: true negatives, FP:
false positives and FN: false negatives.
The performance indices STV, SPC and ACC for
each winner subset of N features corresponding to
FSA or FSB are estimated on the average of 1000
different runs over the 10 groups (1000 runs of the
10-fold cross validation). The results statistical
relevance was estimated by Wilcoxon rank sum test
(Mann-Whitney U) from feature averages and
standard deviations, and amplitude distribution bins,
independently for the male and female datasets.
4 RESULTS AND DISCUSSION
Table 1 gives comparative results after cross-
validation (1000 runs, 10-fold) in terms of STV, SPC
Parkinson’s Disease Glottal Flow Characterization: Phonation Features vs Amplitude Distributions
365

and ACC and detection error (ERR) for male and
female datasets under a maximum p-value<10
-4
.
Rows 1 and 4 compare the standard features average
and standard deviation estimations from PD patients
vs healthy controls (1: males, 4: females). It may be
seen that the detection error is smaller for the female
dataset (4.144%) than for the male dataset (6.129%).
If the comparison is carried out using the amplitude
distributions (rows 2 and 5) the error is smaller for the
male dataset (5.235%) than for the female dataset
(7.783%). If both types of features are fused (rows 3
and 6) the errors are much smaller than when features
are separated and comparable (males: 2.127%,
females: 2.681%). If the features from the normative
datasets are fused on the reference set (rows 7 and 8)
the performance of the detection process is very much
enhanced regarding detection errors (males: 0.312%,
females: 0.408%).
Table 1: Merit figures for the different tests in % (M): Male
Sets; (F): Female Sets.
# Test Set Ref Set STV SPC ACC ERR
1(M)
avSFMPD
sdSFMPD
avSFMHC
sdSFMHC
93.871 93.871 93.871 6.129
2(M) avADMPD avADMHC 93.441 96.087 94.764 5.235
3(M)
avSFMPD
sdSFMPD
avADMPD
avSFMHC
sdSFMHC
avADMHC
95.800 99.946 97.873 2.127
4(F)
avSFFPD
sdSFFPD
avSFFHC
sdSFFHC
97.808 93.904 95.856 4.144
5(F) avADFPD avADFHC 97.821 86.612 92.217 7.783
6(F)
avSFFPD
sdSFFPD
avADFPD
avSFFHC
sdSFFHC
avADFHC
97.412 97.225 97.319 2.681
7(M)
avSFMPD
sdSFMPD
avADMPD
avSFMHC
sdSFMHC
avSFMNS
sdSFMNS
avADMHC
avADMNS
99.950 99.556 99.687 0.312
8(F)
avSFFPD
sdSFFPD
avADFPD
avSFFHC
sdSFFHC
avSFFNS
sdSFFNS
avADFHC
avADFNS
99.625 99.575 99.591 0.408
Nevertheless, this last situation is not the natural one,
as the normative dataset has been recruited under very
specific and controlled conditions (healthy young
subjects and well sustained phonation). Anyhow, the
results indicate that the detection capability of
amplitude distributions taken isolated are comparable
to those of standard feature parameters (averages and
standard deviations), and that their fused combination
produces substantial improvements when comparing
phonation features from PD patients with those from
healthy controls. This situation is closer to the real
conditions in which phonation tests are conducted, as
in daily life patient monitoring under limited quality
standards. If the reference set includes normative
subjects recorded under high quality standards the
detection errors decay strongly, as it could be
expected. The most relevant features regarding
detection in each experiment are given in Table 2.
Table 2: Ranked features by ReliefF in terms of joint
association with the binary outcome. The features in bold
are repeating in two or more experiments. The features in
italics are relative to distortion, unbalance or tremor. The
underlined features correspond to the first and fourth
quartile of the amplitude distributions. (M): Male Sets; (F):
Female Sets.
#
Feature Averages/Std.
Devs.
Amplitude Distributions
1(M)
18 45 47 49 57 62 66
18 33 42 49 59 61 63 69
70 72
2(M)
2 3 10 13 14 15 26 28 29 30
38 39 40 84 85 86 87 90 93
97 99
3(M)
20 21 24 39 42 52 62
7 61 69 70 95 98 100
4 27 41 58
4(F)
1 10 12 14 39 41 46 56
59 69
4 15 18 19 23 25 69
5(F)
2 4 5 7 8 57 58 59 61 62 66
95
6(F)
33 39 42 43 50 58 59
17 46 48 68 71 79
51 57 58 59 63 64
7(M)
9 11 13 14 32 69 72
3 4 6 14 20 38 90 92
5 9 11 20 33 47 52 56 59
8(M)
1 2 3 6 11 12 15 30 33
36 39 56 59 62 65
34 74 81 93 97 98 99
5 9 23 25 39 54 61 63 64
66
The table is organized as follows: each test shown in
Table 1 is indexed on the leftmost column. The
second column from the left gives the most relevant
average features in each upper cell, and the most
relevant standard deviation features in each lower
cell. The rightmost column gives the channel bin
indices from the Glottal Flow Amplitude
Distributions. It must be recalled that rows 1, 2, 3 and
7 refer to male subsets, where 4, 5, 6, and 8 refer to
female subsets. The features which appear more than
once in any of the experiments have been spotted in
bold. The features related with biomechanical
unbalance, perturbation or tremor have been spotted
italicized. In the rightmost column The Glottal Flow
Amplitude Distribution bins repeating in any of the
SERPICO 2020 - Special Session on Mining Self-reported Outcome Measures, Clinical Assessments, and Non-invasive Sensor Data
Towards Facilitating Diagnosis, Longitudinal Monitoring, and Treatment
366

different experiments have been spotted in bold. The
bins corresponding to the first and last quartiles have
been underlined. The review of the relevance features
reveals interesting facts:
• The number of features which repeat themselves
in the different experiments, taking into account
the averages, standard deviations and amplitude
distributions is relatively low:
Averages: 11(2), 14(2), 33(2), 39(4), 42(2), 56(2),
59(3), 62(3), 69(2);
Std. Devs.: 4(2), 5(2), 9(2), 18(2), 23(2), 25(2),
33(2), 59(4), 61(2), 63(3), 64(2), 69(2);
Ampl. Dist: 2, 4, 7 (1Q), 61 (3Q), 90, 93, 95, 97,
98, 99 (4Q).
The feature average repeating most (39, four times
out of six tests) is the vocal fold body losses
unbalance. The second most frequent are 59 (three
times) and 63 (three times), corresponding to the
relative Flow Gap and the relative Contact Gap.
Regarding the feature standard deviations
repeating most are 59 (four times out of six tests)
and 63 (three times), corresponding again to the
relative Flow Gap and the First Cyclical
Coefficient of vocal fold tremor (see c1 given by
expression (7) in Gómez et al., 2013b). Although
the most frequent features are related with
instability and closure defects, they do not appear
in all the tests, therefore, there is not a clear
repetition pattern of features with differentiation
power among the experiments.
• The amplitude distribution bins features which
show some repetition are distributed mainly in
the first quartile (Q1: 2, 4, 7) and mainly the
fourth quartile (Q4: 90, 93, 95, 97, 98, 99); only
a single bin is observed in the middle part of the
distribution (61: Q3); this observation indicates
that the most relevant parts of the distribution
differentiating altered from normative phonation
are the extreme quartiles, as it could be expected
from Figure 3 to Figure 7. Interestingly, feature
69, which corresponds to the amplitude of the
neuromotor tremor in the 4-8 Hz band (see
Mertens et al., 2013) appears twice as feature
average (in 4, test comparing PD vs HC samples
including female average and standard deviation
features, and 7, test comparing PD vs HC and NS
sets including female average, standard deviation
features and amplitude distributions) and as
feature standard deviations (in 1, test comparing
PD vs HC samples including male average and
standard deviation features, and 4, test
comparing PD vs HC samples including female
average and standard deviation features).
The consequence is that feature implication in
classification is not really uniform and depends
strongly on the experiment. This fact raises important
concerns regarding the way that classification
experiments are conducted the way it is generally
established: sets of features fused in supervectors
from databases limited by sample size, not
considering the semantic value of each feature. On the
one hand, it seems that high classification scores can
be achieved using well-known efficient classifiers.
On the other hand, it seems that there is not a clear
semantics on how classification depends on features.
The question is to which extent the overpower of
classification methods and the limited size of
databases are over-expressing the results allowing
good classification accuracy on very specific data, but
where semantic generalization is not well handled.
The burning question would be if seeking for new
features could be done maintain good phenomena-
linked semantics providing high classification scores
at the same time. Feature semantics should be the
main objective to be sought, as it allows the
formulation of new hypotheses based on functional
background. Promoting novel features with a remote
or no clear link with neurophysiological facts will not
allow going any further, no matter how good
classification scores may be. This is a relevant
question to be considered in proposing new features
and classification methods.
5 CONCLUSIONS
The present paper has been conceived to investigate
to two different questions. On the one hand, it is
intended to give an acoustical and physiological
explanation to defects in phonation which may be
induced by organic and neuromotor origin. On the
other hand, it is intended to show that good
classification scores between PD, HC and NS
phonation may be obtained basically fusing
distortion, biomechanical unbalance and tremor
feature averages and their standard deviations with
amplitude distributions obtained from the glottal flow
signal using a standard supervector classifier as an
SVM. The conclusions point out that these features
have differentiation capability, either taken isolated
or fused when differentiating PD vs HC and also
when differentiating PD vs HC and NS. In this last
case the best scores were obtained, with classification
errors under 0.5% (tests 7 and 8). Nevertheless, when
Parkinson’s Disease Glottal Flow Characterization: Phonation Features vs Amplitude Distributions
367

analyzing the semantics of the most frequent features
appearing as responsible of the classification scores,
there is not any feature common to the 8 tests carried
on. This means that classification scores depend more
on the collective power of several features, than on a
feature in particular. As semantics is in the nature of
the features themselves, this consequence casts some
suspicion that classification success is more on the
algorithmic machinery supporting it than on the clear
semantics which can be drawn from the experiments,
producing a certain “miraging” effect which needs to
be examined more in depth. Future lines or work are
being established to explore this paradoxical
controversy.
ACKNOWLEDGEMENTS
This work is being funded by grants TEC2016-
77791-C4-4-R from the Ministry of Economic
Affairs and Competitiveness of Spain,
CENIE_TECA-PARK_55_02 INTERREG V-A
Spain – Portugal (POCTEP), and 16-30805A,
LOl401, and SIX Research Center supported by the
Czech Republic Government. Special thanks are due
to Dra. I. Rektorova from St. Anne’s University
Hospital in Brno for her inspiring comments.
REFERENCES
E. R. Dorsey, et al. (2007). Projected number of people with
Parkinson disease in the most populous nations, 2005
through 2030, Neurology 68(5) 384-386.
W. Dauer and S. Przedborski (2003). Parkinson's disease:
Mechanisms and models Neuron, 39(6) 889–909.
J. Jankovic (2008). Parkinson's disease: clinical features
and diagnosis, J. Neurol. Neurosurg. Psychiatry 79(4),
368–376.
J. S. A. M. Reijnders, et al. (2008). Movement Disorders
23(2) 183-189.
J. Parkinson (1817). An Essay on the Shaking Palsy.
Originally published as a monograph by Sherwood,
Neely and Jones, London. Reproduced in J.
Neuropsychiatry Clin. Neurosci. 14(2), Spring 2002,
223-236.
L. Ricciardi, et al. (2016). Speech and gait in Parkinson’s
disease: When rhythm matters, Park. Relat. Disord. 32
42–47.
L. Brabenec, J. Mekyska, Z. Galaz, I. Rektorova (2017).
Speech disorders in Parkinson's disease: early
diagnostics and effects of medication and brain
stimulation, J. Neural Transm. 124(3) 303–334.
A. Tsanas (2012). Accurate telemonitoring of Parkinson’s
disease symptom severity using nonlinear speech signal
processing and statistical machine learning, PhD.
Thesis, U. of Oxford, U.K.
A. Gómez, D. Palacios, J. M. Ferrández, J. Mekyska, A.
Álvarez, P. Gómez (2019). Evaluating Instability on
Phonation in Parkinson’s Disease and Aging Speech,
Lecture Notes on Computer Science, 11487(2) 340-351.
I. Titze (1994), Principles of Voice Production, Prentice-
Hall, Englewood Cliffs, NJ.
M. Rothenberg, (1973). A new inverse-filtering technique
for deriving the glottal air flow waveform during
voicing, J. Acoust. Soc. Am. 53(6) 1632-1645.
G. Fant, and J. Liljencrants (1985). A four parameter model
of the glottal flow, STL-QPSR, 26(4) 1-13.
S. Mallat (1998). A wavelet tour of signal processing,
Academic Press, San Diego CA.
P. Gómez et al. (2013a). Wavelet description of the Glottal
Gap. 2013 18th International Conference on Digital
Signal Processing (DSP), Fira, Greece, 1-6.
doi: 10.1109/ICDSP.2013.6622718
J. Kreiman (2012). Variability in the relationship among
voice quality, harmonic amplitudes, open quotient, and
glottal area waveform shape in sustained phonation, J.
Acoust. Soc. Am. 132(4) 2625-2632.
P. Gómez et al., (2017). Parkinson's disease monitoring by
biomechanical instability of phonation,
Neurocomputing 255 3-16.
J. Mekyska, et al. (2015). Robust and complex approach of
patohogical speech signal analysis, Neurocomputing
167 94-111.
J. R. Deller, J. G. Proakis and J. H. L. Hansen (1993).
Discrete-Time Processing of Speech Signals,
Macmillan, New York.
P. Gómez et al. (2009). Glottal Source biometrical signature
for voice pathology detection, Speech Communication
51(9) 759-781.
A. R. Webb (2002). Statistical pattern recognition, John
Wiley & Sons, Chichester, UK.
I. Kononenko, E. Šimec, M. Robnik-Šikonja (1997).
Overcoming the Myopia of Inductive Learning
Algorithms with ReliefF. Applied Intelligence 7 39-55.
M. Robnik-Šikonja, I. Kononenko (2003). Theoretical and
empirical analysis of ReliefF and RReliefF. Machine
Learning 53(1–2) 23–69.
A. Gómez, et al. (2019). Evaluating Instability on
Phonation in Parkinson’s Disease and Aging Speech.
IWINAC 2019, LNCS, 11487 340-351.
C. Cortes and V. Vapnik (1995). Support-Vector Networks,
Machine Learning 20 273-297.
C. Chang and C. J. Lin (2011). LIBSVM: a library for
support vector machines, ACM Transactions on
Intelligent Systems and Technology, 2(3) 27:1-27:27.
P. Gómez et al. (2013b). Estimating Tremor in Vocal Fold
Biomechanics for Neurological Disease
Characterization. 2013 18th International Conference
on Digital Signal Processing (DSP), Fira, Greece, 1-6.
doi: 10.1109/ICDSP.2013.6622735.
C. Mertens, J. Schoentgen, F. Grenez, S. Skodda (2013),
“Acoustic Analysis of Vocal Tremor in Parkinson
Speakers”, Proc. of MAVEBA13 (Manfredi, C., Ed.),
Florence University Press, 19-22.
SERPICO 2020 - Special Session on Mining Self-reported Outcome Measures, Clinical Assessments, and Non-invasive Sensor Data
Towards Facilitating Diagnosis, Longitudinal Monitoring, and Treatment
368
