
An Analysis of Students’ Perception towards User Involvement in a
Software Engineering Undergraduate Curriculum
Rafael Chanin
1 a
, Jorge Melegati
2 b
, Mariana Detoni
1 c
, Xiaofeng Wang
2 d
,
Rafael Prikladnicki
1 e
and Afonso Sales
1 f
1
School of Technology, PUCRS, Brazil
2
Faculty of Computer Science, Free University of Bolzano, Italy
Keywords:
Software Engineering Education, User Involvement, Real-world Projects.
Abstract:
Developing soft skills as well as other non-technical issues is essential for a successful career in software en-
gineering. Educators, practitioners and researchers are paying more attention to this matter as they understand
its importance to a software development context. Even the IEEE/ACM software engineering guidelines has
already pointed out the importance of working with real-world projects in order to develop such skills. Being
technically competent is not enough; students should have opportunities to go beyond coding and experience
interactions with real users in order to better prepare themselves for their future. In this sense, this paper
presents a software engineering undergraduate program that connects students with real projects throughout
its curriculum. In order to evaluate whether this program helps students into understanding the importance of
connecting and interacting with real stakeholders, we performed a survey with 111 students from this program.
Our results indicate that providing a structure throughout the program in which students actually work on real
projects is beneficial for their soft skills development.
1 INTRODUCTION
Software engineering is increasingly more dependent
on user involvement. It has been reported that this
fact is more determinant to systems’ success than be-
ing on time and on budget (Bano et al., 2017). More-
over, the lack of user involvement is also connected
to software startups failure (Giardino et al., 2014). In
one of her studies, Shaw (Shaw, 2009) argued that
problems faced by software engineers in the follow-
ing ten years will be more “situated in complex so-
cial contexts, and delineating the problems’ bound-
aries is increasingly difficult”. This fact impacts on
how software engineering should be taught. In 2000,
Shaw (Shaw, 2000) already warned that it was rare for
software engineering students to face non-technical
issues that drive decisions.
a
https://orcid.org/0000-0002-6293-7419
b
https://orcid.org/0000-0003-1303-4173
c
https://orcid.org/0000-0003-3448-1482
d
https://orcid.org/0000-0001-8424-419X
e
https://orcid.org/0000-0003-3351-4916
f
https://orcid.org/0000-0001-6962-3706
The 2015 version of IEEE/ACM curriculum
guidelines (IEEE/ACM Joint Task Force on Comput-
ing Curricula, 2015) states that a software engineer-
ing undergraduate course should have a real-world ba-
sis, including real-world stakeholders and interdisci-
plinary teams. Since 2007, Lethbridge et al. (Leth-
bridge et al., 2007) have already mentioned a sug-
gested approach to distribute “discussions of process
and professionalism issues throughout the curricu-
lum”.
In this study, we present an analysis of students’
perception towards user involvement in a software
engineering undergraduate program with real-world
projects. Throughout four years of the program du-
ration, in several courses, students were allocated in
real-world projects performing roles that evolved ac-
cording to their seniority. We performed a survey with
students in which a scenario with a problem to be
solved was presented. The goal was to verify whether
they understand the need of involving users into the
process.
Their responses were coded and a logistic regres-
sion was performed to verify which characteristics de-
termine students’ responses. Our results point out that
Chanin, R., Melegati, J., Detoni, M., Wang, X., Prikladnicki, R. and Sales, A.
An Analysis of Students’ Perception towards User Involvement in a Software Engineering Undergraduate Curriculum.
DOI: 10.5220/0009188903250332
In Proceedings of the 12th International Conference on Computer Supported Education (CSEDU 2020) - Volume 1, pages 325-332
ISBN: 978-989-758-417-6
Copyright
c
2020 by SCITEPRESS – Science and Technology Publications, Lda. All rights reserved
325

students in the end of the program have almost 4 times
more chance (with 95% of confidence) of focusing on
user involvement than a student in the beginning of
the program.
The remaining of this paper is organized as fol-
lows: Section 2 depicts the related work. In Section 3
we present the initiative carried out in the undergrad-
uate program. Section 4 shows the research method-
ology used, and Section 5 displays the results. Fi-
nally, Section 6 concludes the paper proposing future
works.
2 RELATED WORK
The idea of incorporating real-world project into
computer-related curriculum is not new. In 2002, for
instance, Hayes (Hayes, 2002) presented a software
engineering course that teaches software engineering
related concepts by developing a real-world project
with students. According to the author, this approach
brought several benefits to students, such as the op-
portunity to interact with outside stakeholders. More-
over, the author understands that students learned
more, since they were engaged with the project their
were working on.
Turhan and Bener (Turhan and Bener, 2007) pro-
posed a template to manage real-world projects in
highly populated software engineering classes. One
interesting take away from this study is that students
presented difficulty in mapping the theory with the
practice part of the course. Additionally, TA’s (teacher
assistants) were highly demanded. Students required
several face to face conversation in order to move on
with their projects. This means that having the sup-
port of the teacher only was not enough.
Vanhanen et al. (Vanhanen et al., 2012) also pre-
sented a real-world project development course de-
signed to software engineering students. One interest-
ing aspect is that the instructor provides eight experi-
ence exchange sessions related to several software en-
gineering topics. According to students’ needs, guest
experts from the industry are invited in order to help
them dealing with the issues of the projects. Even
though students consider the course stressful and la-
borious, it is also very rewarding.
Finally, Sun and Liu (Sun and Liu, 2012) de-
picted another course in which students work on real
projects. In this study, authors were more concern in
understanding how students deal with internal aspects
of the project, such as communication, conflict reso-
lution, and managerial tools. Even though projects
were real, there was no information regarding outside
stakeholders.
Despite the fact that most of these stud-
ies somehow mention the participation of real
users/customers, we could not find any evidence nor
even an experiment that attempt to understand how
students perceive user involvement into the software
development process.
3 THE SOFTWARE
ENGINEERING PROGRAM
When the software engineering undergraduate pro-
gram was designed at PUCRS University back in
2013, one of the main goals was to step away from
traditional class models by giving students the op-
portunity to apply their learnings into a realistic set-
ting. In order to do so, stakeholders other than faculty
members had to be involved. Past experience from the
faculty (from teaching in other computer-related un-
dergraduate programs) showed that just by working
on “toy projects” or by creating scenarios that mim-
ics reality were not enough to prepare students for the
challenges they will face once they graduate.
Therefore, the program was designed around a
main track, called The Software Engineering Exper-
imental Agency (SEEA). This laboratory was framed
to be a learning environment in which students would
work on real projects, interacting not only with real
contractors, customers and users, but also with peers
from other semesters, enriching the learning process.
The end result was an 8-semester software engi-
neering program composed by 55 courses, account-
ing for 3,200 hours. Students spend at least 480
hours working directly at the SEEA. As already men-
tioned, all courses were created in order to help stu-
dent achieve theirs goals within the SEEA. For in-
stance, in the software maintenance course, students
learn the concepts related to this topic, such as types
of software maintenance, program comprehension,
and so on, and apply them on projects they are work-
ing on at the SEEA.
3.1 The Software Engineering
Experimental Agency (SEEA)
The SEEA was conceived to be a hands-on learning
environment that:
• allows students to work on real projects, but al-
ways focusing on the learning process;
• integrates all concepts learned throughout the pro-
gram;
CSEDU 2020 - 12th International Conference on Computer Supported Education
326
• connects students with researchers as well as com-
panies or other stakeholders that would be inter-
ested in working together on a software project.
In regards to the methodology and the learning
process, the SEEA main goals are the development
of software engineering competencies (hard and soft
skills), and the focus on the learning process, not at
the end result. That means that outside stakeholders
involved must be aware that a given project might not
be delivered on time. Stakeholders have to realize that
the SEEA is not a software house, but a learning en-
vironment.
All students enrolled in this software engineering
program must go through all four SEEA courses. The
first course, SEEA I, happens in the second semester,
SEEA II in the fourth semester, while SEEA III and
SEEA IV occur in the sixth and seventh semesters,
respectively. Each of these courses accounts for 120
hours. Half of these hours are fixed in the schedule, so
students have time to work with their peers, instruc-
tors and outside stakeholders. The other 60 hours can
be freely accommodated by students with the support
of the SEEA team. The SEEA is open Monday to
Friday from 8 am to 11 pm.
Table 1 presents the four SEEA courses and their
respective focuses. It is important to point out that
even though students might be enrolled in a different
SEEA course, they all work together (classes at the
SEEA are scheduled at the same time). Hence, stu-
dents from different semesters work together in the
same project.
Table 1: SEEA Courses.
Course Semester Focus
SEEA 1 2 Basic programming and unit
testing.
SEEA 2 4 Database, software require-
ments and coding.
SEEA 3 6 Testing and software archi-
tecture.
SEEA 4 7 Project Management.
At the SEEA, there is one coordinator who is re-
sponsible not only to make sure the lab is working
properly, but she is also in charge of project search
and selection. During each semester, the coordinator
negotiates with outside stakeholders in order to ver-
ify which projects will be developed in the follow-
ing term. Projects are selected according to a list of
requirements. The most important one is the com-
mitment of the stakeholder to meet students twice a
month. During these meetings - the sprints reviews
- stakeholders, students, and instructors review the
work done and plan the following sprint.
Each SEEA course can be taught by one or sev-
eral instructors. It all depends on how many students
are enrolled in the course. An instructor can be as-
signed for two groups at a time, and group sizes range
from four to six students. So, for instance, if there are
50 students enrolled in any of the SEEA courses, five
instructors will be working with them.
As already mentioned, all SEEA courses are
scheduled for the same time. Therefore, before the
semester starts, the SEEA coordinator organizes the
teams according to their seniority in the program.
It is also possible to do this in the first day of the
semester, in case instructors understand students may
self organize themselves. Groups are mixed over all
SEEA modules so students can have the opportunity
to work with peers with different background and ex-
periences.
Additionally, an important role was created in or-
der to help students develop their projects: the SEEA
software architect. This person is not only responsible
for keeping projects repository up and running, but he
also supports students during the time they spend at
the lab. He is a senior software engineer hired exclu-
sively to work at the SEEA.
In regards to costs, the most expensive resources
are the software architect and the SEEA coordinator,
since they do not change from one semester to the
other. Instructors are assigned to the courses accord-
ing to the students’ enrolment.
It is worth mentioning that even though each
SEEA course has its own technical content (see Ta-
ble 1), as well as soft skills learning goals, there is no
theoretical content during the semester. There might
be a few sessions with industry experts, but the major-
ity of the classes are focused on working on a given
project, having the support of both the instructor and
the software architect.
In regards to assessment, SEEA courses do not
have written exams. Grades are based on a self eval-
uation, a group evaluation, technical knowledge ac-
quired and soft skills development. Instructors grade
both technical knowledge and soft skills based on a
set of parameters already defined by the SEEA co-
ordinator for each SEEA course. For instance, lets
assume that a given group is formed by two students
from SEEA 1, one student from SEEA 2 and two stu-
dents from SEEA 3. These students will be assessed
according to the learning objectives of the course they
are enrolled on. So, the two students from SEEA 1
will be graded based on their performance as a group,
and also based on their knowledge on basic program-
ming and unit testing. The student from SEEA 2 will
be also be graded based on his/her performance as
a group, but also on his/her knowledge on database,
An Analysis of Students’ Perception towards User Involvement in a Software Engineering Undergraduate Curriculum
327

software requirements and coding. Finally, the two
students from SEEA 3 will be graded based on their
group performance and on their knowledge on testing
and software architecture.
In addition, throughout each SEEA course, stu-
dents have to write down a journal describing in
details all activities that were performed during the
semester, his/her lessons learned, and his/her over-
all satisfaction with the course. After finishing SEEA
4, and all other required courses of the program, stu-
dents need to make an individual final presentation to
an examination board formed by three instructors. In
this presentation, students have to present their path
into the program; and they do so by combining the in-
formation gathered from the four journals developed
along the way.
As an example of the type of projects developed
by students at the SEEA, we will shortly present the
Adopt a Child project, which was aimed at helping
the local government into improving the adoption pro-
cess. The goal was to develop a mobile application,
that would foster adoption of an older child, and also a
web application that would serve as a backend for the
mobile application. The idea is that authorities would
use the web application to update the database as well
as to manage all activities undertaken in the mobile
application. Figure 1 presents one of the screens from
the mobile application in which users could select the
approximate desire age and gender of a child.
Figure 1: Adoption Project.
Once the project was finalized, it was handed over
to the local government, who is now responsible for
the execution and maintenance. At the time of writing
this paper, there was approximately 4,000 downloads
of the application. This is a great example of students
making a great impact in the life of other people. This
is the value of given students the opportunity to work
on real-world projects. It is important to point out
that during one semester different projects can be de-
veloped in parallel by different groups.
4 METHODOLOGY
Our research methodology was based on a quantita-
tive analysis, in which we ran a survey with students
from different levels of the described software engi-
neering program. The goal of running this survey
was to gather the students’ perception about the im-
portance of user involvement in a software project.
The survey was performed following the guidelines
proposed by Wohlin et al. (Wohlin et al., 2012). We
designed an online survey consisted of three sections.
The first section encompasses demographics ques-
tions, as follows:
• Age;
• Semester;
• Gender;
• Employment status;
• If employed, what is the size of your organiza-
tion?
• If employed, what is your role?
Since in Brazil is common to have students work-
ing and studying at the same time, we understood it
was important to collect employment information.
In the second section, we presented a question
describing a small scenario and we asked students
how they could contribute to the development of the
project. The scenario is described as follows:
“An entrepreneur friend of yours comes to you
with a project idea that she had not yet implemented.
She wants to create an app/system that connects dog
owners that want to mate their pets. This person
told you about this project because she would like
to hear your feedback on how to take the next steps
(since you are a software engineering student). What
are your thoughts on this project? What would you
suggest to her?”
The idea behind this approach was to leave the
floor open to students to develop their thoughts freely.
We believed that if we had mentioned explicitly that
we were working on a survey about user involvement
and interaction, students would have been induced to
answer accordingly.
CSEDU 2020 - 12th International Conference on Computer Supported Education
328
We also wanted to investigate if students’ work
experiences outside the program may have influ-
enced their answers, specially their contact with ag-
ile methodologies, which rely on customer interaction
throughout the development process (Ramesh et al.,
2007), and lean startup, that advocates gathering early
and frequent customer feedback (Blank, 2013). Given
that these methods are increasingly used in the indus-
try, students’ contact with them might explain their
concern on user involvement. Therefore, the last set
of questions were designed to gather their own per-
ception on their knowledge on these aspects. Biasing
students can be a problem in a survey, then in order
to mitigate this issue this third section also contained
questions about other topics, such as database, cod-
ing, software maintenance, testing, software architec-
ture, and blockchain. However, we did not take these
information into account. We only cared about their
perception on agile methodologies and lean startup.
This data was collected based on a five-point Likert
scale:
• 0 - I have never heard of this topic;
• 1 - I know the topic, but I have never work with it;
• 2 - I have little experience with this topic;
• 3 - I have some experience with this topic;
• 4 - I have a lot of experience with this topic;
4.1 Data Collection
The survey link was distributed to all lecturers from
the program, and they were asked to run the survey
during their classes. We ended up gathering 111 re-
sponses across all levels of the program.
4.2 Data Analysis
In order to analyze responses, authors read and la-
beled each answer individually and classified them
into one of these categories (codes): personal opin-
ion, development, and user involvement. Table 2
presents examples of responses related to each code.
Table 2: Code Examples.
Code Example
Personal Opinion “It is a bad idea. You should
focus on helping abandoned
dogs.”
Development “I would gather the require-
ments in order to start coding.”
User Involvement “I would talk to dog owners to
verify whether this is a problem
to them.”
Once each of the authors completed their own
classification, they compared the results and agreed
upon a single code for each student answer. This
process was done in order to minimize misinterpreta-
tion and to improve the validity of the classification.
All records classified as “personal opinion” were dis-
carded. We interpreted that these students did not un-
derstand the purpose of the question. Some of them
said, for instance, that they would never support an
application that would connect pets to mate. How-
ever, they would support it if it would help abandoned
dogs to get adopted. Since the point was to focus on
the software engineering aspects of the project, and
not at the idea per se, we decided not to take those
answers into account. Therefore, we ended up with
73 valid records (out of 111). From this sample, 39
students were in the first half of the program (from
the first to the fourth semester) and 34 were in the
second half. Moreover, we classified 40 answers as
“user involvement”, whereas 33 were coded as “de-
velopment”.
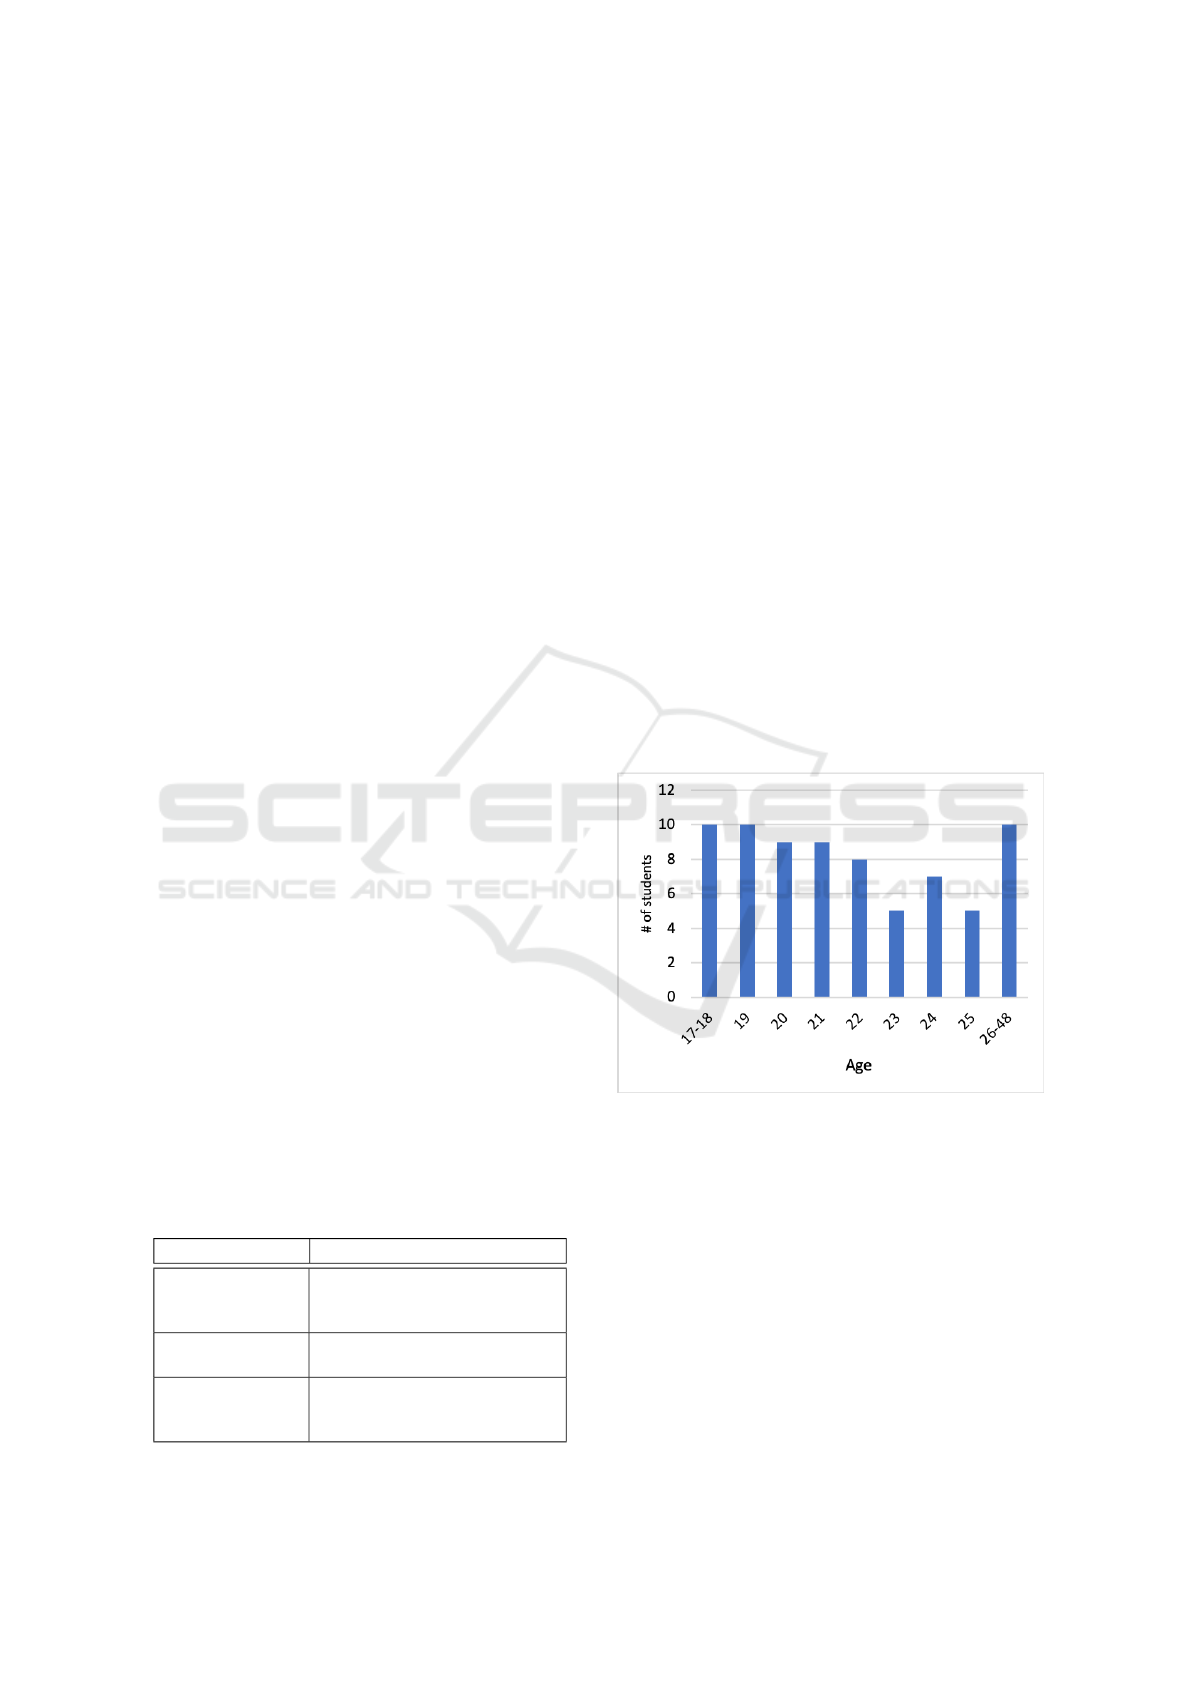
Figure 2 presents the number of students by age.
As expected, most students are young, even though
there are 10 students that are in the 26-48 age range.
Figure 2: Numbers of Students by Age.
Figure 3 presents the students’ perception on their
agile knowledge. As it can be observed, the majority
of students understand they have a very good experi-
ence with agile methodologies. Since agile method-
ologies focus on running short development cycles
and constant user/customer interaction (Ramesh et al.,
2007), it could be expected that those who perceive
themselves as having a lot of experience on this sub-
ject would focus on user involvement in our survey.
However, out of those 12 students, 6 were coded as
“user involvement”, whereas the other 6 were coded
as “development”.
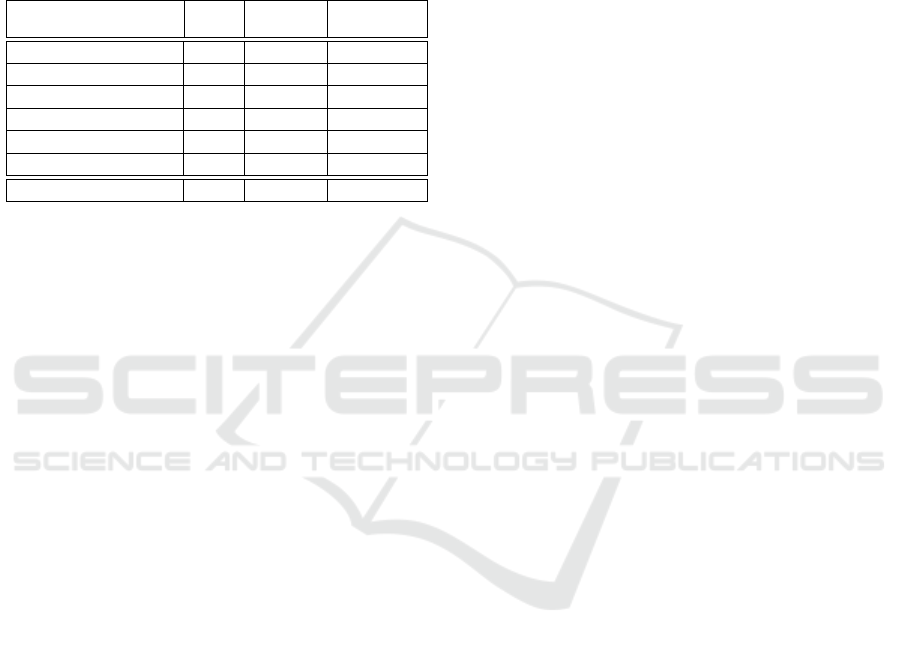
Finally, Figure 4 presents the students’ perception
An Analysis of Students’ Perception towards User Involvement in a Software Engineering Undergraduate Curriculum
329
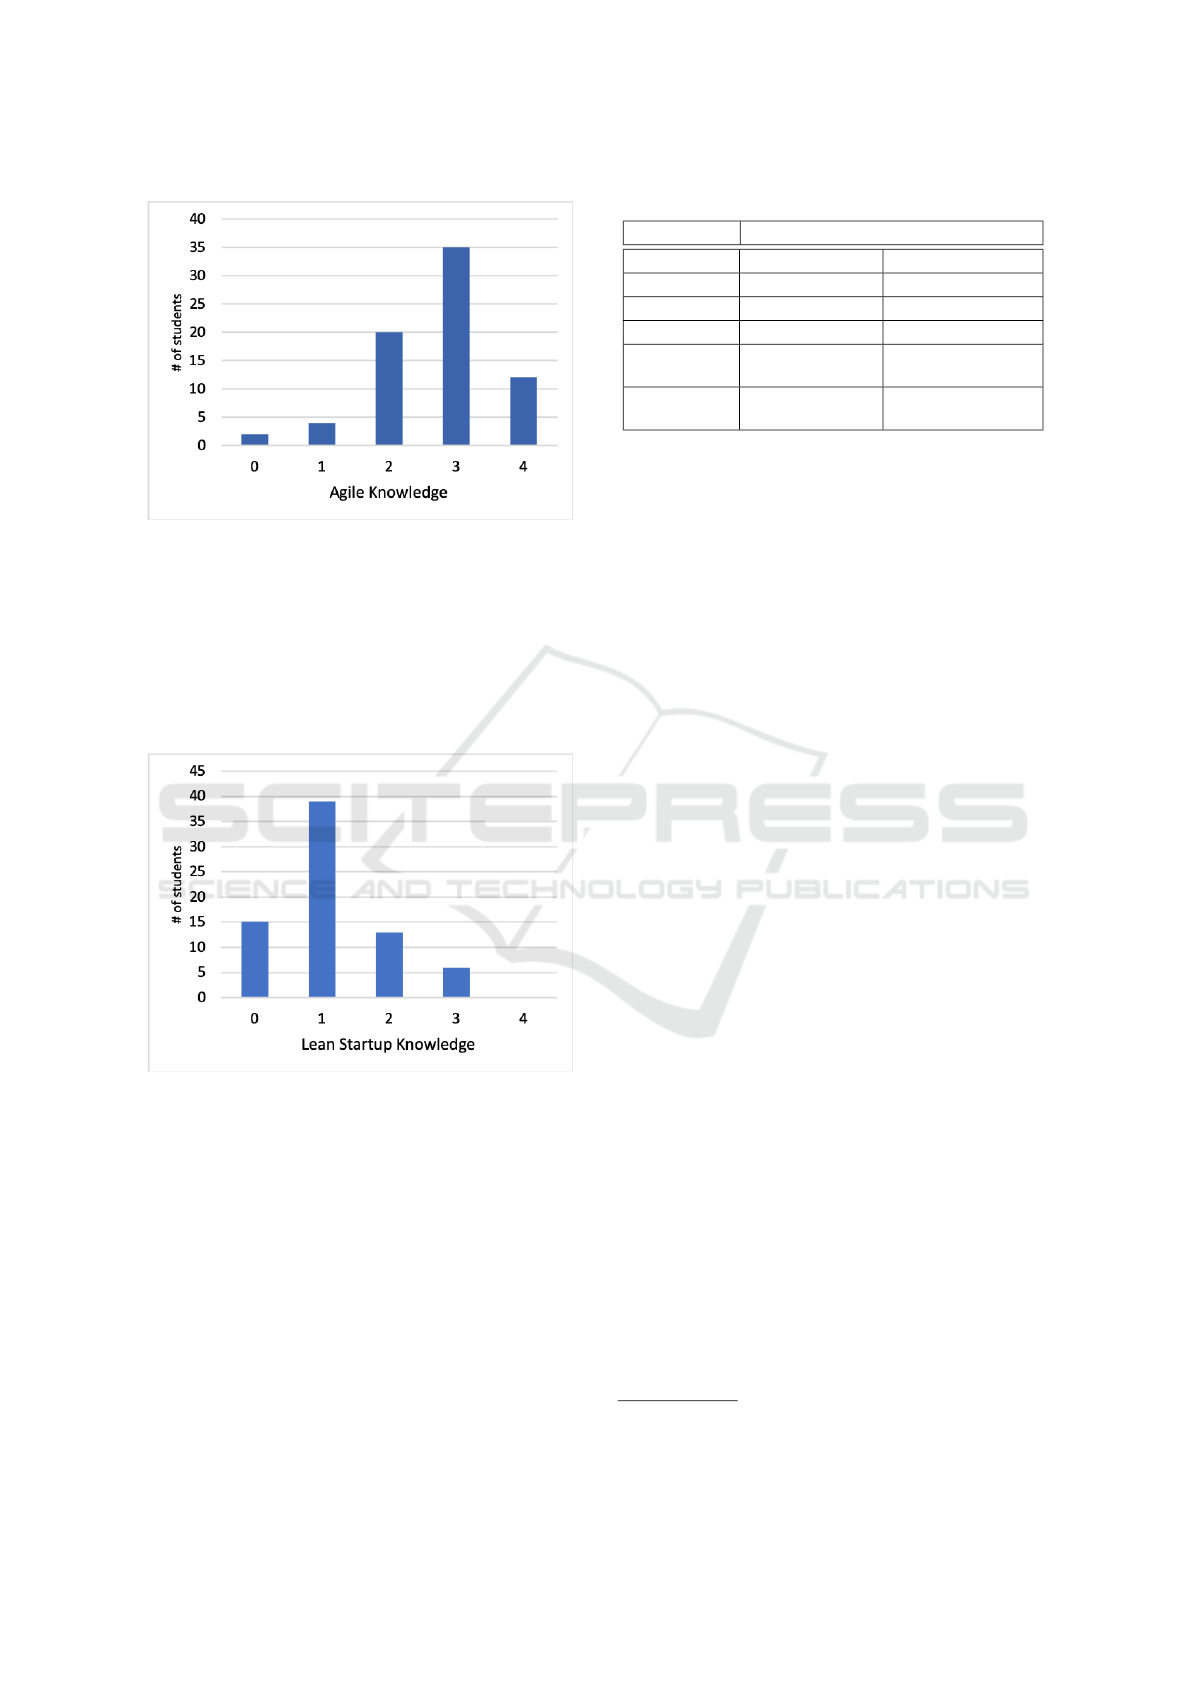
Figure 3: Numbers of Students by Agile Knowledge.
on their lean startup knowledge. In this case, the
majority of students perceive themselves as novice.
Nonetheless, even when we look at the ones who per-
ceived themselves as having some experience in this
topic, once again half of them was coded as “user in-
volvement”, whereas the other half was coded as “de-
velopment”.
Figure 4: Numbers of Students by Lean Startup Knowledge.
Then, in order to verify whether any of collected
information could determine if the students would in-
volve users in the development process, we applied
logistic regression. This approach was chosen since
the outcome is binary (either user involvement or de-
velopment), and also because there is not that many
input variables. Given the sample size, it was not pos-
sible to use the variables as they are. In order to re-
duce the number of possible combinations, for each
variable we created two different categories. Table 3
presents the designed variables and their correspond-
ing categorization.
This categorization was defined and agreed upon
by the authors after several discussions. Some of them
Table 3: Data Categorization.
Variable Categories
Age 6 21 > 21
Semester 1
st
, 2
nd
, 3
rd
, 4
th
5
th
, 6
th
, 7
th
, 8
th
Employed? Yes No
Job position Developer Intern
Agile
Knowledge
Little or no expe-
rience
Some or a lot of ex-
perience
Lean Startup
Knowledge
Little or no expe-
rience
Some or a lot of ex-
perience
were easy to categorize due to their nature. For in-
stance, “employment situation” and “job position” (in
case the student was employed) are binary variables.
Therefore, there was not too much to be done with
them. In regards to students’ agile and lean startup
experience, we decided to work with the ones who
have little or no experience on one side, and the one
with some or a lot of experience in the other side.
In regards to the semester, we understood that it
would be fair to separate the ones that are up to the
4
th
semester, and the ones above that. The rationale
behind this approach is that students in the first half
are taking SEEA I and SEEA II, whereas students in
the second half of the program are taking SEEA III
and SEEA IV. Even though this is not an ideal cate-
gorization, we thought that it could be interesting to
verify whether seniority (in term of the software engi-
neering program) could have an impact on students’
perception on user involvement.
Finally, we categorized age as 21 and younger,
and older than 21. This decision also came after long
discussions. Again, we understand that this is not a
perfect categorization. However, since we needed to
agree upon a binary variable, we understood that we
could check whether older students (due to their ma-
turity) would perceive user involvement more consis-
tently than the younger ones.
We used the SPSS
1
software (version 20) to ver-
ify whether our designed codes - development, and
user involvement could be explained by one or more
reasons. Therefore, we tested all variables described
in Table 3 against our codes with a 95% confidence
level.
5 RESULTS
The logistic regression technique estimates the influ-
ence of a group of predictor variables on the probabil-
ity of a given binary event (in our case, the codes).
1
https://www.ibm.com/analytics/spss-statistics-
software
CSEDU 2020 - 12th International Conference on Computer Supported Education
330
Therefore, we were interested in verifying whether
one or more variables could explain the outcomes
(codes). In this scenario, we tested the variables
against the outcome user involvement. After running
the model, the only variable that presented a statisti-
cally significant result was the semester in which stu-
dents were in the program. Table 4 depicts the sum-
mary of our findings.
Table 4: Logistic Regression Results.
Variable B
Standard
error
Significance
Age -0.212 0.560 0.706
Semester 1.329 0.659 0.044
Employed? 0.372 0.807 0.645
Job position -0.039 0.342 0.909
Agile Knowledge 0.300 0.539 0.579
Lean Startup Knowledge -0.743 0.926 0.423
Constant -1.099 1.707 0.520
The degree of freedom of all variables in our
model is equal to 1. Moreover, we included the inter-
cept (constant of the model) in the logistic equation
for the adjustment of the model. It is important to
point out that all predictor variables are non-collinear
and non-correlated. In addition, there is a linear rela-
tionship between the predictor variables and the out-
comes, residuals’ expected value are zero, and there
is no correlation between residuals and predictors.
Therefore, the logistic regression model was suited
for our analysis.
As it can be observed in Table 4, the result
is statistically significant for the predictor variable
“Semester”, since the p-value (Significance) is 0.044.
Since we have found a statistically significant result,
we can calculate the odds ratio based on the B coeffi-
cient:
e
B
= 2.7183
1.329
= 3.775
This means that students at the end of the program
(from the 5
th
to 8
th
semester) present 3.775 higher
chance of focusing on user involvement than those
students from the first semesters of the program. In
other words, assuming we take a sample of 5 student
from second half of the program, statistically speak-
ing, chances are that 4 of them would focus on user
involvement and only one on development. Similarly,
if we take a sample of 5 students from the first half of
the program, chances are that 4 of them would focus
on development whereas only one on user involve-
ment.
Even when there is no statistical significance, it is
beneficial to include variables that may influence the
output (code) because it helps reduce the error. This is
why we included age, employment, position, and stu-
dents’ knowledge into the model. Notice that all other
predictor variables did not show a statistical correla-
tion with the outcomes. It is possible to wonder that
experience or age could influence the outcome, how-
ever that did not happen in our model. In other words,
the only variable from Table 4 that can explain our
designed codes - user involvement and development -
is the semester.
It is also interesting to remark that our results
are very connected with the intention of the pre-
sented software engineering program. As mentioned
in Section 3, one of the main goals of this new pro-
gram was to give students an opportunity to experi-
ence situations that they will face once they graduate.
Understanding the importance of delivering value to
users/customers is one of them.
Another interesting point is related to students’
knowledge on lean startup. Even though we asked
for their own perception (which can be questionable),
the average for their knowledge on lean startup was
pretty low (1.14 out of 4). Even if we take only the
more experienced students into account (from the 5
th
semester on), the average goes up to just 1.20 out of
4. This means that even though these experienced stu-
dents do not perceive themselves as lean startup ex-
perts, intuitively they tend to focus on user involve-
ment and interaction, which is the basis for working
properly with this methodology.
Finally, if we look at the students’ knowledge on
agile methodologies, we can notice that the overall av-
erage (2.7) do not differ much from the average from
the ones in the beginning of the program (2.64) and
those at the second half of the program (2.75). By
looking at these numbers, it can be concluded that
either this variable in fact do not explain the pro-
posed outcomes, or students’ perception on their own
knowledge does not reflect their actual knowledge.
6 CONCLUSION
We presented in this study an analysis of students’
perception towards user involvement in a software en-
gineering undergraduate program, which gives stu-
dents the opportunity to work in real-world projects
throughout the whole journey. Our analysis is based
on a survey undertaken across students from differ-
ent levels in this program. Our results demonstrated
that “senior” students (i.e., students in the end of the
program) have a bigger probability of taking users’
desires into account when compared to those at the
beginning of the program. It is interesting to remark
that those results substantiate claims that we can find
in the literature, where the fact that students are in
An Analysis of Students’ Perception towards User Involvement in a Software Engineering Undergraduate Curriculum
331

touch with real industry problems during the whole
curriculum can be a way to make courses closer to the
market.
We are aware that our results are still preliminar,
but there is at least an indication that further research
can be performed in order to verify the effectiveness
of incorporating real projects into an educational en-
vironment in a structured manner (such as the one
presented in this study), and not in an isolated course
with no connection with the other pieces of the pro-
gram. As future work, we intend to take the following
steps in order to further explore this research:
• collect more data from the same software engi-
neering program in order to strengthen our find-
ings;
• collect data from other software engineering pro-
grams that also offer a real-world experience to
students;
• collect data from other software engineering pro-
grams that do not offer a real-world experience to
students;
• compare the results in order to verify if our find-
ings hold true.
By running the proposed experiments we will
have more data to support the hypothesis that incor-
porating real-world projects throughout the journey
of the student into the curriculum can foster students
perception on the importance of user’s interaction and
involvement. Therefore, this work could help faculty
members into pursuing a new way of designing pro-
grams, courses and curricula that are more connected
with market needs.
Additionally, the lack of statistical evidence that
students’ agile knowledge increases the probability
of them paying attention to user involvement raises
a warning signal. Given that users’ feedback and in-
teraction is an important aspect of this methodology,
future work could be performed in order to verify
whether students are really capturing these important
concepts.
ACKNOWLEDGEMENTS
This work is partially funded by FAPERGS (17/2551-
0001/205-4). The authors would like to thank the stu-
dents who participated in this study.
REFERENCES
Bano, M., Zowghi, D., and da Rimini, F. (2017). User satis-
faction and system success: an empirical exploration
of user involvement in software development. Empir-
ical Software Engineering, 22(5):2339–2372.
Blank, S. (2013). Why the Lean Start-Up changes every-
thing. Harvard Business Review, 91(5):63–72.
Giardino, C., Wang, X., and Abrahamsson, P. (2014). Why
Early-Stage Software Startups Fail: A Behavioral
Framework. In Lassenius, C. and Smolander, K., ed-
itors, ICSOB 2014. Lecture Notes in Business Infor-
mation Processing, volume 182, pages 27–41, Cham.
Springer International Publishing.
Hayes, J. H. (2002). Energizing software engineering ed-
ucation through real-world projects as experimental
studies. In Proceedings 15th Conference on Software
Engineering Education and Training (CSEET 2002),
pages 192–206. IEEE.
IEEE/ACM Joint Task Force on Computing Curricula
(2015). Software engineering 2014, curriculum guide-
lines for undergraduate degree programs in software
engineering.
Lethbridge, T. C., Diaz-Herrera, J., LeBlanc, R. J., and
Thompson, J. B. (2007). Improving software prac-
tice through education: Challenges and future trends.
Future of Software Engineering (FOSE 07), 2(87):12–
28.
Ramesh, B., Cao, L., and Baskerville, R. (2007). Ag-
ile requirements engineering practices and challenges:
an empirical study. Information Systems Journal,
20(5):449–480.
Shaw, M. (2000). Software engineering education: a
roadmap. In Proceedings of the Conference on the Fu-
ture of Software Engineering - ICSE ’00, pages 371–
380, New York, NY, USA. ACM Press.
Shaw, M. (2009). Continuing prospects for an engineering
discipline of software. IEEE Software, 26(6):64–67.
Sun, Y. and Liu, X. (2012). Educating students by “real-
world” software engineering practice - Designing
software engineering practice course. In 7th Interna-
tional Conference on Computer Science & Education
(ICCSE), pages 1356–1359. IEEE.
Turhan, B. and Bener, A. (2007). A template for real world
team projects for highly populated software engineer-
ing classes. In Proceedings of the 29th International
Conference on Software Engineering, pages 748–753.
IEEE Computer Society.
Vanhanen, J., Lehtinen, T., and Lassenius, C. (2012).
Teaching real-world software engineering through a
capstone project course with industrial customers.
In Proceedings of the First International Workshop
on Software Engineering Education Based on Real-
World Experiences, pages 29–32. IEEE Press.
Wohlin, C., Runeson, P., H
¨
ost, M., Ohlsson, M. C., Reg-
nell, B., and Wessl
´
en, A. (2012). Experimentation in
Software Engineering. Springer Science & Business
Media.
CSEDU 2020 - 12th International Conference on Computer Supported Education
332
