
Detailed Classification of Meal-related Activities from Eating Sound
Collected in Free Living Conditions
Archit Jain
1
, Takumi Kondo
2
, Haruka Kamachi
2
, Anna Yokokubo
2
and Guillaume Lopez
2
1
University Jean Monnet, Saint-Etienne, France
2
Aoyama Gakuin University, Tokyo, Japan
Keywords:
Eating Quantification, Chewing, Swallowing, Sound Analysis, Activity Recognition, Free-living Conditions.
Abstract:
Increasing the number of chews of each bite episode of a meal can help reduce obesity. Nevertheless, it
is difficult for a person to keep track of his mastication rate without the help of an automatic mastication
counting device. Such devices do exist, but they are big and non-portable and are not suitable for daily use. In
our previous work, we proposed an optimization model for the classification of three meal-related activities,
chewing, swallowing, and speaking activities from sound signals collected in free-living conditions with a
cheap bone conduction microphone. To extract the number of chews per bite, it is necessary to differentiate
the swallowing of food from the swallowing of drink. In this paper, we propose a new model that can not only
classify speaking, chewing, and swallowing, but also differentiate whether swallowing is for food or drink,
with an average accuracy of 96%.
1 INTRODUCTION
Obesity may cause lifestyle diseases such as diabetes
and heart disease. The Japanese Ministry of Health,
Labor and Welfare has taken measures for this pre-
vention, but the number of obese patients has not de-
creased compared to 10 years ago (MHLW, 2016).
Improving one’s meal content and exercises are con-
ventional methods for fighting against obesity. How-
ever, many people overlook the impact of change in
how and not only in what a person eats as an alterna-
tive method for fighting against obesity. For example,
Kishida et al. have reported that making conversation
during meals is related to good health (Kishida and
Kamimura, 1993). Besides, an optimum mastication
rate can significantly help in reducing obesity (Nick-
las et al., 2001). Indeed, chewing repetition stimu-
lates the satiety center and sympathetic nervous sys-
tem, which can reduce obesity by secreting hormones
that suppress appetite (Kao, 2007). Moreover, Den-
ney et al. reported in 2008 that people with fast-eating
have higher tendency to be obese, which is partly be-
cause lowering secretion of hormones by eating fast
causes an increase in dietary amount (Denney-Wilson
and Campbell, 2008).
Improvement in the mastication amount is also
crucial since healthcare experts always check the
number of chewing as well as meal duration and food
type as an indispensable factor in assessing dietary
habits. As a concrete example, when attempting to
improve mastication activity for young Chinese men
with obesity, Li et al. showed it was possible to reduce
the intake of energy in all the subjects consistently
(Li et al., 2011). Though chewing and swallowing
processes depend on many factors both human and
food property dependants (Logemann, 2014), recent
research suggests that self-quantification is strongly
associated with the will to optimize or improve own’s
performance or behavior(Ruckenstein and Pantzar,
2017).
Our research aims at proposing a system that can
support consciousness improvement of good eating
practices by accurate quantification of meal-related
activities for monitoring purpose and persuasive feed-
back in real-time. It is composed of a cheap and
small bone conduction microphone to collect intra-
body sounds signal, and a smartphone that can pro-
cess on-board the acoustic signal. From the pro-
cessed signal, the system enables whether to provide
feedback in real-time for behavior consciousness im-
provement or to transfer data to some online computa-
tion and storage resource for detailed monitoring pur-
pose(Lopez et al., 2019). In the realization of this sys-
tem, it is necessary to provide an accurate and detailed
classification method of meal-related activities from
intra-body sound signal collected in free-living envi-
284
Jain, A., Kondo, T., Kamachi, H., Yokokubo, A. and Lopez, G.
Detailed Classification of Meal-related Activities from Eating Sound Collected in Free Living Conditions.
DOI: 10.5220/0009187502840291
In Proceedings of the 13th International Joint Conference on Biomedical Engineering Systems and Technologies (BIOSTEC 2020) - Volume 5: HEALTHINF, pages 284-291
ISBN: 978-989-758-398-8; ISSN: 2184-4305
Copyright
c
2022 by SCITEPRESS – Science and Technology Publications, Lda. All rights reserved

ronment conditions. In this paper, we propose and
evaluate a classification model that can differentiate
not only speaking, chewing, and swallowing activi-
ties, but also swallowing food or drink.
2 STATE-OF-THE-ART
More than a decade ago, studies have been focus-
ing on chewing as an improvement of dietary habits,
mainly evaluating various methods and devices to
quantify mastication activity with little burden (Ko-
hyama et al., 2003; Amft et al., 2005). They proposed
to use mainly devices that measure myoelectric poten-
tial from the masseter muscle can count bites. How-
ever, wearing the apparatus in daily life is a significant
burden for the user. Obata et al. proposed the use of
an infrared sensor to detect small changes in tempo-
ral muscle tension, but still, sensing medium and ap-
paratus appearance bother users during meals (Obata
et al., 2002). The strategy consisting in measuring di-
rectly jaw movements has been extensively studied.
Tanigawa et al. explored the use of the Doppler effect
in their system to sense the Doppler signal of masti-
cation produced from vertical jaw movements (Tani-
gawa et al., 2008). However, their solution required
some individual calibration, which is not convenient
for general use. A recent work proposed to combine
accelerometer and range sensing, implemented into a
lightweight instrumented necklace that captures head
and jawbone movements without direct contact with
the skin (Keum et al., 2018). However, they could
only detect accurately eating episodes (start and end),
and their performances dropped in free-living condi-
tions. As a summary, in all these methods wearing
the apparatus in daily life is a significant burden for
the user.
On the other hand, analysis of internal body
sounds spectra has attracted attention as a way to dif-
ferentiate between chewing and speaking activities,
and to classify several types of food with less bur-
den (Amft et al., 2005; Mizuno et al., 2007; Shuzo
et al., 2010; Zhang et al., 2011). Indeed, Fontana et
al. have shown earlier that even a strain sensor to de-
tect chewing events and a throat microphone to de-
tect swallowing sounds present enough comfort lev-
els, such the presence of the sensors does not affect
the meal (Fontana and Sazonov, 2013). Nishimura
et al.(Nishimura and Kuroda, 2008) and Faudot et al.
(Faudot et al., 2010) proposed to measure the chewing
frequency using a wireless and wearable in-ear mi-
crophone. However, to estimate the number of chew-
ing operations, still, some parameters need to be ad-
justed by the user each time, which is a severe con-
straint in practical use. Similarly, using bone con-
duction microphones(Uno et al., 2010). Paying atten-
tion to the amplitude during chewing, it is a system
that judges chewing when amplitude magnitude ex-
ceeds a certain level, and the judgment accuracy was
about 89%. However, activity discrimination method
is limited to specific ailments, and evaluation in lab-
oratory environment. Recently, Bi et al.(Bi et al.,
2018) and Zhang et al. (Zhang and Amft, 2018)de-
veloped a wearable device that can automatically rec-
ognize eating behavior in free-living conditions using
an off-the-shelf contact microphone placed behind the
ear. Though both achieved accuracy exceeding 90%
for eating event detection, the accuracy of specific
meal-related activities such as the number of chewing
or swallowing is whether not assessed or decreasing
consistently in free-living conditions.
As summed-up above, despite numerous efforts
by researchers over the last decade, an objective and
usable method for detailed tracking of dietary intake
behavior in natural meal environment remains unreal-
ized, and there is still room for improvement in judg-
ing detailed meal-related activities such as mastica-
tion amount per bite, utterance duration, and intake
content. In our previous work, we proposed a clas-
sification model of chewing, swallowing, and speak-
ing activities from bone conduction sound collected in
natural meal environment(Kondo et al., 2019b). The
three activities could be classified with high accuracy,
since the precision, recall, and F1 value all exceeded
95%. However, the proposed model was still defi-
cient since it did not take into account other noisy
sounds. Hence, in this paper, we added noisy sounds
collected in natural meal environment to our dataset
and evaluated the performance of the proposed model
for classifying chewing, swallowing, speaking, and
other noisy sounds.
3 COLLECTION OF DAILY
MEAL SOUND
3.1 Experimental Conditions
To discriminate mastication, swallowing, and utter-
ance from sound collected in a natural eating environ-
ment, eating sound data collection was carried out in
a free-living meal environment. For example, some
data were collected in a dining room and a standard
household table with other family members, or at
the university cafeteria with friends, such we can as-
sume that represents different noisy conditions. The
meal content was also totally free, and participants ate
Detailed Classification of Meal-related Activities from Eating Sound Collected in Free Living Conditions
285
whatever they wanted as usual in daily life, such var-
ious food types were mixed unpredictably during the
same meal.
To collect dietary sound data, we used a com-
mercial bone conduction microphone (Motorola Finiti
HZ800 Bluetooth Headset, Motorola co. Ltd.), at-
tached to one ear of the subject, that can operate
Bluetooth communication with a smartphone (Google
Pixel 3, Google co. Ltd.) and collected dietary
voice data using a dedicated Android OS application.
The sound signal sampling from the microphone was
8KHz. After collection, data were transferred to a
computer for labeling and analysis. Besides, since
data were collected in a totally free environment, it
was necessary to perform labelling afterwards. To la-
bel sound segments after collecting the data, a video
was taken together with sound data to assist the la-
beling work. The video shooting was performed so
that the mouth and throat of the subject were reflected.
Figure 1 shows a picture of the data collection condi-
tions (for privacy, it is a photograph that reproduces
the actual environment).
Figure 1: Picture reproducing the data collection condi-
tions.
3.2 Collected Data Labelling
From the collected data it was necessary to extract the
activity values associated with each data set. For that
purpose the collected sound data were labeled in sec-
tions corresponding to one of the targeted three ac-
tivities. To obtain the best labeling accuracy as pos-
sible, recorded video were synchronized with audio
data and both were used as references (see figure 3).
Though audio and video could be recorded on a sin-
gle smartphone, two smartphones were used to ensure
data collection without recording troubles. Labeling
of audio data was done using “Praat,” which is a soft-
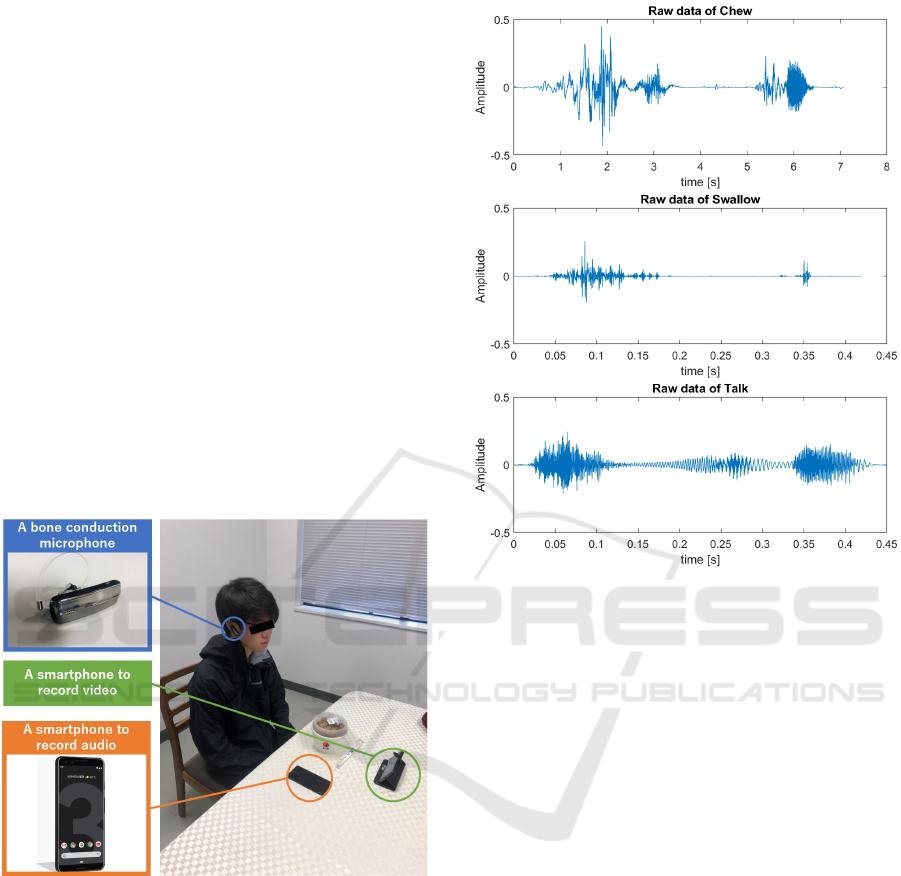
Figure 2: Example of raw sound data during respectively,
from the top to the bottom, a chew, a swallow, and an utter-
ance.
ware frequently used for speech analysis (Boersma,
2001). Labels were set to: “chewing (C),” “swallow-
ing (S),” and “talking (T)” (see figure 4).
Data were collected from 6 Japanese men and
women (three each) from 11 to 23 years old, for a total
of 10 meals, five different meals for subject 1, and one
meal for each of the other eight subjects. In our previ-
ous work, we labeled each sound data sequence corre-
sponding to a single chew, swallow, or speaking event
(Kondo et al., 2019b). In this work, we increased the
number of data samples, and divided swallowing la-
bel into ”food swallowing” and ”drink swallowing”.
Differentiation of food and drink is a key issue to sep-
arate different bites and enable further detailed eating
habit quantification.
Following the above described procedures we
could prepare a dataset that details are described in
Table 1. Though the number of subjects looks too
small, the dataset represents 79 minutes of eating
sound segments from unconstrained meal of various
types of food, resulting in 1706 chewing samples, 99
food swallowing samples, 29 drink swallowing sam-
ples, and 424 utterance samples. Such, we consider
the dataset is sufficient for subject independent activ-
ities classification.
HEALTHINF 2020 - 13th International Conference on Health Informatics
286
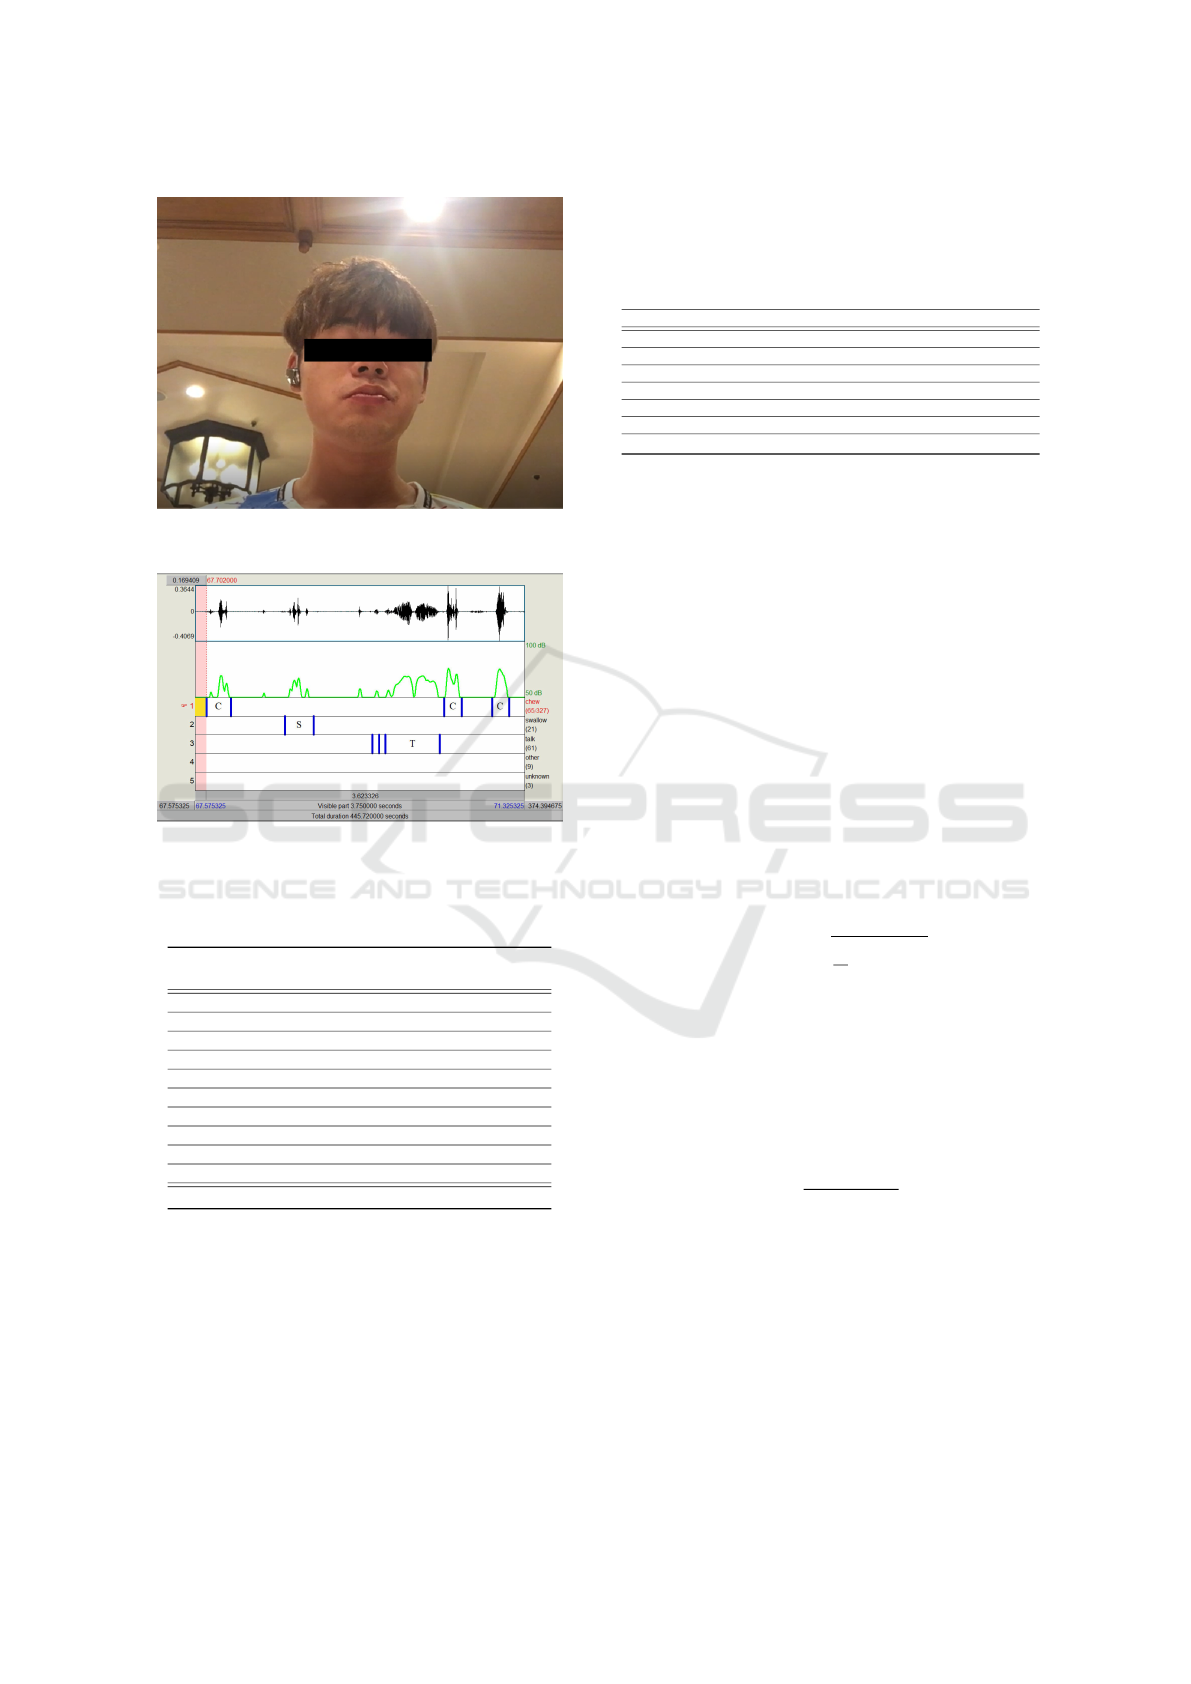
Figure 3: Example shot of the video data.
Figure 4: Screeenshot of the labeling work screen using
“Praat” ((Boersma, 2001)).
Table 1: Detail of the amount of labels and data sections
extracted for each meal related activity type.
Meal
Nb of Nb of Nb of Nb of Total meal
chew utterance drink food time [min]
1 156 73 5 14 18:12
2 181 39 0 10 7:26
3 502 10 6 8 12:07
4 209 65 0 8 8:21
5 86 63 14 14 5:43
6 109 44 0 7 3:17
7 157 50 0 21 10:07
8 102 0 0 6 4:28
9 157 70 4 7 5:33
10 89 10 0 4 3:53
Total 1706 424 29 99 79:07
4 MEAL-TIME ACTIVITIES
CLASSIFICATION
4.1 Features Extraction
Features extraction has been performed from the
dataset labeled according to the previous section be-
fore operating machine learning models for meal-
related activities classification. A total of 26 features
as described in Table 2 were extracted.
Table 2: Outline description of extracted 26 features.
Description Number of features
Mean of Chroma vector 1
Root mean square energy 1
Spectral centroid 1
Spectral bandwidth 1
Spectral roll off 1
Zero crossing rate 1
Mel-Frequency cepstral Coefficients (MFCCs) 20
4.1.1 Chroma Vector
A chroma vector is a typically a 12-element feature
vector indicating how much energy of each pitch class
C, C#, D, D#, E, F, F#, G, G#, A, A#, B is present in
the signal. One main property of chroma features is
that they capture harmonic and melodic characteris-
tics of music, while being robust to changes in tim-
bre and instrumentation. It is also used for audio-
matching making it a useful feature.
4.1.2 Root Mean Square Energy (RMSE)
The energy of a signal corresponds to the total mag-
nitude of the signal. For audio signals, that roughly
corresponds to how loud the signal is. The root mean
square energy (RMSE) of a signal segment s contain-
ing N samples is defined as the square root of the av-
erage of the sum of all samples n (see equation 1).
RMSE =
s
1
N
∑
N
|s(n)|
2
(1)
4.1.3 Spectral Centroid
The spectral centroid indicates at which frequency the
energy of a spectrum is centered upon, or in other
terms it indicates where the centre of mass of the spec-
trum is located (see equation 2).
f
c
=
∑
k
S(k) f (k)
∑
kS(k)
(2)
This is like a weighted mean where S(k) is the spectral
magnitude at frequency bin k, f(k) is the frequency at
bin k.
4.1.4 Spectral Bandwidth
It computes the order-p spectral bandwidth as in equa-
tion 3
f
b
=
∑
k
S(k)( f (k) − f
c
)
p
(
1/p) (3)
Detailed Classification of Meal-related Activities from Eating Sound Collected in Free Living Conditions
287
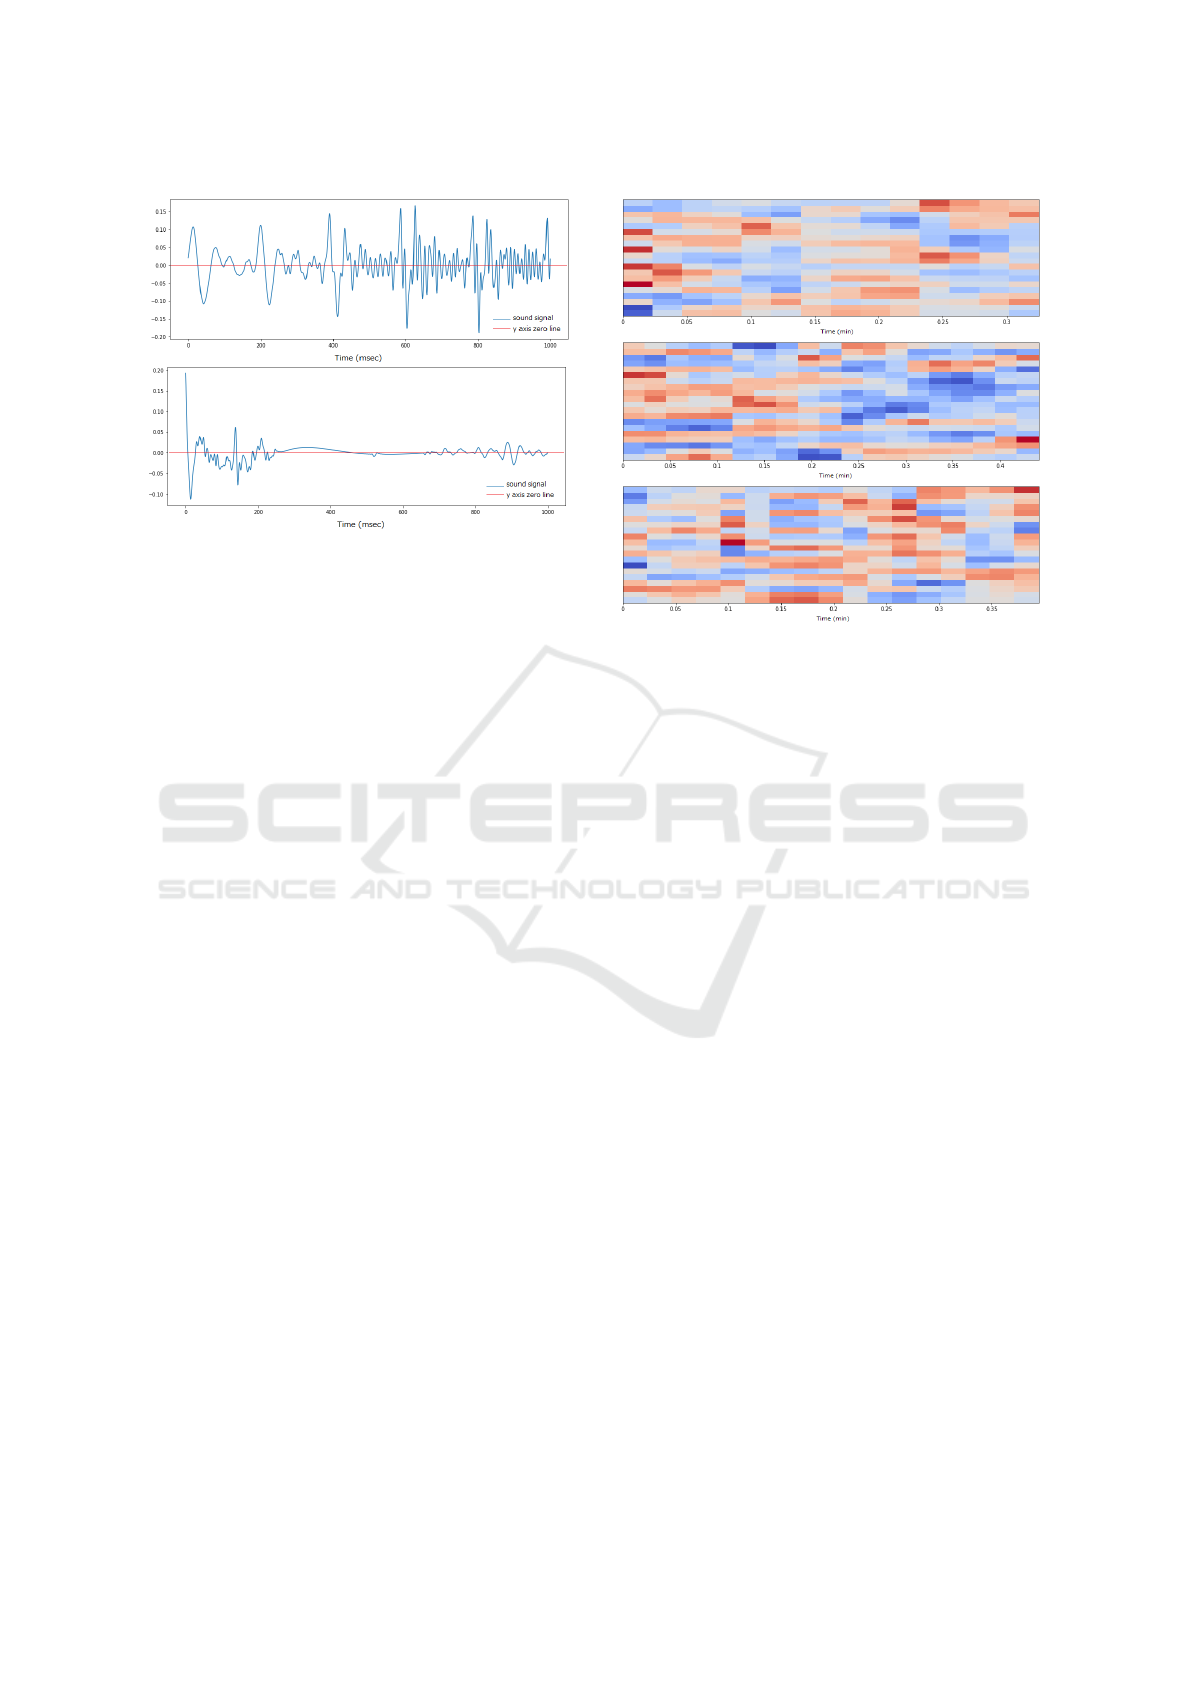
Figure 5: Comparison of sound signal zero crossing be-
tween speaking (top) and swallowing (bottom).
where S(k) is the spectral magnitude at frequency
bin k, f(k) is the frequency at bin k, and is the spectral
centroid. When p =2, this is like a weighted standard
deviation.
4.1.5 Spectral Roll-off
Spectral roll-off is the frequency below which a spec-
ified percentage of the total spectral energy, e.g. 85%,
lies.
4.1.6 Zero Crossing Rate
Zero crossing rate (ZCR) indicates the number of
times that a signal crosses the horizontal axis. This
is a key feature for percussive sounds and hence used
for distinguishing whether human voice is present in
audio or not. 6.1 First of all lets import a sound file
of talk. With ‘time (sec)’ on x axis and amplitude on
y 6.3 Now lets import some other file like swallow,
time (sec) on x-axis and amplitude on y. So it can be
concluded that ZCR is a strong feature in recognis-
ing human voice (or more percus-sion) in an audio, as
its obvious from the plots the talk has more crossing
rates
4.1.7 Mel Frequency Cepstral Coefficients
(MFCCs)
The most famous and used features for speech recog-
nition are MFCCs, they are even used in speech
recognition, and also because of them being powerful
they are even used in convolutional neural networks
as pictures, for classifying further. Here, 20 orders of
MFCC are used in for features (Figure 6).
Figure 6: Different results of MFCC coefficients extraction
whether audio signal corresponds to swallowing drink (top),
swallowing food (middle), or chewing (bottom). The verti-
cal axis represents the MFCC coefficient order and the color
represents the value of each coefficient (red: small to blue;
big).
4.2 Balancing Unbalanced Datasets
As previously show in Table 1, the obtained dataset
have a huge number of “chewing” labeled data, and an
only minimal number of other labels data to compare.
Therefore, to equilibrate this unbalanced dataset,
we applied SMOTE (Synthetic Minority Oversam-
pling Technique), a library often used in imbalanced-
learning tasks [28]. Simple replication of less repre-
sentative classes samples would result in over-training
and so over-learning. SMOTE, by creating a new
specimen using neighbourhood interpolated data, en-
ables to avoid this bias. However, even after applying
the conventional SMOTE, the results were still over-
learning, because of interpolation technique used by
traditional SMOTE. So, further ahead we tried differ-
ent SMOTE technique, SVM-SMOTE, as it was using
the SVM technique (maximizing the mar-gins) for in-
terpolating the data. The entire scenario can be de-
picted below.
We obtained a dataset with the different number
of samples for each activity label as shown in Table 3
using SVM-SMOTE. The obtained balanced dataset
was divided randomly for each label into training data
(80%) and test data (20%).
HEALTHINF 2020 - 13th International Conference on Health Informatics
288
Table 3: Number of data segments for each activity label
after applying SVM-SMOTE and their distribution between
train and test datasets.
Label name Total Train Test
chew 1680 1344 336
swallow food 1705 1364 341
swallow drink 1090 872 218
talk 1675 1340 335
Table 4: Classification accuracies by different models (after
tuning them).
Classification models Accuracy (%)
Decision tree
Fine tree 85.1
Coarse tree 71.4
Support Vector Machine
Linear SVM 86
Gaussian 96.7
Nearest neighbour KNN 82.2
4.3 Classifier Selection
Finally, we performed classification of meal related
activities using various supervised learning. Auto-
matic machine learning and validation using a five-
fold cross-validation method was per-formed to eval-
uate the average performance of the classifiers. A to-
tal of 5 classification models have been built based
on the following four classifiers: Decision Tree (DT),
Support Vector Machine (SVM), and Nearest Neigh-
bours classifier (KNN). The average accuracy of each
output model is shown in Table 4. Although Fine
tree and linear SVM were able to achieve accuracy
of 85.1% and 86.2%, the best result was obtained for
the medium Gaussian SVM (rbf kernel) with 96.7%)
average accuracy.
5 OPTIMIZATION OF SELECTED
MODEL AND VALIDATION
WITH TEST DATA
The purpose of the evaluation is to propose a clas-
sification method of chewing, swallowing, drinking
and utterance (talk) in natural meal environment,
from sound data collected by a bone-conduction mi-
crophone, that is not only highly accurate but also
lightweight enough to have the possibility to run real-
time a smartphone. Such, we performed both features
selection and optimization of SVM parameters.
Among the 26 features used, we assumed some
features are highly related to the classification model
performances. To reduce the number of features to an
easier to handle amount, we reduced the features to
just 15, combining Zero crossing rate and a subset of
MFCCs.
We used “grid search” method to optimize SVM
parameters “C” and “Gamma”. Six different val-
ues were tested for each parameter using a five-folds
cross-validation. The best model optimization was
obtained with the parameters being 10 for “C” and 0.1
for “Gamma.” Finally, the optimized model was vali-
dated with the test dataset (20% of the whole dataset
that were not used for training). A very high general-
ization accuracy of 96% was obtained (Table 5). This
is almost identical as training accurate when using all
26 features (97.6%).
Table 5: Score from the rbf model.
Label Precision Recall F1-score Support
Chew 0.96 0.9 0.93 336
Swallow food 0.99 0.99 0.99 215
Swallow drink 0.93 0.98 0.95 346
Talk 0.98 0.98 0.98 333
Macro avg 0.96 0.96 0.96 0.96
6 CONCLUSIONS AND FUTURE
WORKS
In this study, we proposed a classification method
of chewing, swallowing food, swallowing drink, and
speaking activities using bone conduction sound cor-
responding to natural diet environment. We classi-
fied chewing, swallowing, and speaking activities by
SVM using Gaussian kernel. 26 features were ex-
tracted and reduced feature set after feature selec-
tion also investigated. Generalization performance
of optimized model using only the top 15 features
confirmed its high accuracy, since the precision, re-
call, and F1 value all exceeded 90% both at macro
level and for each activity. These results outper-
form other works performances, whatever the sens-
ing modality. Indeed, the recent study by Keum et
al., based on a multimodal sensing strategy combin-
ing accelerometer and range sensing, could only de-
tect eating episodes (start and end) with less than
80% accuracy in free-living conditions (Keum et al.,
2018). Similarly, Uno et al., who analyzed sound col-
lected from a bone-conduction microphone, could de-
tect only chewing events with an accuracy of about
89% but in controlled conditions only (Uno et al.,
2010). Zhang et al. (Zhang et al., 2011) can detect
eating, drinking, and speaking with 96% accuracy,
but still, their work is limited to controlled conditions.
On the other hand, works with free-living conditions,
Detailed Classification of Meal-related Activities from Eating Sound Collected in Free Living Conditions
289

though being able to recognize eating behavior with
accuracy exceeding 90% automatically, cannot assess
specific meal-related activities such as the number of
chewing, drinking, or swallowing as our method does
(Bi et al., 2018; Zhang and Amft, 2018).
Further validation of the proposed classification
method may be validated further by comparing with
more types of classifier such as neural networks,
Bayesian models, and random forest. Indeed, SVM
requires normalization to deal correctly with individ-
ual differences, which may be an issue to guarantee
reliability to new users. Moreover, real-time perfor-
mances when running the model on a smartphone,
for example, should be verified. Finally, the robust-
ness of the model generalization to other types of eat-
ing sounds should be verified. For example, the level
of environmental noise from the smartphone record-
ing may affect classification capability, though in our
former study we shown that noise (tongue mixing
the food, etc.) could be accurately classified (Kondo
et al., 2019a).
As a prospect, we plan to use the proposed clas-
sification model to classify mastication, swallowing
food, swallowing drink, and utterance in real time
using bone conduction microphone and smartphone.
In realizing this, it is necessary to design a system
that automatically extracts sound data segments that
can be considered to be whether chewing, swallow-
ing, drinking or utterance in real-time. Besides, it is
also necessary to add the other sounds such as noises
in the model so that it is more robust to natural meal
environment.
ACKNOWLEDGEMENTS
This research was supported by Lotte Research Pro-
motion Grant. Entire experimental protocols were ap-
proved by the ethics committee of Aoyama Gakuin
University.
REFERENCES
Amft, O., St
¨
ager, M., Lukowicz, P., and Tr
¨
oster, G. (2005).
Analysis of chewing sounds for dietary monitoring. In
UbiComp 2005, 7th Int. Conf. on Ubiquitous Comput-
ing, pages 52–72.
Bi, S., Wang, T., Tobias, N., Nordrum, J., Wang, S.,
Halvorsen, G., Sen, S., Peterson, R., Odame, K.,
Caine, K., et al. (2018). Auracle: Detecting eating
episodes with an ear-mounted sensor. Proceedings of
the ACM on Interact., Mob., Wearable and Ubiquitous
Technol., 2(3):1–27.
Boersma, P. (2001). Praat, a system for doing phonetics by
computer. Glot International, 5(9/10):341–345.
Denney-Wilson, E. and Campbell, K. J. (2008). Eating be-
haviour and obesity. BMJ, 337:73–75.
Faudot, T., Lopez, G., and Yamada, I. (2010). Information
system for mapping wearable sensors into healthcare
services: Application to dietary habits monitoring. In
WIVE 2010, 2nd International Workshop on Web In-
tellgence and Virtual Enterprises, pages 1–9.
Fontana, J. and Sazonov, E. (2013). Evaluation of chew-
ing and swallowing sensors for monitoring ingestive
behavior. Sensor letters, 11(3):560–565.
Kao (2007). The effect of chewing well, tasting and eating -
preventive measures against metabolic syndrome and
obesity. In Kao Health Care Report, number 19, pages
4–5. (in Japanese).
Keum, S. C., Sarnab, B., and Edison, T. (2018). Detecting
eating episodes by tracking jawbone movements with
a non-contact wearable sensor. Proc. ACM Interact.
Mob. Wearable Ubiquitous Technol., 2(1):1–21.
Kishida, N. and Kamimura, Y. (1993). Relationship of con-
versation during meal and health and dietary life of
school children. The Japanese Journal of Nutririon
and Dietetics, 51(1):23–30.
Kohyama, K., Mioche, L., and Bourdio, P. (2003). Influence
of age and dental status on chewing behavior stud-
ied by emg recordings during consumption of various
food samples. Gerontology, 20(1):15–23.
Kondo, T., Haruka, K., Shun, I., Yokokubo, A., and
Lopez, G. (2019a). Robust classification of eating
sound collected in natural meal environment. In Ubi-
Comp/ISWC ’19, pages 105–108.
Kondo, T., Shiro, H., Yokokubo, A., and Lopez, G. (2019b).
Optimized classification model for efficient recogni-
tion of meal-related activities in daily life meal envi-
ronment. In 3rd IVPR, pages 146–151.
Li, J., Zhang, N., Hu, L., Ki, Z., Li, R., Li, C., and Wang,
S. (2011). Improvement in chewing activity reduces
energy intake in one meal and modulates plasma gut
hormone concentrations in obese and lean young chi-
nese men. American Journal of Clinical Nutrition,
94(3):709–716.
Logemann, J. (2014). Critical factors in the oral control
needed for chewing and swallowing. Journal of tex-
ture studies, 45(3):173–179.
Lopez, G., Mitsui, H., Ohara, J., and Yokokubo, A. (2019).
Effect of feedback medium for real-time awareness in-
crease using wearable sensors. In HEALTHINF 2019.
MHLW (2016). The national health and nutrition survey
in japan, 2014. Japan Ministry of Health Labor and
Welfare. (in Japanese).
Mizuno, H., Nagai, H., Sasaki, K., Hosaka, H., Sugimoto,
C., and Tatsuta, S. (2007). Wearable sensor sys-
tem for human behavior recognition -first report: Ba-
sic architecture and behavior prediction method. In
Transducers 2007, The 14th International Conference
on Solid-State Sensors, Actuators and Microsystems,
pages 435–438.
Nicklas, T., Baranowski, T., Cullen, K., and Berenson,
G. (2001). Eating patterns, dietary quality and obe-
HEALTHINF 2020 - 13th International Conference on Health Informatics
290

sity. Journal of the American College of Nutrition,
20(6):599–608.
Nishimura, J. and Kuroda, T. (2008). Eating habits monitor-
ing using wireless wearable in-ear microphone. In 3rd
International Symposium on Wireless Pervasive Com-
puting, pages 376–381.
Obata, K., Saeki, T., and Tadokoro, Y. (2002). No contact-
type chewing number counting equipment using in-
frared sensor. Transactions of the Society of Instru-
ment and Control Engineers, 38(9):747–752.
Ruckenstein, M. and Pantzar, M. (2017). Beyond the
quantified self: Thematic exploration of a dataistic
paradigm. New Media & Society, 19(3):401–418.
Shuzo, M., Komori, S., Takashima, T., Lopez, G., Tatsuta,
S., Yanagimoto, S., Warisawa, S., Delaunay, J.-J., and
Yamada, I. (2010). Wearable eating habit sensing
system using internal body sound. Journal of Ad-
vanced Mechanical Design Systems and Manufactur-
ing, 4(1):158–166.
Tanigawa, S., Nishihara, H., Kaneda, S., and Haga, H.
(2008). Detecting mastication by using microwave
doppler sensor. In PETRA 2008, 1st international con-
ference on Pervasive Technologies Related to Assistive
Environments, article 88, 7 pages.
Uno, S., Ariizumi, R., and Kaneda, S. (2010). Advising
the number of mastication by using bone-conduction
microphone. In The 24th Annual Conference of the
Japanese Society for Artificial Intelligence, pages 1–
4. Japanese Society for Artificial Intelligence. (in
Japanese).
Zhang, H., Lopez, G., Shuzo, M., and Yamada, I. (2011).
Analysis of eating habits using sound information
from a bone-conduction sensor. In e-Health 2011, Int.
Conf. on e-Health, pages 18–27.
Zhang, R. and Amft, O. (2018). Monitoring chewing and
eating in free-living using smart eyeglasses. IEEE
JBHI, 22(1):23–32.
Detailed Classification of Meal-related Activities from Eating Sound Collected in Free Living Conditions
291
