
Generation and Optimization of Inspection Routes
for Economic and Food Safety
Telmo Barros
1
, Alexandra Oliveira
1,2 a
, Henrique Lopes Cardoso
1 b
, Luís Paulo Reis
1 c
,
Cristina Caldeira
3
and João Pedro Machado
3
1
Laboratório de Inteligência Artificial e Ciência de Computadores (LIACC),
Faculdade de Engenharia da Universidade do Porto, Rua Dr. Roberto Frias, s/n, 4200-465 Porto, Portugal
2
Escola Superior de Saúde do Instituto Politécnico do Porto (ESS-IPP),
Rua Dr. António Bernardino de Almeida, 400 4200 - 072, Porto
3
Autoridade de Segurança Alimentar e Económica (ASAE), Rua Rodrigo da Fonseca, 73, 1269-274 Lisboa, Portugal
Keywords:
Planning, Scheduling, Optimization, Decision Support, Vehicle Routing Problem.
Abstract:
Artificial intelligence techniques have been applied to diverse business and governmental areas, in order to take
advantage of the huge amount of information that is generated within specific organizations or institutions.
Business intelligence can be seen as the process of converting such information into actionable knowledge,
which is the basis for data-driven decision making. With this in mind, this work is framed in a project that
seeks to improve the activity of the Portuguese Food and Economic Safety Authority, regarding prevention in
the areas of food safety and economic enforcement. More specifically, this paper focuses on the generation
and optimization of flexible inspection routes. An optimal inspection route seeks to maximize the number
of targeted Economic Operators, or the utility gained from the set of Economic Operators that are actually
inspected. For that, each Economic Operator is assigned an inspection utility value. The problem was then
modelled as a Multi-Depot Periodic Vehicle Routing Problem with Time Windows, and solved using both
exact and meta-heuristic methods. The comparison of the meta-heuristic algorithms showed a versatile Hill
Climbing implementation in different test cases that explored the effect of the Economic Operators dispersion
and density.
1 INTRODUCTION
A considerable amount of work has been developed,
throughout the last decades, in the areas of Artificial
Intelligence (AI) and machine learning. Such techno-
logical advancements have been used successfully as
components of decision support systems in private or-
ganizations. Governments and public administration
institutions have also started to follow this trend and
use AI techniques not only to extract useful knowl-
edge from their huge amounts of data, but also to op-
timize their processes.
The work presented in this paper is part of a
broader project, that seeks to improve the activity of
the Portuguese Food and Economic Safety Author-
ity (ASAE), regarding prevention in the areas of food
safety and economic enforcement. The mentioned
a
https://orcid.org/0000-0001-5872-5504
b
https://orcid.org/0000-0003-1252-7515
c
https://orcid.org/0000-0002-4709-1718
organism is an authority in Portugal, whose mission
is to supervise and prevent non-compliance with the
national and European legislation regarding the food
and non-food sectors. It is also responsible for risk
assessment and reporting of hazards detected in the
food chain. For that, it is a reference entity in con-
sumer protection, public health, safeguarding market
rules and free competition by providing a public ser-
vice of excellence.
The contribution of this work is related with a
complex problem of generation and optimization of
inspection routes to surveil Economic Operators. For
that, it is necessary to develop models for inspection
utility assessment and procedures for selection of rel-
evant Economic Operators in need to be inspected
from large amount of registered and geographical
sparse number of agents. Moreover, due the mission
and area of influence of this entity, it is important to
use as much information as possible such as risk ma-
trices and number and type of complaints per Eco-
268
Barros, T., Oliveira, A., Cardoso, H., Reis, L., Caldeira, C. and Machado, J.
Generation and Optimization of Inspection Routes for Economic and Food Safety.
DOI: 10.5220/0009182002680278
In Proceedings of the 12th International Conference on Agents and Artificial Intelligence (ICAART 2020) - Volume 2, pages 268-278
ISBN: 978-989-758-395-7; ISSN: 2184-433X
Copyright
c
2022 by SCITEPRESS – Science and Technology Publications, Lda. All rights reserved

nomic Operators. The inspection routes generation
process must be capable of maximizing the number
of inspections to Economic Operators that present a
high inspection utility. The solutions found should be
adaptable upon suggestions by the user, reflecting the
nature of the work of the human inspectors. Previ-
ous research has shown that vehicle routing optimiza-
tion can promote significant economic savings (Hasle
et al., 2007; Toth and Vigo, 2002; Cattaruzza et al.,
2017).
The problem was modelled under the Vehicle
Routing Problem (VRP) family, as it tries to find the
optimal route for a fleet of vehicles that maximizes
the global utility of the Economic Operators selected
for inspection. Due to specific constraints that need
to be taken into account, such as opening hours of
Economic Operators, the existence of multiple oper-
ational units and the need to extend the planning to
multiple days the VRP formulation needs to be ex-
panded.
In Section 2, the related work is discussed. The
details about current processes, data size and the rout-
ing problem formulation are given in Section 3. Sec-
tion 4 explains the main choices regarding the imple-
mentation of the algorithms to best solve the prob-
lems. Several experiments were performed and their
details and results appear in Section 5. In Section 6
the paper’s conclusions and some suggestions for fu-
ture work are presented.
2 RELATED WORK
The VRP can be described as a complex combina-
torial optimization problem that, given a fleet of ve-
hicles with uniform capacity, a common depot, and
several costumer demands, find the set of routes with
overall minimum route cost which service all the de-
mands (Machado et al., 2002). One of the first prob-
lems modeled as a VRP was the Truck Dispatching
Problem (Dantzig and Ramser, 1959). As stated by
the authors, it may be considered as a generaliza-
tion of the Traveling Salesman Problem (TSP) (Flood,
1956; Kruskal, 1956).
A VRP can be modeled as a weighted graph
G = (V , A, C)
where: V = {v
0
, v
1
, ..., v
n
} is a set of vertices repre-
senting various cities or customers to visit and the de-
pot is indicated by vertex v
0
; A is the set of arcs join-
ing these vertices; C is a matrix of non-negative dis-
tances c
i j
associated with each arc (v
i
, v
j
), for i 6= j. In
some cases, the distances may be interpreted as travel
costs or travel times. There is also a set of m vehicles
available at the depot. The purpose of the problem is
to determine the lowest cost vehicle route set, subject
to the following restrictions (Laporte, 1992): (i) each
city is visited exactly once by exactly one vehicle; and
(ii) all vehicle routes start and end at the depot.
This problem can be mathematically expressed by
a set of four equations modeling the objective func-
tion and the restrictions (Cardoso, 2009; Toth and
Vigo, 2002). Given that, x
i jk
is a binary decision vari-
able taking the value of 1 if vehicle k traverses the
arc (v
i
, v
j
), and 0 otherwise and c
i j
defined as above,
the minimum sum of costs of all the arcs is given by
Equation 1:
min
m
∑
k=1
n
∑
i=0
n
∑
j=0
c
i j
x
i jk
(1)
Equation 2 limits to one visit per vertex, with ex-
ception of the depot:
n
∑
i=0
m
∑
k=1
x
i jk
= 1, ∀ j > 0 (2)
Equation 3 ensures that the number of the vehicles
arriving at every customer and entering the depot is
equal to the number of the vehicles leaving:
n
∑
j=0
x
jik
=
n
∑
j=0
x
i jk
, ∀ i ≥ 0, i 6= j, ∀ k = 1, ..., m (3)
Equation 4 ensures that all vehicle depart from the
depot:
n
∑
j=1
m
∑
k=1
x
0 jk
= |K| (4)
This family of problems has been studied inten-
sively over the last few years. In general, they are
associated with specific problems of supplying prod-
ucts to customers, supplying supermarket chains or
collecting waste from a locality.
Because of the diversity of applications of the
VRP problem, several variants have been proposed
from adding or removing constraints from the defini-
tion (Braekers et al., 2016; Weise et al., 2009). Some
of the most well known variations are: the VRP with
Time Windows (VRPTW) that is obtained by assign-
ing a time window to each customer (Caric and Gold,
2008; Zhu, 2000); the Multi-Depot VRP (MDVRP)
which accommodates more than one depot (Ho et al.,
2008; Montoya-Torres et al., 2015); the Periodic VRP
(PVRP) that considers multiple days planning (Camp-
bell and Wilson, 2014); the Capacitated VRP (CVRP)
where the vehicles have capacity constraints (Breslin
and Keane, 1997); or the Open VRP (OVRP) which
does not require the vehicle to end the route in the
depot (Li et al., 2007).
Generation and Optimization of Inspection Routes for Economic and Food Safety
269

All the mentioned VRP variants consider routes
planning for a single time instant, with exception of
the PVRP. The PVRP is a multi-day model where it
is possible to choose the day(s) to serve a customer
from a set of possible dates. This ability overrules the
constraint in Equation 2. The following elements are
added to the classical VRP:
i T days horizon and
ii a list of feasible days where the customers can be
visited.
For each day defined in T , a VRP is then solved. Ev-
idently, the choice of the visiting schedules and the
definition of the routes are interrelated problems (An-
gelelli and Grazia Speranza, 2002). There exist also a
PVRP formulated in Cordeau et al. (1997) that com-
bines the service time (visit duration for each cus-
tomer) with a work shift for each vehicle (a maximum
duration of a route).
Although the study of such methods is not a re-
cent topic, the discussion on how to best solve them is
something that still remains today. The reason behind
that is that the TSP, the VRP and its variant problems
are NP-hard since they are not solved in polynomial
time (Caric and Gold, 2008).
There are exact approaches that always determine
the optimal solution to the problem, but because they
require a high computational power they are only fea-
sible in small data sets. On the other hand, heuris-
tic and meta-heuristic approaches can return solutions
close to the optimum and present lower (and often ad-
justable) execution times, even for large data sets. The
difference between these two categories is related to
the behaviour of algorithms when determining the so-
lution (Laporte, 1992). To the best of our knowledge,
a Tabu Search heuristic is the most explored tech-
nique to solve the Periodic Vehicle Routing Problem
with Time Windows (PVRPTW) and the Multi-Depot
Vehicle Routing Problem with Time Windows (MD-
VRPTW) separately (Cordeau et al., 2001).
3 INSPECTIONS ROUTE
PROBLEM
In this section it is given an overview of the dataset
dimension used in this paper followed by the formu-
lation of the problem.
3.1 Dataset Description
The Authority has currently registered more than
3,500,000 Economic Operators in their internal
database. More than 200,000 customer complaints
against Economic Operators are registered in an an-
nual basis, both via the complaint book and into
ASAE’s website. The number of complaints, the
infractions implied by them and the type of eco-
nomic activity will determine the utility of inspection.
Consequently, complaint-targeted Economic Opera-
tors should be more likely to be included in inspection
operations.
The organic structure of the Authority has a na-
tionwide coverage divided into three regional units
each divided into variable number of operational units
(total of twelve operational units). Each operational
unit has a specific number of inspectors and vehicles
at their disposal.
The information system in use relies on multiple
data sources and platforms. All the referred factors
make it very difficult to automate some processes,
such as the identification of the Economic Operators
that need to be supervised (a time-consuming manual
procedure), the assignment of these Economic Oper-
ators to brigades of inspectors, or the determination
of optimal inspection routes taking into consideration
the minimization of travel distances or time.
It is noticeable that there is scope for improve-
ment in the visualization of georeferenced informa-
tion (Economic Operators) and in the inspections
planning. Regarding the inspections planning it is
possible to enhance the selection of Economic Oper-
ators that maximize the usefulness of being inspected
and also the flexible routes generation for the inspec-
tors while minimizing the spent resources.
3.2 Formulation
With respect to the routing problem at hands, it falls
into the family of vehicle routing problems as it
tries to find the set of inspection routes that maxi-
mize the global inspection utility of Economic Op-
erators. Given the specific inherent constraints of in-
spection routing, it is possible to classify the prob-
lem as a Multi-Depot Periodic Vehicle Routing Prob-
lem with Time Windows (MDPVRPTW) (Cordeau
et al., 2002). An example of a geographical represen-
tation of a solution of MDPVRPTW with four routes
starting (and ending) from three operational units (or-
ange circles) and visiting thirteen Economic Opera-
tors (blue circles) are shown in Figure 1.
The main differences between this modelling of
the problem as a MDPVRPTW and the classical VRP
are:
i the Multi-Depot takes into account the existence
of more than one depot where the vehicles starts
and arrives;
ICAART 2020 - 12th International Conference on Agents and Artificial Intelligence
270

Figure 1: MDPVRPTW representation.
ii the Periodic nature establishes a multi-day plan-
ning with the ability to choose when to visit an
Economic Operator; and
iii the Time Windows set a list of visiting schedules
when each Economic Operator can be visited.
This family of route generation problems encom-
passes the main constraints of the route inspection
problem within the geographical limits of an opera-
tional unit follows the flow-based formulation below.
The problem can be also modeled as a graph
G(V , A, c)
where V = EO ∪ D is a set of nodes composed of
depots D = {v
1
, ..., v
|D|
} and Economic Operators
EO = {v
|D|+1
, ..., v
|D|+|EO|
}. The set of arcs that con-
nect these nodes is A = {(i, j) : i, j ∈
1, . . . , |V |
, i 6=
j, {i, j} 6⊂ D}}. There is also a set of brigades B
which will perform the inspections. Each brigade
b ∈ B is a combination of a vehicle w (from a set
W of all available vehicles) and a set of inspectors I
b
(from a set I of all inspectors) where |I
b
| ≥ 2, ∀b ∈ B.
Similar to Cordeau et al. (1997), each brigade b ∈ B
has also an associated work shift [SS
b
, ES
b
], where SS
and ES are starting and ending of the work shift time,
respectively. Each Economic Operator eo ∈ EO has
a set of associated time windows OH
EO
which cor-
respond to the opening hours where they can be in-
spected. OH
EO
= {[ot
j
, ct
j
]
eo
: j = 1, . . .} where ot
j
and ct
j
are the opening and closing times of consecu-
tive working periods j in a day, respectively. Thus, a
brigade has to wait if the time of arrival at Economic
Operator eo is not between any pair of [ot
j
, ct
j
] ∈
OH
eo
. Each brigade b ∈ B has a foreseen break time
BT = [bs
b
, be
b
] of fixed size. Every eo ∈ EO has an
expected time of inspection ti
eo
according to the type
of their economic activity, e
eo
. Another key factor is
the u
eo
∈ [0, 1] which corresponds to the utility of in-
specting Economic Operator eo.
The objectives for this paper are either the maxi-
mization of the global utility (defined in Equation 5)
or the maximization of the number of inspected Eco-
nomic Operators in each day of inspection planning
(defined in Equation 6). They must be achieved while
satisfying the constraints for the classical VRP with
Multi-Depot, the time window of each Economic Op-
erator and the brigade’s work shift.
max
∑
b∈B
∑
i∈V
∑
j∈EO
u
j
x
i jb
(5)
max
∑
b∈B
∑
i∈V
∑
j∈EO
x
i jb
(6)
This formulation makes the present problem of
route generation a very challenging one from a tech-
nical point of view. The solution here presented re-
quired some relaxation of constraints in order to ob-
tain results in a reasonable amount of time.
4 FLEXIBLE ROUTES
GENERATION
The methodologies implemented to solve the problem
involved one exact method and three meta-heuristic
methods. In Section 4.1 the notion of inspection util-
ity is detailed, and in Section 4.2 the representation
of the solution is presented. Then, the details of the
implemented algorithms are included in Sections 4.3
and 4.4. Section 4.5 gives an overview of the devel-
oped web application to interact with such methods.
4.1 Inspection Utility
The utility u
eo
of inspecting an Economic Operator is
the basis for determining optimal inspection routes,
since it is the element that is intended to be maxi-
mized when seeking to obtain an optimal inspection
route. In the current approach, this value is obtained
empirically through the evaluation of customer com-
plaints. Based on this information, we define a utility
transformation function, shown in Equation 7. The
value of u
eo
is based on the number of complaints NC
regarding Economic Operator eo registered in the sys-
tem.
u
eo
(NC) =
0.05 if NC = 0
NC
10
if 1 ≤ NC < 10
0.9 +
NC−9
100
if 10 ≤ NC < 19
1 if NC ≥ 19
(7)
Every Economic Operator has a non-null utility
because, even in the absence of complaints, it can be
subject to inspection. Economic Operators with 1 ≤
NC < 10 have a transformation with a slope higher
Generation and Optimization of Inspection Routes for Economic and Food Safety
271
than agents with 10 ≤ NC < 19. Economic Operators
with NC ≥ 19 are classified with the fixed maximum
value of u
eo
= 1.
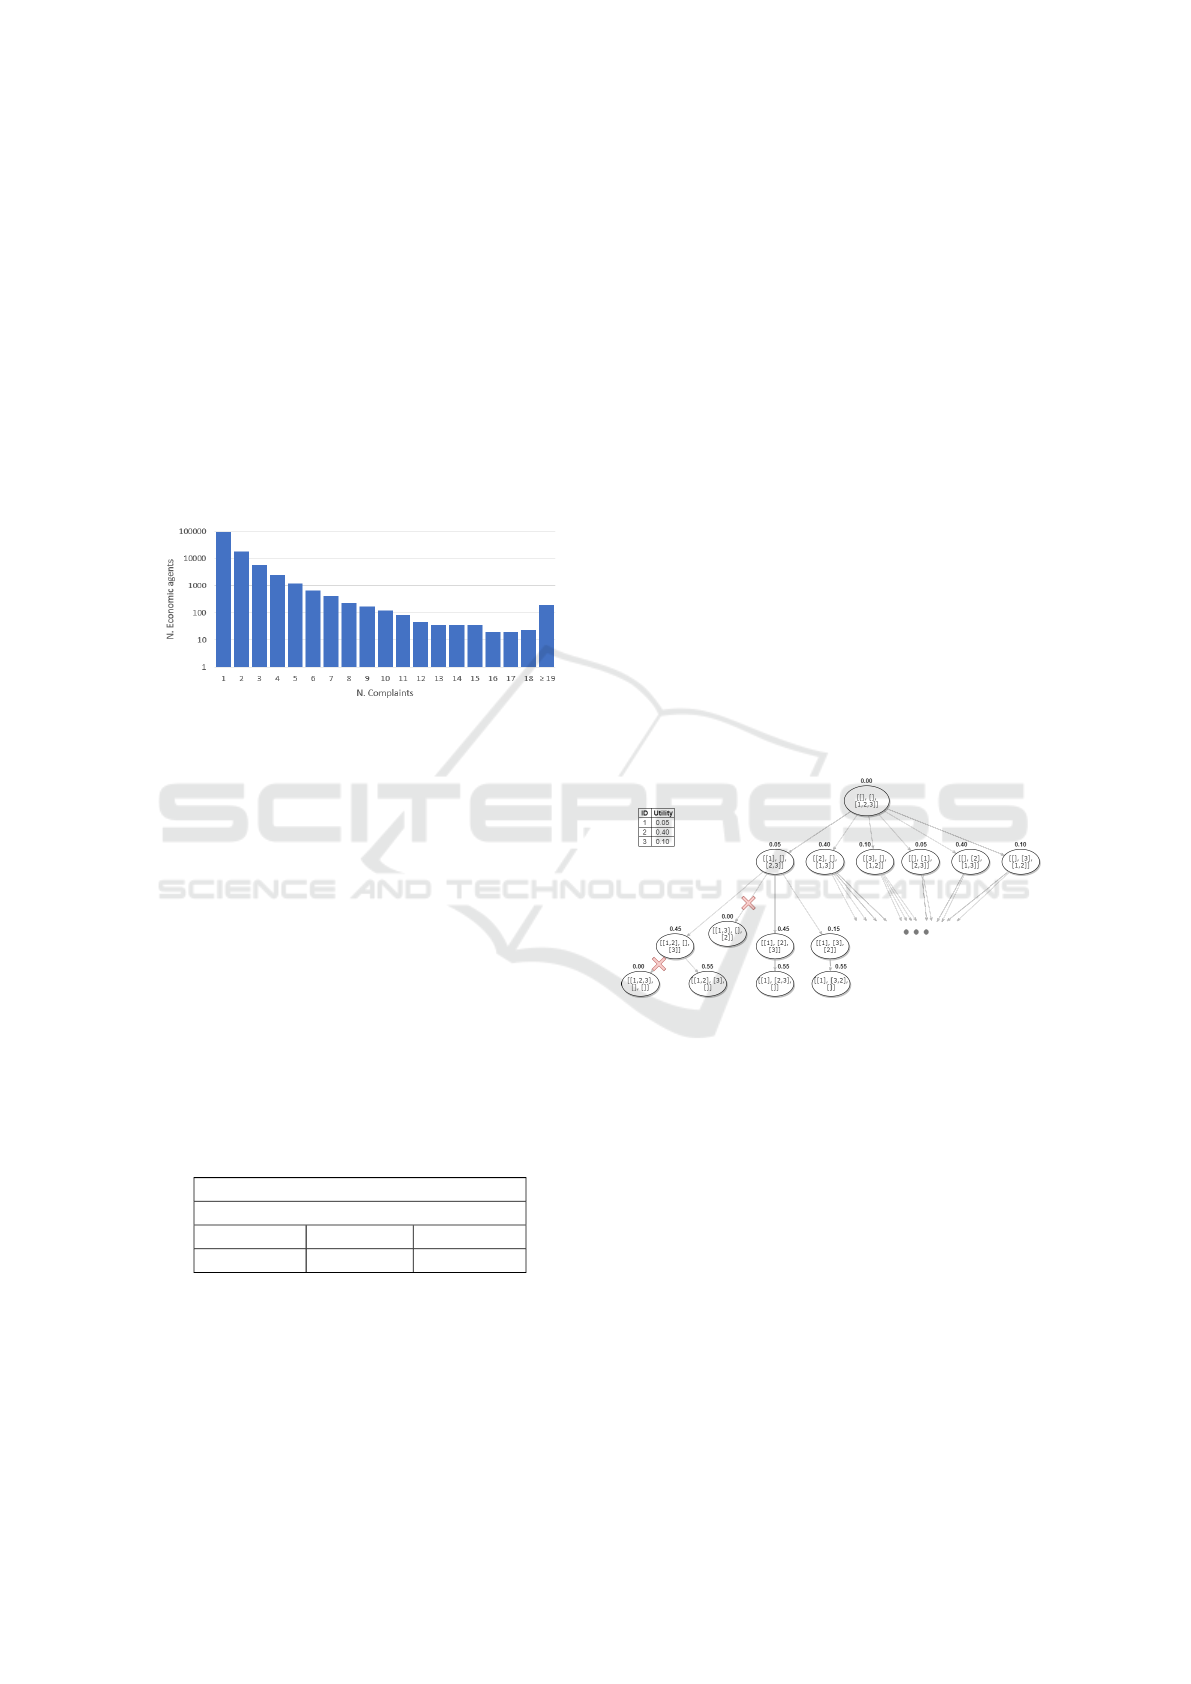
The determination of this function was based on
the analysis of the distribution of the number of com-
plaints per Economic Operator, graphically visible in
Figure 2 (the vertical axis is in logarithmic scale). The
number of agents with NC < 19 represent 99.84% of
the population of Economic Operators with reported
complaints; therefore, above that number of com-
plaints the utility gets its highest value of 1. The de-
cline is more pronounced in Economic Operators that
have 1 ≤ NC < 10 since this group represents 99.51%
of the population of agents with complaints.
Figure 2: Number of complaints distribution from 2013-
2018 (logarithmic Y axis).
4.2 Representation
To obtain the optimal inspection routes for |B|
brigades, routes are represented by a set of |B| + 1
lists. This form of representation allows us to deal
with the periodic nature of the VRP, which does not
require all Economic Operators to be visited in one
day. As the planning is calculated daily, the first |B|
lists include the actual inspection routes, while the
last list contains those Economic Operators that are
not part of the solution but may be integrated in the
next day plan. The generated routes include, for each
brigade, the Economic Operators stored by inspection
order. As an example, Table 1 represents a solution
for 2 brigades and 8 Economic Operators.
Table 1: Solution representation.
Representation
[6,3,4], [1,8], [2,5,7]
Brigade 1 Brigade 2 Unused eo
6 → 3 → 4 1 → 8 2, 5, 7
This solution representation is used by all al-
gorithms with exception for the genetic algorithm,
which requires another form of representation in order
to enable crossover and mutation operations between
individuals. This adaptation is achieved by convert-
ing the multidimensional list into a linearized single-
dimensional one. For the same example illustrated in
Table 1, the representation of the individual in the ge-
netic algorithm is [6, 3, 4, 1, 8, 2, 5, 7]. To decode the
individual into the routes solution, each eo is inserted
sequentially in the brigades until no more eo fit their
work shift duration (Zhu, 2000).
4.3 Exact Approach
The Branch and Bound algorithm is part of the set of
exact methods that solve the Vehicle Routing Prob-
lem. It always ensures the discovery of the best ex-
isting solution, despite its high temporal complexity.
For the problem in hands the branching strategy al-
lows to traverse all the solution space by adding each
possible Economic Operator to each brigade at a time.
The bounding occurs when the generated solution dis-
respects the work shift duration of any brigade.
The application of the method to the specific prob-
lem is shown in Figure 3. The example includes three
Economic Operators (1, 2 and 3) with utilities of 0.05,
0.40 and 0.10 respectively. In the first node all the
agents compose the set of agents not inspected by any
brigade, so the utility of the solution is 0. At each
layer, an agent is removed from the last array and in-
serted into one of the brigades.
Figure 3: Branch Bound applied to the routing problem.
Although this type of approaches is only practi-
cable with small sized problems, the implementation
is useful to perform comparable tests with the other
algorithms.
4.4 Meta-heuristic Approaches
Regarding meta-heuristic approaches, three different
methods were developed: (i) Hill Climbing, (ii) Sim-
ulated Annealing and (iii) Genetic Algorithm. The
main details are described in this section.
Hill Climbing and Simulated Annealing allowed
to obtain a sufficiently good solution in a short execu-
tion time, when compared to the Branch and Bound
algorithm, for instance.
In this concrete implementation, the algorithms
start by generating an initial valid solution, generated
ICAART 2020 - 12th International Conference on Agents and Artificial Intelligence
272
by trying to allocate Economic Operators in a random
way to each brigade, having as limit the work shift
of each one. The remaining Economic Operators are
kept on the last list. From this solution they proceed
to find the optimal solution out of all possible solu-
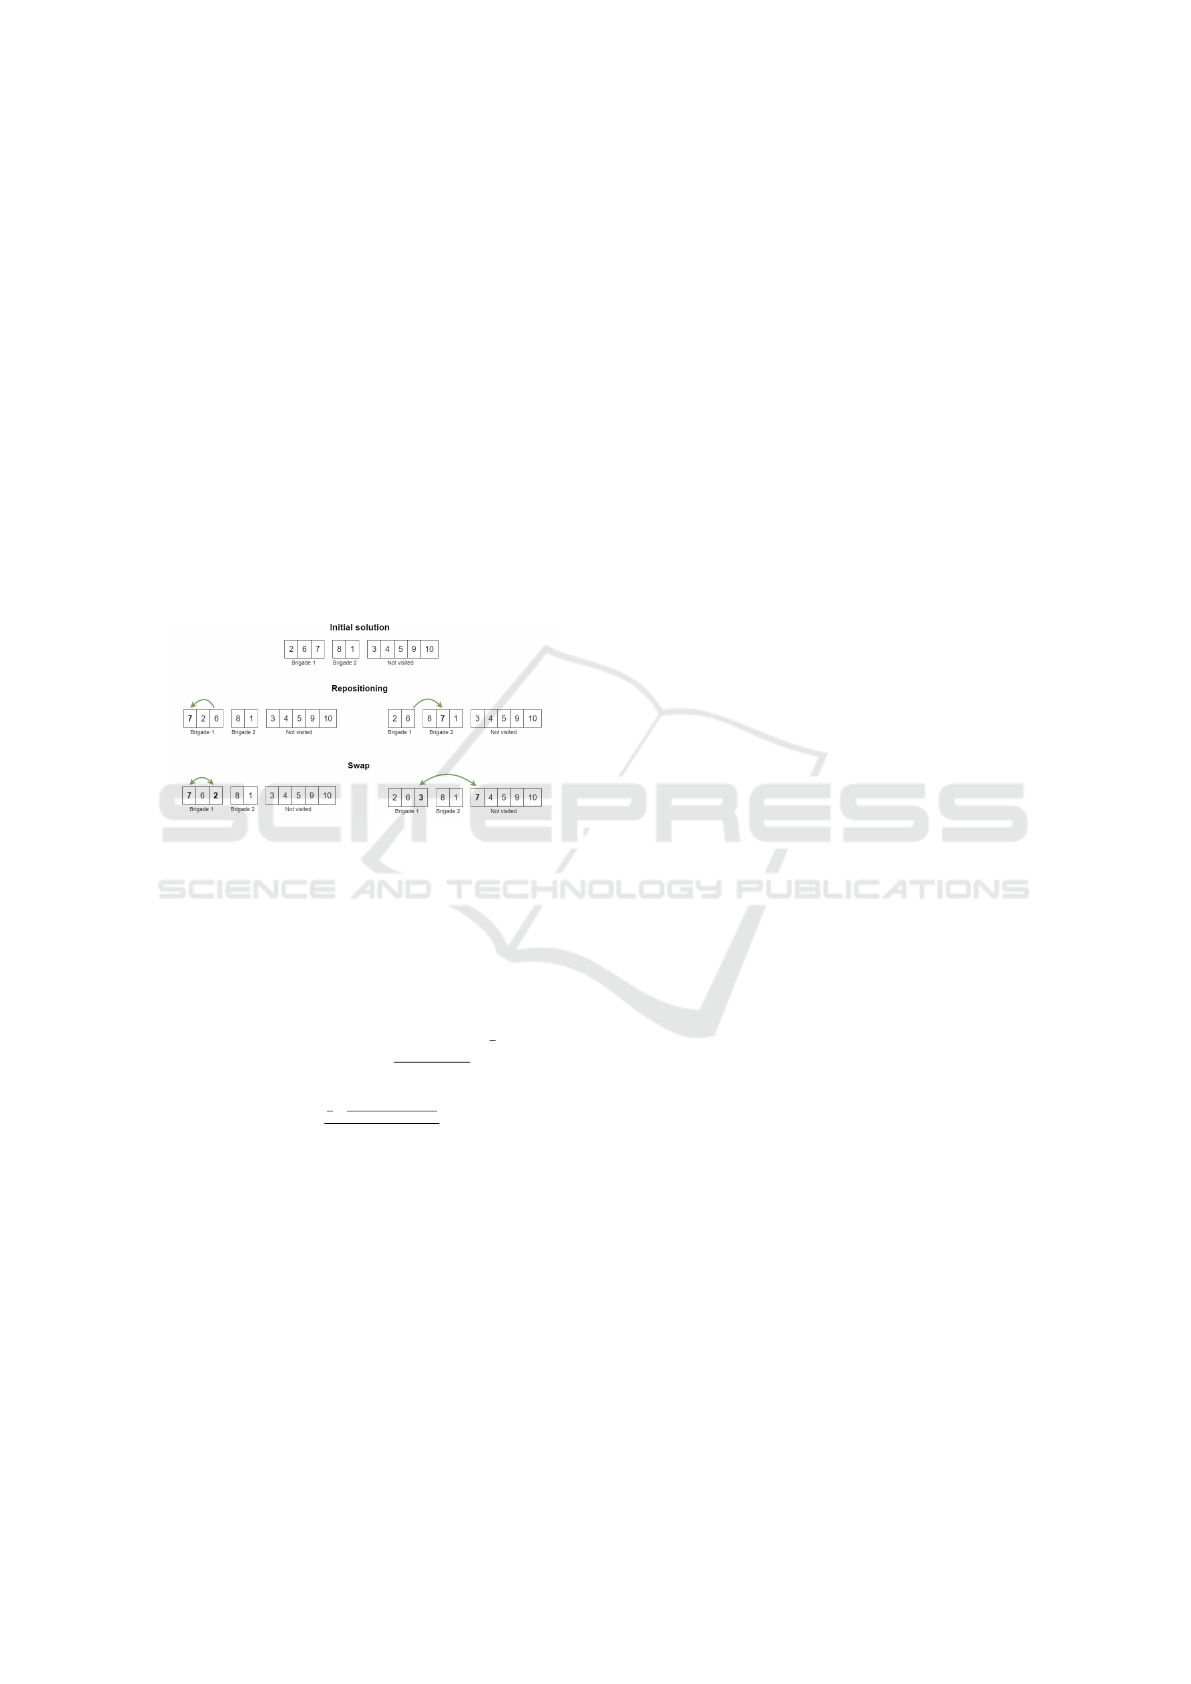
tions (the search space). The neighborhood function
is based on two equiprobable operators (Figure 4):
• Repositioning consists of exchanging the position
of an Economic Operator, either within the same
brigade or to a different brigade (when reposi-
tioning an Economic Operator in the last fictitious
brigade list, it becomes part of the agents not in-
cluded in the solution).
• Swap consists of changing the order of two
Economic Operators; just as with repositioning,
swapping can also occur between two agents of
the same brigade or different brigades.
Figure 4: Neighborhood generation operations.
The implementation of Simulated Annealing has
the specificity of probabilistically accepting solutions
with lower utility than the best solution at the mo-
ment. Equation 8 shows the temperature update func-
tion, while Equation 9 shows the acceptance probabil-
ity formula in this specific application of the method.
temperature = 1 −
iteration
n of steps
1
2
(8)
p = e
1
2
×
new utility−utility
utility
temperature
(9)
The probability of accepting solutions with lower
utility is related with the differences in utility and the
number of iterations already performed. Regarding
the implementation of the Genetic Algorithm, the se-
lection process suggested by Zhu (2000) was used –
selection by tournament. The implication in this se-
lection scheme is that genetically superior chromo-
somes are given priority in mating but average en-
tities have some chances of being selected too, pro-
vided they happen to be compared with a ’worse-off’
chromosome.
Regarding the crossover process, two options
were implemented: PMX and heuristic crossover.
The application of common crossover operations un-
avoidably produces invalid offspring that have dupli-
cated genes in one string. With PMX, two arbitrary
points are selected, the portions of the chromosomes
between these points are swapped and in order to re-
move duplicate Economic Operators, a series of gene
swappings are performed. This crossover operation
originates two descending chromosomes.
Heuristic crossover is a slightly different process
because it takes into account the distance between the
Economic Operators. It starts with an arbitrary cut on
both chromosomes and one of the genes immediately
following the cut position is chosen to be maintained.
The not selected gene is replaced or deleted to avoid
duplication in the following iterations. After this de-
cision, an iterative process begins that traverses the
chromosomes and compares, in each iteration i, the
distance between the gene at position i and position
i + 1 of both progenitor chromosomes. The i + 1 po-
sition gene presenting lower distance is selected to be
part of the descending chromosome. The gene that
was not selected is either deleted or swapped with the
selected gene. In the current implementation, two de-
scendants are generated, one from repositioning and
the other from deletion (Zhu, 2000).
After crossover, there is a low probability of mu-
tation in the descending chromosomes. The current
implementation encompasses four types of mutations,
equally likely to occur:
• Gene Repositioning: a gene / Economic Operator
is randomly selected and repositioned at a random
position inside the chromosome.
• Sequence Repositioning: it is similar to the pre-
vious operation, however repositioning is per-
formed on a set of consecutive genes.
• Gene Swap: two genes / Economic Operators
are selected randomly and their positions are
swapped.
• Sequence Swap: it is similar to the previous op-
eration, however position swapping is performed
between a set of consecutive genes and a gene.
4.5 Applicability
A crucial factor for being successful in solving so-
phisticated vehicle routing problems (VRP) is to offer
reliable and flexible solutions (Ritzinger et al., 2016).
Taking this into account, an Web application was de-
signed to interact with the logic layer (that solves the
problem following the approaches above) and to vi-
sualize the solutions from a geographical and chrono-
logical point of view.
Generation and Optimization of Inspection Routes for Economic and Food Safety
273

The Web application shown in Figure 5 is the part
of the solution implemented for visualization and in-
teraction with the core of the developed work, where
the Inspections Planning Assistant is the most rele-
vant for this paper. It contains two main pages: an
application page where it is possible to request the
generation of inspection routes, consult the solution
produced in three different views, change the routes
by adding agents to the solution or removing them,
and storing the routes permanently. The other page is
used to query inspection actions already stored.
The developed system is capable of creating a
daily plan for one or more brigades of inspectors in
order to promote a maximum number of inspections
in a day or to maximize the value of the utility of
inspected agents with an efficient use of resources.
This way it can work as a decision support system
for inspectors. The inspection plan can be consulted
by any worker and the system is amenable to eval-
uation by workers who suggest changes in the route
or additions/removals of Economic Operators. These
changes affect directly the defined utility of each Eco-
nomic Operator from the previous solution and there-
fore the solution is recalculated and presented.
5 RESULTS
Followed by the development of the four algorithms,
multiple tests and experiments, in simulated environ-
ment, were performed in order to promote a better
evaluation of the implemented methods. Based on
such experiments, relevant information has been col-
lected regarding algorithms performance, and solu-
tions quality.
Regarding the exact algorithm (Branch and
Bound), the capabilities of returning the optimal so-
lution were tested given an execution time limit of
300 seconds. The results are presented in Table 2,
which covers executions from 1 to 8 brigades for the
maximization of the number of inspected Economic
Operators. For 1 brigade it presented a maximum in-
put size of 24 Economic Operators, and 14 Economic
Operators for 8 brigades. In the rightmost columns it
is possible to verify the execution times for inputs of
4, 8, 12, and 14 Economic Operators.
The evaluation of the meta-heuristic methods
varies essentially according to the size and the type
of the input data (Economic Operators). The follow-
ing issues were taken into account:
• The values shown for meta-heuristic methods are
always the average of 3 executions.
• Brigades always start their route at the same hour
and their work shift has the same duration. Start-
ing and ending points are also the same.
• For the Genetic Algorithm, executions were per-
formed using a population of 100 individuals,
with crossover, mutation and recovery probabil-
ities of 80%, 5% and 4% respectively.
Varying parameters were:
• Objective Function: Maximization of the total
utility of inspected agents, or maximization of the
number of Economic Operators to be inspected.
• Number of Brigades: 2 brigades per 100 Eco-
nomic Operators, or 8 brigades per 100 Economic
Operators.
• Number of Iterations: 10,000 or 100,000 for Hill
Climbing and Simulated Annealing, and 100 or
200 to the Genetic Algorithm.
Varying the objective function and the number of
brigades allowed us to analyze the direct effect of
these variables in the performance of the final solu-
tion.
The test set is shown in Table 3, representing 8
Portuguese municipalities, the number of Economic
Operators located in those municipalities, and the
travel cost (distance and time) between the municipal-
ity and the center of operational unit (Figure 6). The
set of municipalities was carefully split into three test
subsets. (i) The red subset has only one municipality
and a low density of Economic Operators; (ii) the blue
subset is composed of four geographically dispersed
municipalities, also with low densities; on the other
hand, (iii) the orange subset has three municipalities
close to the starting/finishing place and a total of 424
Economic Operators.
The results for the referred three subsets are pre-
sented in Tables 4, 5 and 6. For each test case we show
the number of brigades used to determine the solu-
tion, the number of iterations used as stop conditions
and the results for the two objective functions: maxi-
mization of the global inspection utility (max u
eo
) and
maximization of the number of inspected Economic
Operators (max inspected eo). The avg u
eo
and the
avg eo columns contain the average of obtained in-
spection utilities and number of inspected Economic
Operators, respectively. Regarding the average for
the total execution times and the times to determine
the best solution, they are displayed in the avg T and
the avg t columns, respectively. Through the global
analysis of the obtained results it is possible to con-
clude that they are satisfactory as all the tests returned
a possible solution within the previously defined pa-
rameters.
Table 4, specifically, allows to compare the three
implemented meta-heuristic methods with the exact
ICAART 2020 - 12th International Conference on Agents and Artificial Intelligence
274
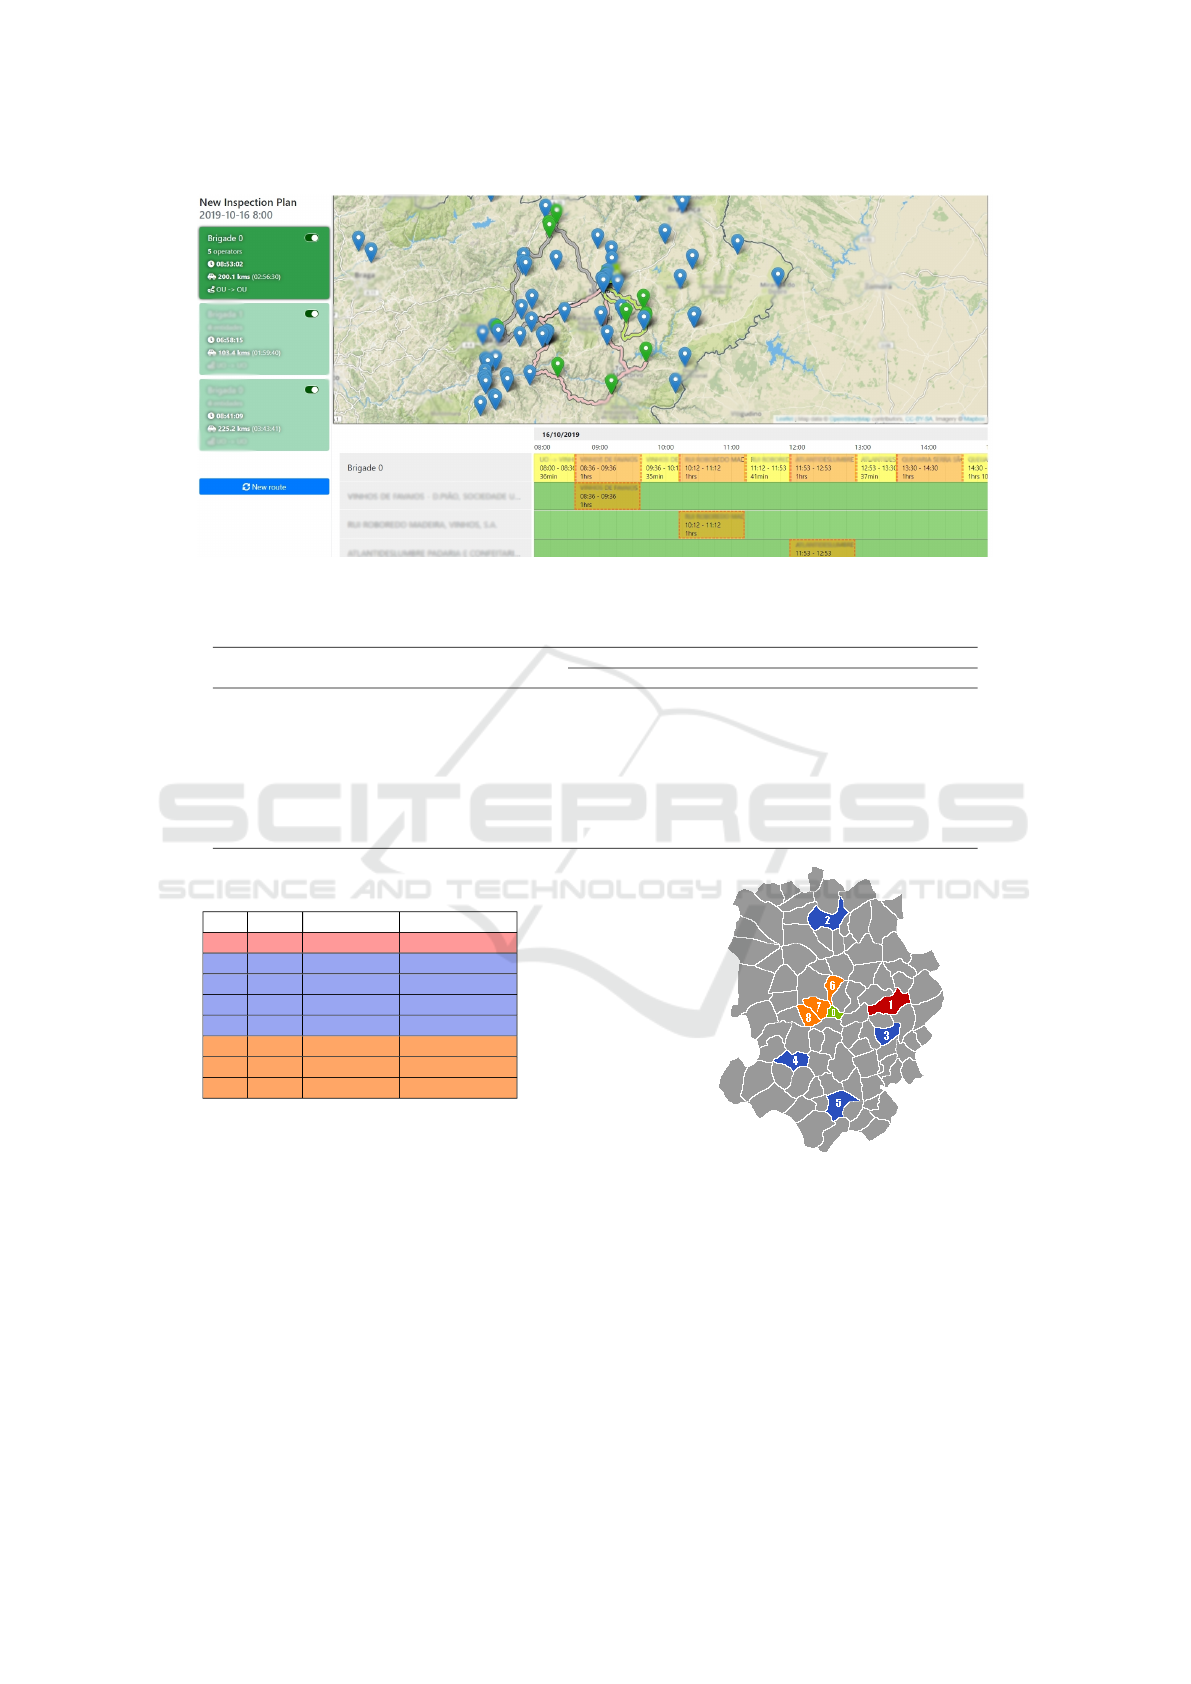
Figure 5: Web application overview.
Table 2: Branch and Bound results.
# Brigades Max. input eo Inspected eo
Execution time (secs)
4 eo 8 eo 12 eo 14 eo
1 24 7 0.0004943 0.003002 0.083515 0.097988
2 17 9 0.001474 0.012493 0.621539 0.722548
3 16 8 0.003000 0.035997 2.502038 2.944052
4 15 7 0.006986 0.085037 7.63200 8.982038
5 15 6 0.011999 0.167528 19.607051 23.136030
6 14 6 0.021499 0.308495 44.219024 52.153544
7 14 6 0.031999 0.537499 91.563532 107.494027
8 14 6 0.048499 0.871530 175.266998 205.784034
Table 3: Supporting information about each place from test
set.
ID # eo Dist (km) Time (mins)
1 32 8.6 14
2 15 9.9 16
3 25 8.2 16
4 32 9.2 12
5 35 10.5 18
6 126 2.3 6
7 150 2.0 6
8 148 2.8 7
one. For one brigade and the maximization of in-
spected eo it is possible to verify that every algo-
rithm got 7 Economic Operators, the same value as
the Branch and Bound, Table 2. The fastest imple-
mentation to retrieve this solution is the Hill Climb-
ing, with the lowest avg t, followed by the Genetic
Algorithm.
Hill Climbing was the most versatile method and
capable of returning a solution with high utility in a
shorter time period than other meta-heuristic meth-
ods. Regardless of the number of Economic Oper-
ators, brigades or distribution relative to the opera-
tional unit, this was the best performing method.
In theory, Simulated Annealing should allow to
Figure 6: Geographical distribution of the places used in the
experiments.
achieve solutions of superior utility than Hill Climb-
ing. However, this has rarely been observed. The
main explanation for this phenomenon is due to the
equation definition for determining the temperature
and probability of acceptance of solutions with infe-
rior utility. Even with equation tuning, Hill Climbing
outperformed Simulated Annealing in terms of exe-
cution time and solution utility.
As expected, the increment of iterations allowed
Generation and Optimization of Inspection Routes for Economic and Food Safety
275

Table 4: Case 1 results.
Algorithm # Brigades Iterations
max u
eo
max inspected eo
avg u
eo
avg t avg T avg eo avg t avg T
HC 1
10000 0.035 0.047 0.540 7 0.020 0.574
100000 0.035 0.038 5.398 7 0.022 5.428
SA 1
10000 0.035 0.156 0.555 7 0.077 0.541
100000 0.035 0.176 5.368 7 0.354 5.383
GA (PMX) 1
100 0.035 0.033 1.593 7 0.030 1.459
200 0.035 0.031 2.851 7 0.029 2.868
GA (Heuristic) 1
100 0.035 0.027 2.020 7 0.029 1.989
200 0.035 0.029 4.385 7 0.038 4.447
HC 3
10000 0.097 0.339 0.724 19 0.211 0.733
100000 0.100 3.579 7.170 20 2.063 7.276
SA 3
10000 0.092 0.618 0.690 19 0.631 0.710
100000 0.095 6.283 7.048 19 6.704 7.093
GA (PMX) 3
100 0.095 0.656 2.332 19 0.288 2.164
200 0.097 0.454 4.631 19 1.300 4.243
GA (Heuristic) 3
100 0.098 1.001 2.893 19 0.423 2.622
200 0.100 2.748 5.455 20 1.712 5.390
Table 5: Case 2 results.
Algorithm # Brigades Iterations
max u
eo
max inspected eo
avg u
eo
avg t avg T avg eo avg t avg T
HC 3
10000 0.100 0.462 1.328 20 0.812 1.332
100000 0.105 2.405 12.807 21 1.767 12.747
SA 3
10000 0.093 1.049 1.276 19 1.750 2.013
100000 0.100 11.400 12.690 20 11.317 12.651
GA (PMX) 3
100 0.095 0.590 3.894 20 1.770 3.933
200 0.098 2.008 7.790 20 3.254 7.804
GA (Heuristic) 3
100 0.103 2.352 6.664 21 2.857 6.542
200 0.103 3.994 13.171 21 4.929 13.145
HC 9
10000 0.268 1.355 1.806 54 1.114 1.796
100000 0.287 9.377 18.000 58 14.304 17.843
SA 9
10000 0.187 1.611 1.638 41 1.628 1.630
100000 0.263 17.403 17.678 53 16.845 16.934
GA (PMX) 9
100 0.262 4.375 5.887 50 2.824 5.815
200 0.268 9.897 11.984 53 7.219 12.258
GA (Heuristic) 9
100 0.248 4.514 8.280 47 4.810 8.085
200 0.250 6.539 16.329 52 12.161 16.534
Table 6: Case 3 results.
Algorithm # Brigades Iterations
max u
eo
max inspected eo
avg u
eo
avg t avg T avg eo avg t avg T
HC 9
10000 1.017 2.692 3.638 63 1.648 3.440
100000 1.270 11.184 34.606 63 1.869 34.499
SA 9
10000 0.910 3.260 3.297 51 3.255 3.288
100000 1.085 29.929 34.233 63 33.311 33.582
GA (PMX) 9
100 1.240 9.184 14.733 60 7.205 14.143
200 1.242 20.861 26.842 63 16.717 28.364
GA (Heuristic) 9
100 0.953 31.613 40.209 57 22.291 40.170
200 1.055 74.048 80.185 58 56.362 78.068
HC 34
10000 1.218 4.353 4.473 113 4.405 4.542
100000 2.080 52.686 53.695 228 53.100 54.150
SA 34
10000 0.957 4.082 4.113 66 4.093 4.205
100000 1.473 46.820 46.878 124 45.202 45.334
GA (PMX) 34
100 1.953 21.786 22.326 201 21.420 22.797
200 1.992 45.537 46.535 210 36.678 46.717
GA (Heuristic) 34
100 1.752 45.362 48.584 171 36.859 47.450
200 1.760 79.721 92.696 175 53.993 95.598
ICAART 2020 - 12th International Conference on Agents and Artificial Intelligence
276

to achieve solutions with equal or greater utility in
every test case but the added time of execution is con-
siderable.
The analysis of the Genetic algorithm concluded
that the heuristic crossover was the best option in the
first case studied, where the number of Economic Op-
erators and its dispersion were short. It presented the
best solution for 3 brigades alongside Hill Climbing,
but with a shorter avg t. In the remaining two cases,
with higher dispersion and density of Economic Oper-
ators, the PMX crossover was the one that allowed to
determine solutions with better utility and in a shorter
period of time. In general, the addition of brigades
under each test case have a greater impact on the ex-
ecution times for the Genetic algorithm than for the
Hill Climbing or the Simulated Annealing.
6 CONCLUSIONS AND FUTURE
WORK
In this paper, we presented the modeling and resolu-
tion of a complex combinatorial optimization prob-
lem related with the inspections planning process of
the Portuguese Economic and Food Safety Authority.
The definition of the constraints of the problem was
important to classify the problem at hands as a MD-
PVRPTW. Another key factor was the determination
of a utility function capable of determining the in-
spection utility of an Economic Operator based on the
number of associated complaints. Finally, four strate-
gies to solve the routing problem were implemented:
one exact and three meta-heuristic approaches. This
work is integrated in a Web application targeted to
support the decision of the Authority’s personnel and
enhance current processes of Economic Operators se-
lection for inspection and inspections routing.
The development prospects for a project of this
nature and scope are varied. In particular, the flexi-
ble inspection route generation module developed in-
cludes several perspectives for future development,
both in terms of optimization and in terms of addi-
tional features:
• Expansion of the number of implemented meth-
ods and/or parameters in order to obtain better so-
lutions.
• Inclusion of break-time periods for inspectors and
supervisors during the inspection route. The fact
that this period is flexible and can be different ac-
cording to the start time of the inspection actions
makes it difficult to add to the methods currently
implemented, but should be taken into account in
a next version of the system since it compromises
the use of the routes in a real context.
• Addition of different starting and finishing points.
Changing the methods for the fulfillment of these
conditions is a lengthy process, so the current ver-
sion only includes solutions to start and end at the
same geographic point – the headquarters of the
operational unit.
• Test the whole system in the field with the collab-
oration of the Authority, to extract metrics from
algorithms in a real context and detect gaps that
are not visible in a simulated environment with-
out professionals in the area.
Within the scope of the project as a whole, there
are development prospects that will directly and indi-
rectly affect the module of the generation of flexible
routes, such as:
• Implementation of risk matrices that will al-
low a determination of more accurate inspection
utilities. Optionally, the calculation should be
changed as new information is extracted from the
internal system.
• Development of an inspection durations adaptive
approach, based on actual practice. The catego-
rization of average inspection durations per area
of activity of Economic Operators will increase
the quality of the solutions obtained.
ACKNOWLEDGEMENTS
This work is supported by project IA.SAE,
funded by Fundação para a Ciência e a Tec-
nologia (FCT) through program INCoDe.2030.
This research was partially supported by LIACC
(FCT/UID/CEC/0027/2020).
REFERENCES
Angelelli, E. and Grazia Speranza, M. (2002). The pe-
riodic vehicle routing problem with intermediate fa-
cilities. European Journal of Operational Research,
137(2):233–247.
Braekers, K., Ramaekers, K., and Nieuwenhuyse, I. V.
(2016). The vehicle routing problem: State of the art
classification and review. Computers & Industrial En-
gineering, 99:300 – 313.
Breslin, P. and Keane, A. (1997). The capacitated arc rout-
ing problem: Lower bounds. Master’s thesis, Uni-
versity College Dublin, Department of Management
Information Systems, Dublin.
Campbell, A. M. and Wilson, J. H. (2014). Forty years of
periodic vehicle routing. Networks, 63(1):2–15.
Generation and Optimization of Inspection Routes for Economic and Food Safety
277

Cardoso, S. R. d. S. N. (2009). Optimização de rotas e da
frota associada. Master’s thesis, Universidade Técnica
de Lisboa, Instituto Superior Técnico, Lisbon.
Caric, T. and Gold, H. (2008). Vehicle routing problem. In-
Teh, Vienna, Austria.
Cattaruzza, D., Absi, N., Feillet, D., and González-Feliu,
J. (2017). Vehicle routing problems for city logis-
tics. EURO Journal on Transportation and Logistics,
6(1):51–79.
Cordeau, J.-F., Gendreau, M., and Laporte, G. (1997). A
Tabu Search heuristic for periodic and multi-depot ve-
hicle routing problems. Networks, 30:105–119.
Cordeau, J.-F., Gendreau, M., Laporte, G., Potvin, J.-Y., and
Semet, F. (2002). A guide to vehicle routing heuris-
tics. Journal of the Operational Research society,
53(5):512–522.
Cordeau, J.-F., Laporte, G., and Mercier, A. (2001). A uni-
fied tabu search heuristic for vehicle routing problems
with time windows. Journal of the Operational Re-
search Society, 52:928–936.
Dantzig, G. B. and Ramser, J. H. (1959). The truck dis-
patching problem. Management science, 6(1):80–91.
Flood, M. M. (1956). The traveling-salesman problem. Op-
erations research, 4(1):61–75.
Hasle, G., Lie, K.-A., and Quak, E. (2007). Geometric
modelling, numerical simulation, and optimization.
Springer.
Ho, W., Ho, G. T., Ji, P., and Lau, H. C. (2008). A hybrid
genetic algorithm for the multi-depot vehicle routing
problem. Engineering Applications of Artificial Intel-
ligence, 21(4):548–557.
Kruskal, J. B. (1956). On the Shortest Spanning Subtree of a
Graph and the Traveling Salesman Problem. Proceed-
ings of the American Mathematical Society, 7(1):48.
Laporte, G. (1992). The vehicle routing problem: An
overview of exact and approximate algorithms. Euro-
pean journal of operational research, 59(3):345–358.
Li, F., Golden, B., and Wasil, E. (2007). The open vehicle
routing problem: Algorithms, large-scale test prob-
lems, and computational results. Computers & Op-
erations Research, 34(10):2918–2930.
Machado, P., Tavares, J., Pereira, F. B., and Costa, E.
(2002). Vehicle routing problem: Doing it the evo-
lutionary way. In Proceedings of the 4th Annual Con-
ference on Genetic and Evolutionary Computation,
pages 690–690. Morgan Kaufmann Publishers Inc.
Montoya-Torres, J. R., López Franco, J., Nieto Isaza, S., Fe-
lizzola Jiménez, H., and Herazo-Padilla, N. (2015). A
literature review on the vehicle routing problem with
multiple depots. Computers & Industrial Engineering,
79:115–129.
Ritzinger, U., Puchinger, J., and Hartl, R. F. (2016). A sur-
vey on dynamic and stochastic vehicle routing prob-
lems. International Journal of Production Research,
54(1):215–231.
Toth, P. and Vigo, D. (2002). The Vehicle Routing Problem.
Society for Industrial and Applied Mathematics.
Weise, T., Podlich, A., and Gorldt, C. (2009). Solving real-
world vehicle routing problems with evolutionary al-
gorithms. In Natural intelligence for scheduling, plan-
ning and packing problems, pages 29–53. Springer.
Zhu, K. Q. (2000). A new genetic algorithm for VRPTW.
In Proceedings of the international conference on ar-
tificial intelligence. Citeseer.
ICAART 2020 - 12th International Conference on Agents and Artificial Intelligence
278
