
Mining Patient Flow Patterns in a Surgical Ward
Christoffer O. Back
1 a
, Areti Manataki
2 b
and Ewen Harrison
2 c
1
Department of Computer Science, University of Copenhagen, Denmark
2
Usher Institute, University of Edinburgh, U.K.
Keywords:
Bayesian Network, Data Mining, Patient Flows, Process Mining, Surgery, Surgical Workflow.
Abstract:
Surgery is a highly critical and costly procedure, and there is an imperative need to improve the efficiency in
surgical wards. Analyzing surgical patient flow and predicting cycle times of different peri-operative phases
can help improve the scheduling and management of surgeries. In this paper, we propose a novel approach
to mining temporal patterns of surgical patient flow with the use of Bayesian belief networks. We present
and compare three classes of probabilistic models and we evaluate them with respect to predicting cycle times
of individual phases of patient flow. The results of this study support previous work that surgical times are
log-normally distributed. We also show that the inclusion of a clustering pre-processing step improves the
performance of our models considerably.
1 INTRODUCTION
Surgery is a cornerstone of the healthcare system, and
critical in terms of time and resources. Ensuring effi-
ciency, timeliness and safety are crucial for providing
high quality service while controlling costs (Lalys and
Jannin, 2014), (Denton, 2007). While many processes
surrounding surgery are well structured, the dynamic
nature of patient arrivals combined with the complex-
ity of coordinating large numbers of specialized staff
and facilities, means that delays and misalignments
can have cascading effects leading to last-minute can-
cellations. This leads not only to an under-utilization
of expensive resources, but causes stress and upheaval
for patients.
The well-defined, yet dynamic; and high-cost,
high-impact nature of surgical patient flows, suggests
it is an area amenable to improvements via data ori-
ented process modeling. Advances in forecasting
long and short term dynamics of the surgical ward
can help inform intelligent surgery sequencing, staff
scheduling and workflow management systems.
This paper presents a preliminary investigation
into methods for modeling patient flows in surgi-
cal wards, with outset in a data set following pa-
tients from admission to discharge at the Royal In-
a
https://orcid.org/0000-0001-7998-7167
b
https://orcid.org/0000-0003-3698-8535
c
https://orcid.org/0000-0002-5018-3066
firmary of Edinburgh. We focus our present in-
vestigation on temporal aspects of individual patient
flows, which are key to improving efficiency. Results
from this study can then inform the investigation of
other aspects of patient flows such as positioning, as
well as high-level dynamics between multiple patient
flows competing for shared resources at the level of
ward/hospital.
After an exploratory investigation of the data, we
present and compare three probabilistic models de-
scribing cycle times of individual phases in patient
flows prior to, during and following surgery. We eval-
uate these w.r.t. to predicting cycle times of individ-
ual phases of patient flows, from the time patients
are sent for, through anesthesia and surgery, and until
they leave recovery.
Specifically, we employ a type of probabilistic
model called a Bayesian network. Aside from their
capacity to easily incorporate domain knowledge,
Bayesian networks have the advantage that they can
be queried in complex ways even with incomplete ev-
idence, which is invaluable in the uncertain hospital
environment. Crucially, we show that by incorporat-
ing a pre-processing step based on simple clustering
of flows w.r.t. cycle times, we can improve the perfor-
mance of our models noticeably.
The structure of the sequel is as follows. In Sec-
tion 2 we review existing literature. Our subsequent
analysis of the data follows the classic data analyt-
ics workflow of Describe → Diagnose → Predict. In
Back, C., Manataki, A. and Harrison, E.
Mining Patient Flow Patterns in a Surgical Ward.
DOI: 10.5220/0009181302730283
In Proceedings of the 13th International Joint Conference on Biomedical Engineering Systems and Technologies (BIOSTEC 2020) - Volume 5: HEALTHINF, pages 273-283
ISBN: 978-989-758-398-8; ISSN: 2184-4305
Copyright
c
2022 by SCITEPRESS – Science and Technology Publications, Lda. All rights reserved
273

Section 3 we introduce the domain, the data set, and
the data cleaning process. In Section 4, we present a
descriptive analysis of the data set using process min-
ing tools and standard statistical tools to identify in-
formative features of the data. This informs the pro-
cess of building predictive models which we describe
and evaluate in Section 5. In Section 6 we discuss our
results and in Section 7 we conclude.
2 RELATED WORK
Improving efficiency in surgical wards, specifically
improving utilization of operating rooms, has re-
ceived growing interested nationally and internation-
ally for a number of years now (Lalys and Jannin,
2014). The National Theatres Project in Scotland
states as its objective, “appropriately increasing pa-
tient throughput, thereby using resources more pro-
ductively and efficiently”(Scotland, 2006). The met-
rics for improvement include: reducing unutilized
(operating room) hours; reducing over/under-runs,
late-starts, cancellations and delayed discharges; and
avoiding unnecessary out-of-hours and nighttime pro-
cedures. Many of these objectives are strongly related
to appropriate scheduling, and would thereby benefit
from more accurate, data-informed, models of patient
flows.
A significant amount of research exists in model-
ing processes in the surgical domain. The modeling
scope of much existing work tends to fall on two ends
of a spectrum in terms of granularity: the level of sur-
gical procedures at one end and broader care flows
beyond the surgical ward at the other.
In (Lalys and Jannin, 2014), 46 publications on
surgical process modeling are categorized into a tax-
onomy ranging from the level of the surgical pro-
cedure at the lowest level of granularity, to low-
level physical movements at the highest. At the lat-
ter level, which is typically concerned with robot-
assisted surgery or training and assessment of sur-
geons, we see research on phase detection (Stauder,
2014) and detailed models of individual tool usage
patterns based on sensor data (Ahmadi, 2009). In-
dividual hand motions from video data are automat-
ically identified in (Lin, 2006) and (Haro, 2012). A
number of models based on sensor data collected dur-
ing Cholecystectomies (a highly standardized proce-
dure), were developed in (Blum, 2008), (Bouarfa and
Dankelman, 2012), (Bouarfa, 2011), and (Neumuth,
2011). All of these studies have the surgical proce-
dure at the highest level of abstraction. Our present
investigation lies above this level of granularity, with
only the procedure name and some other basic details
being present in the data.
Above the level of individual procedures, we see
work such as (Stahl, 2006) which describes the work-
flow within an operating room, including anesthesia,
surgery, and early recovery. Other studies also ad-
dress the process surrounding surgery, from admis-
sion to recovery (Funkner, 2017), which matches the
scope of our data set. Taking a view beyond the oper-
ating room is important, since activities downstream
from the actual surgical procedure can interrupt pa-
tient flows as shown in the case of ICU bottlenecks in
(Akkerman and Knip, 2004). Some studies have also
incorporated diagnosis and follow-up after surgery
such as (Mans, 2012) and (Huang, 2013).
Bayesian networks were used to model several as-
pects of stays in an emergency department in (Acid,
2004). While overall stay duration was one attribute
included in the model, the scope was at higher level
of abstraction, and not focused specifically on surgi-
cal patient flows. Furthermore, the main focus was
the comparison of structure learning algorithms.
Some work has looked specifically at model-
ing variance in surgery durations (Strum, 2000) and
incorporating this into sequencing and scheduling
strategies (Denton, 2007). In (Kayis, 2012), regres-
sion modeling is employed to predict surgery dura-
tion based on clinical, operational and temporal data.
Stochastic balancing of bed capacity based on fluctu-
ating demand patterns was explored in (Cochran and
Bharti, 2006) and length of stay patterns in (Akker-
man and Knip, 2004). Resource allocation and patient
admission was addressed in (Hulshof, 2013).
In summary, the scope of patient flows ranging
from admission, through surgery to recovery, is one
which has been less thoroughly addressed: most work
is positioned at a lower or higher level of abstrac-
tion. In regards to the distribution of surgery times,
our work has the corollary contribution of confirm-
ing previous findings. In terms of the more nuanced
conditional models we present of cycle times, specif-
ically the integration of patient clusters to Bayesian
networks, we believe our approach to be novel.
3 DOMAIN & DATA
PREPARATION
The Royal Infirmary of Edinburgh is the largest in
Scotland, housing 900 beds and with its 24-hour ac-
cident and emergency department, providing a full
range of acute medical and surgical services. The hos-
pital IT system is integrated with the Operating Room
Scheduling Office System (ORSOS), a surgery man-
agement and scheduling system.
HEALTHINF 2020 - 13th International Conference on Health Informatics
274

The data set analyzed stems from the ORSOS sys-
tem and involves records ranging from 2010 until
2018 inclusive. Over 1700 types of procedures are
recorded in the data set with about half of cases classi-
fied as emergency cases. It is oriented around individ-
ual surgical procedures, such that any time a patient
receives surgical treatment, a new entry is created and
each such entry has a unique case ID. This means that
the same patient may have multiple unique case IDs,
potentially for the same hospital stay. Unique patient
IDs, as well as electronic health record identifiers,
make it possible to follow patients’ overall treatment
flows, though this was out of scope of this investiga-
tion.
Data regarding patient flows are entered manually
by surgical support personnel, with the system requir-
ing the entry of timestamps for each event in the pa-
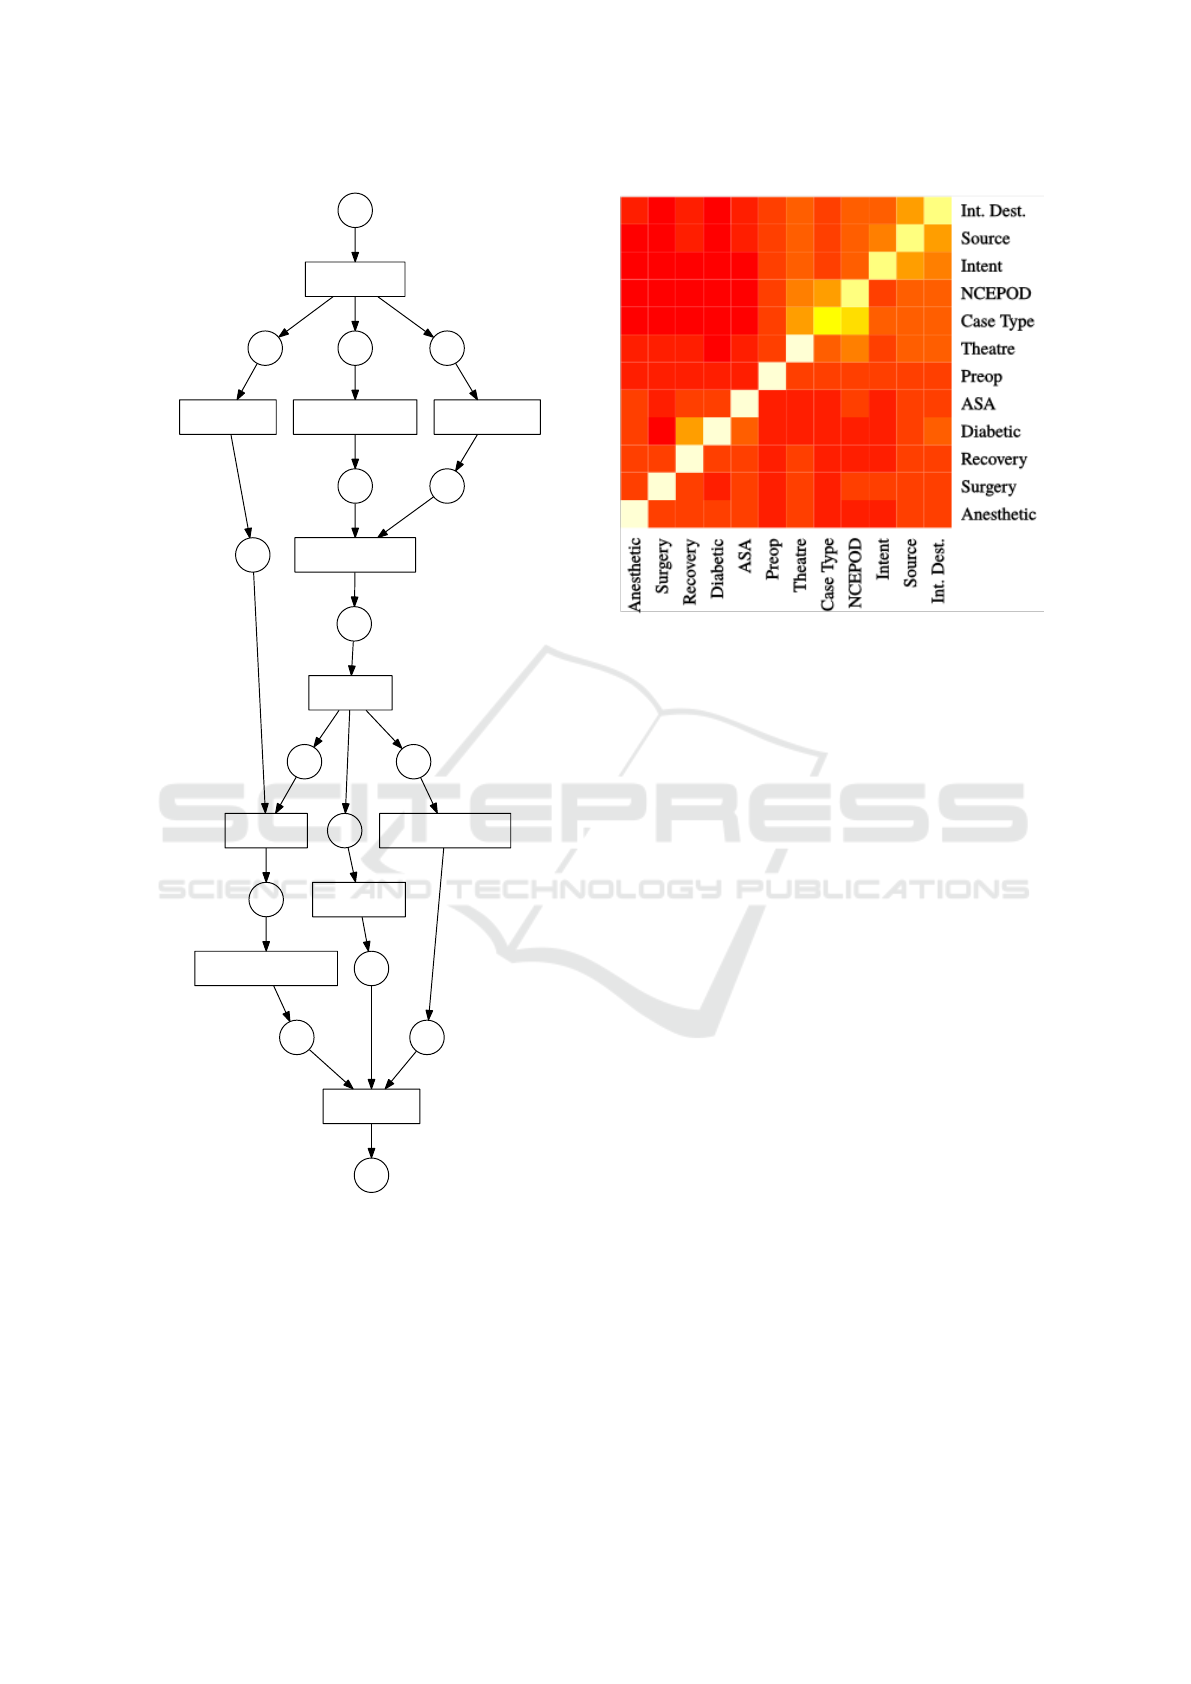
tient flow. Figure 1 illustrates the proscribed sequence
of events, and also shows the authors’ aggregation
of activities into logical phases (pre-op, anesthesia,
surgery, recovery). The system enforces a simple lin-
ear ordering of events, though it can be overridden. If
users attempt to enter timestamps out of sequence, a
warning is given, but can be entered upon confirma-
tion. Summaries of cases with anomalous entries are
later sent in batches to staff for review.
Aside from the 11 timestamp attributes, the data
schema contains 34 other attributes, though some
are empty for many cases, such as “reason for de-
lay”. Information regarding the procedure performed
is included in two different coding schemes, one
providing more detail such as location on body.
Other case attributes such as the case type (emer-
gency/scheduled), its urgency classification
1
, the
ASA patient status rating
2
, and whether the patient
is registered as a day-case or inpatient. Staffing de-
tails include names of the main and supervising sur-
geon and anesthetist as well as the consultant as-
signed to the case. The source of admission (emer-
gency room, etc.), the operating room number, as well
as intended and actual destination following surgery
(ICU, etc.) are also included. Further details include
the diabetic status of the patient, types of anesthetics
administered, whether antibiotics were administered,
and whether pre-session briefings and surgical pauses
were held.
Cleaning and Preparation. The data set contains
a number of anomalous entries, comprising roughly
10% of the 38,728 entries. These entries were re-
1
NCEPOD Classification of Intervention (NCEPOD,
2019).
2
American Society of Anesthesiologists physical status
classification system. (Dripps, 1963)
Table 1: Anomalous cases removed prior to analysis.
ANOMALY COUNT % OF TOTAL
Duplicate entries 58 0.15
Missing values 31 0.08
Dates out-of-range 475 1.23
Zero timestamps 3089 7.98
Bad ordering 443 1.44
Total 4096 10.58
moved prior to further analysis. Table 1 provides an
overview.
Duplicate entries may have been due to an at-
tempt to correct a data entry error. The column
anaesthetic start time was the only timestamp
column to contain <NA> values. A larger number of
cases have clearly anomalous values in the case date
column, e.g. dates much too far in the past (1800) or
future (3206).
Process mining techniques helped quickly reveal
that despite the de-jure linear ordering of activities,
many anomalous, and decidedly implausible, event
orderings exist in the data. Figure 4 shows the re-
sult of running the SIMPLE version of the Alpha
miner(Van der Aalst, 2004) from the pm4py package
(Berti, 2019) on the top 20 sequence variants. The
Alpha miner takes as input an event log and outputs a
Petri net (specifically a workflow net): a type of pro-
cess model. Running the Alpha miner on the entire
log results in a flower model
3
. A further a analy-
sis of the directly-follows graph indicated that nearly
all possible pairwise event orderings occurred at least
once in the data.
One of the aspects of the Petri net in Figure 4 that
stands out is that it permits incision start time to
occur before anaesthetic start time. While this
was to an extent the result of anomalous timestamps
in the data, upon further inquiry with surgical staff,
we learned that it is indeed legal for these activities to
be recorded with the same timestamp in cases where
the surgeon administers a local anesthetic.
Timestamps in the data set are rounded to
the minute, and that for many cases, two or
more events are recorded with the same times-
tamp. For example, enter theatre time and
incision start time are sometimes identi-
cal, and in fact leave theatre time and are
enter recovery time identical for all cases. This
needed to be addressed prior to applying process
mining techniques, since they assume sequential
orderings in event traces. For this, the de-jure model
was used as a tiebreaker in cases of simultaneity.
3
A flower model is a process model which permits any
event to be executed at any stage of the process.
Mining Patient Flow Patterns in a Surgical Ward
275

PREOP
ANESTHESIA SURGERY
RECOVERY
Send
for
patient
Enter
depart-
ment
Into
anesthetic
room
Anesth
-etic
start
Into
operating
room
Incision
start
Incision
stop
Leave
operating
room
Enter
recovery
Ready
to leave
recovery
Leave
recovery
Figure 1: The patient flow proscribed by the ORSOS system. Activities are linearly ordered, but can occur “simultaneously”.
That is, some activities (such as Leave Operating Room) can have the same timestamp as the “succeeding” activity (Enter
Recovery), but should not occur after it.
Many of the implausible cases had zero times-
tamps associated with the out-of-order events (times-
tamps of the the form YY-MM-DDT00:00:00). We sus-
pect that these entries may be the result of users spec-
ifying only a date without a timestamp. A further 443
cases had anomalous event orderings, likely due to an
incorrect entry such as failing to increment the date
when a patient flow stretched from one day to the
next. All cases with invalid orderings were removed
prior to subsequent analysis of cycle time patterns.
Plotting event occurrences on a “dotted chart” (see
Figure 2) also reveals several outlying events (occur-
ring months or years from the rest of the flow). The
dotted chart simply plots the events from an event by
the case id along the y-axis and by time along the x-
axis, such that events associated with the same case
fall along a horizontal line.
In the remainder of the analysis, we have removed
data points with cycle times in the 99
th
percentile of
values, having observed the presence of events oc-
curring months, even years apart, which for a single
surgical case are almost certainly due to data entry
mistakes. The chart also makes immediately obvious
that a gap exists in the data, and gives an indication
of the development in the throughput of cases over
time, which remains nearly constant, perhaps increas-
ing slightly.
The number of anomalous cases discovered de-
spite the ORSOS system’s compliance measures,
demonstrate the importance of data quality measures,
especially if such data are to form the basis of pre-
scriptive models and policies. While many of these
anomalies would in principle be discoverable by man-
ually querying the data, the use of process mining
techniques helped reveal these anomalies quickly and
intuitively, serving as a springboard for more detailed
analysis.
4 ANALYSIS
In this section, we describe the empirical distributions
of individual and aggregate cycle times, and compare
how well various parametric distributions fit the data.
Then, we identify the most informative features of
the data set, which will be used as astarting point for
model building in 5.
Marginal Cycle Time Distributions. Fitting an ap-
propriate distribution to data can be a powerful ap-
proach to building a predictive model, despite its sim-
plicity. These models consider only the marginal dis-
tribution, i.e. they consider outcome across all cases,
without conditioning the distribution on case-specific
attributes. Table 2 displays the results of fitting seven
different distributions to the cycle times of both the
original “low-level” events, as well as the aggregated
process phases.
As indicated by goodness-of-fit statistics, aggre-
gating individual event cycle times results in more
well-formed distributions, with the one slight excep-
tion of the recovery stage. While information is
clearly lost by reducing 9 cycle times to 4, this is jus-
tified by the fact that any implications of cycle times
on resource utilization is captured by the aggrega-
tions. For example, an operating theatre, will have
the status of being occupied and unavailable for other
patients during each of the events Into theatre, Inci-
sion start, Incision stop, and until Leave theatre com-
mences. This effect on resource availability is equiva-
lently captured in the aggregations of these events into
one Surgery event and its corresponding cycle time.
Previous research has indicated that surgical cycle
times are log-normally distributed (Strum, 2000). Our
observations are consistent with this, but it should be
noted that the Kolmogorov-Smirnov goodness-of-fit
does not achieve statistical significance.
Mutual Information. To get an overview of corre-
lation between attributes, the mutual information be-
HEALTHINF 2020 - 13th International Conference on Health Informatics
276
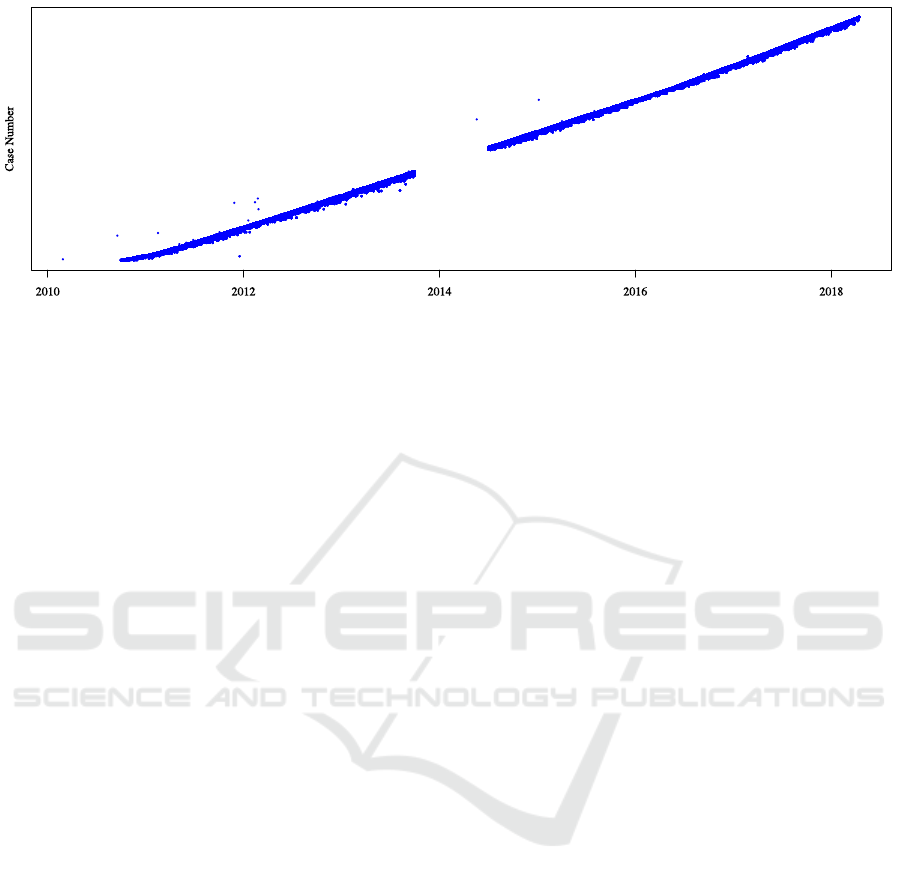
Figure 2: A “dotted chart” helps give a quick overview of the event log. Each data point represents the occurrence of an
event, plotted by time on the x-axis and by a numerical case identifier on the y-axis which are incremented by time. At this
level of granularity we cannot see the dynamics of individual process instances, but aspects such as arrival rate, outliers and
missing values become clear. In our data set, there is a prominent gap from October 2013 to July 2014, something one would
otherwise need to actively investigate, but is immediately noticeable here . Furthermore, several events lie weeks or years
from the rest of the events in a case, suggesting anomalous values.
tween attributes was computed, a selection of which
are visualized as heatmap in Figure 5. As a nonpara-
metric correlation metric, mutual information is more
suitable for our data than parametric estimators such
as χ
2
since we cannot confidently assume normality
for all attributes. Intuitively, mutual information mea-
sures the expected decrease in uncertainty regarding
the outcome of y upon learning the outcome of x.
Specifically, it measures the reduction in entropy of
the resulting conditional probability distribution.
For continuous values, namely cycle times, it was
necessary to discretize the data. This was done such
that each of 7 bins contained was of equal widths such
that the distribution of cases amongst bins roughly ap-
proximates their original distribution. Using this ap-
proach, correlations between attributes other than cy-
cle times were the strongest, while attributes influenc-
ing cycle times were more weakly correlated, though
still observable. Especially intended destination and
source of admission standout as informative w.r.t. cy-
cle times. Mutual information can tend to hide im-
portant nuances since it reflects the expected value of
the pointwise mutual information for individual val-
ues of a variable. Lead us to do a more detailed ex-
ploration of how different attributes influence cycle
times specifically.
Conditional Cycle Time Distributions. By explor-
ing the conditional distributions of cycle times for the
individual values attributes, we were able to get a bet-
ter idea of what influences cycle times. By visualizing
conditional distributions on the same plot, one gets a
quick impression of the whether an attribute is infor-
mative in this respect, or not. Albeit somewhat of a
time-consuming, brute-force approach, exploring the
data in this way is quite informative. This was an im-
portant factor for us in choosing which variables to
include in the models we present in Section 5. See
Figure 6 for examples of some of the most informa-
tive attributes.
Principle Components Analysis. Based on the in-
tuition that cases likely fall into some sort of group-
ing w.r.t cycle times, we investigated the presence of
clusters in the data. For example, cases with a long
anesthetic cycle time may also tend to have a long
surgery or recovery time - this likely being related to
the procedure performed or the patient’s condition.
A visual exploration of the raw, as well as log-
transformed, data gives the impression that no clear
groupings exist. One method for revealing sepa-
rable clusters in data that are not clearly separable
in the original data is via transformation techniques
such as Principle Components Analysis (PCA). PCA
projects the original data onto a linear subspace which
maximizes the resulting variability of the data along
the resulting bases, or principle components (Bishop,
2006). It is perhaps most commonly used as a method
for dimensionality reduction, by redefining the data
on a subset of the principal components which cap-
ture most of the variance in the data.
Applying PCA to the log-transformed data reveals
that the data does in fact fall into distinct clusters.
This can be seen in Figure 3 which shows the data
w.r.t to top 3 (of 4) principle components.
Mining Patient Flow Patterns in a Surgical Ward
277
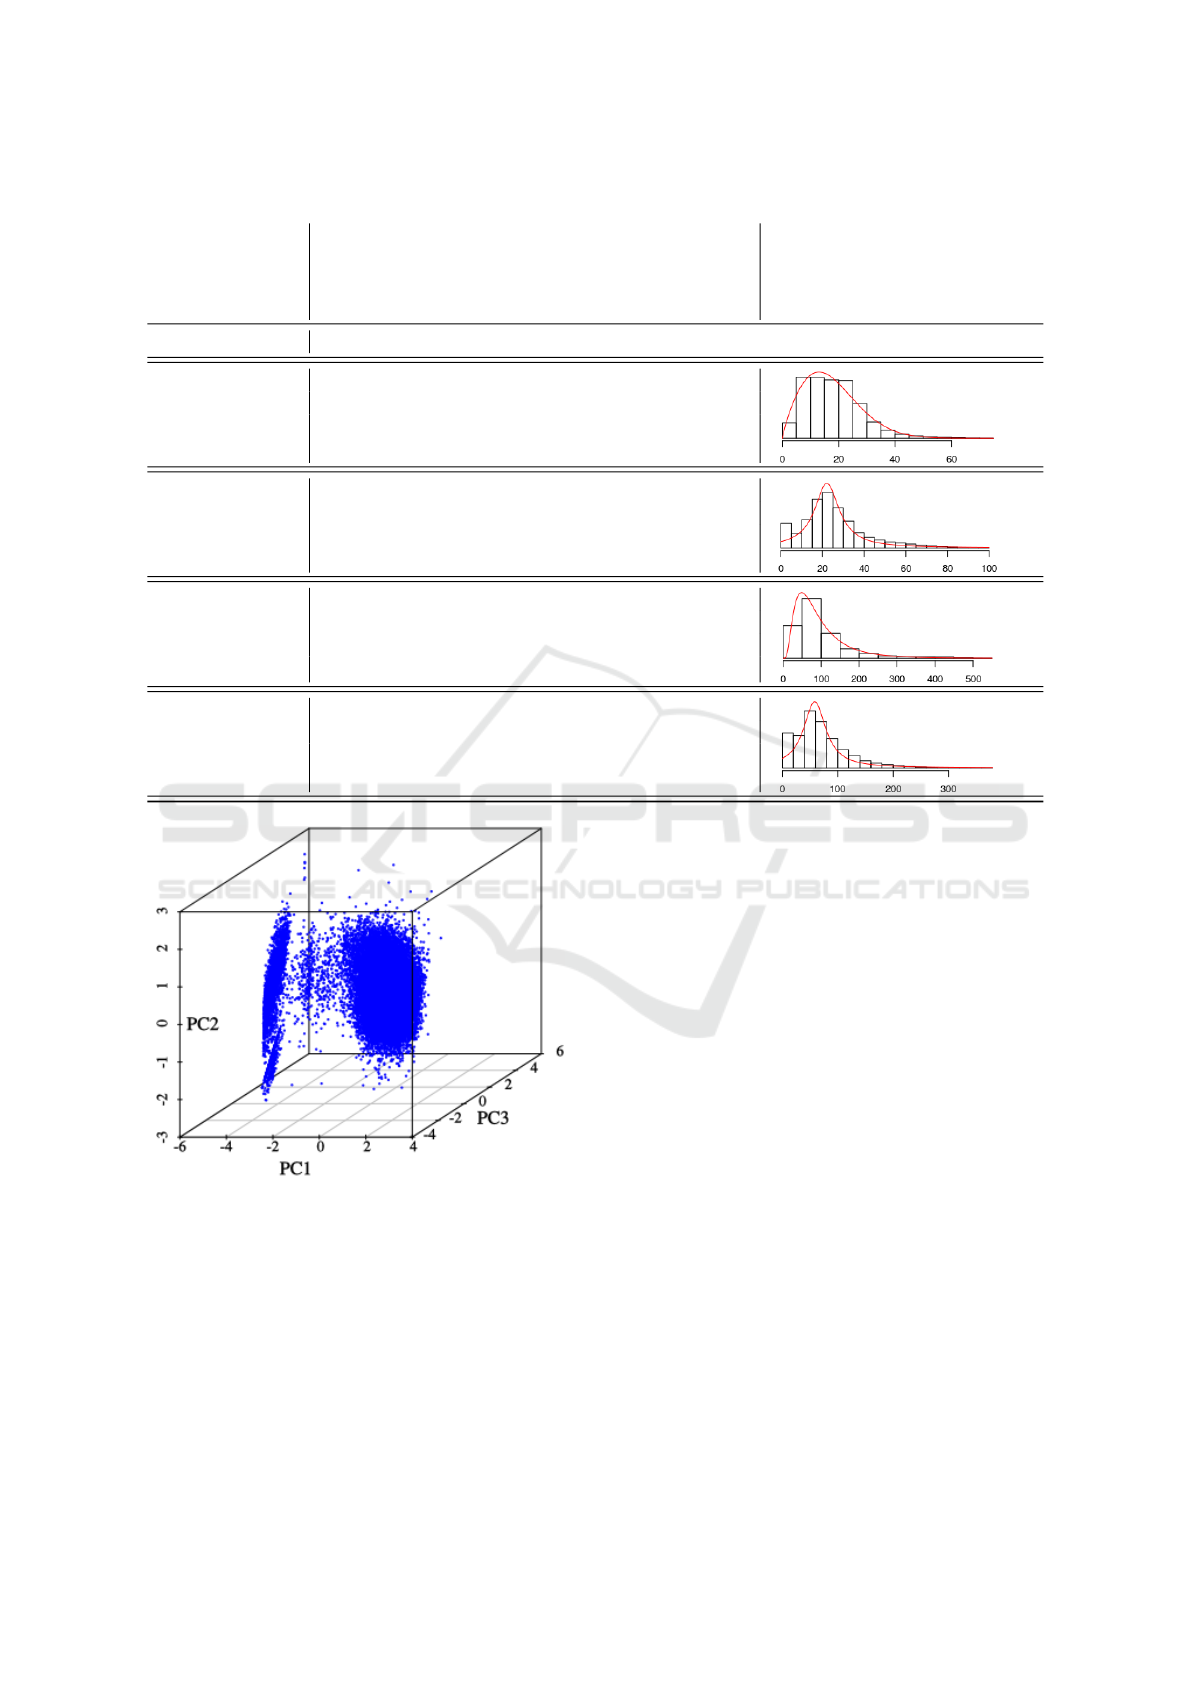
Table 2: Best fits for marginal distributions of cycle times. Goodness-of-fit statistic used is the Kolmogorov-Smirnov criterion.
Gaussian
Cauchy
Logistic
Log-Normal
Gamma
Weibull
Exponential
EVENT GOODNESS-OF-FIT (KS) PLOT (Best fit for aggregate)
Send for patient 0.147 0.113 0.139 0.169 0.126 0.104 0.267
Enter department 0.161 0.147 0.197 0.205 0.171 0.157 0.184
Pre-op 0.094 0.087 0.123 0.127 0.09 0.062 0.24
Into anesthetic 0.226 0.166 0.168 0.153 0.133 0.15 0.19
Anesthetic start 0.146 0.098 0.134 0.171 0.112 0.096 0.189
Anesthetic 0.124 0.077 0.106 0.188 0.132 0.106 0.244
Into theatre 0.16 0.094 0.143 0.111 0.093 0.114 0.298
Incision start 0.164 0.122 0.144 0.061 0.06 0.07 0.132
Incision stop 0.187 0.145 0.168 0.111 0.144 0.128 0.25
Surgery 0.16 0.11 0.134 0.036 0.071 0.087 0.193
Enter recovery 0.083 0.079 0.126 0.243 0.174 0.139 0.198
Ready to leave 0.285 0.277 0.266 0.184 0.144 0.144 0.22
Recovery 0.099 0.083 0.127 0.244 0.17 0.136 0.19
Figure 3: Top 3 principle components for (log-transformed)
aggregate cycle times.
5 PREDICTION
In order to facilitate improved resource utilization
through more accurate scheduling and dynamic re-
source allocation, we suggest using Bayesian belief
networks (Koller and Friedman, 2009). The reason
for this choice of model lies in its flexibility. Not
limited to one target feature, Bayesian networks can
be queried on any attribute, using whatever evidence
is currently available. A scheduler can pose queries
concerning, for example, the probability of a surgery
taking more than x minutes given the case type and
condition of patient, or the likely destination of the
patient given other evidence.
A Bayesian belief network is a directed acyclic
graph with an associated parametrization and repre-
sents a joint probability distribution and its condi-
tional independence relations between variables, rep-
resented as nodes. Both of these aspects, the graph
structure and its parametrization need to be either
hand modeled, learned automatically, or a combina-
tion of the two. We restricted this investigation to
automatically learned models. This can sometimes
lead to what may seem counterintuitive models, but
it should be kept in mind that an edge between two
nodes does not necessarily indicate a causal relation-
ship between source and target.
We present a comparison of 3 classes of models,
the latter 2 hybrid discrete/(log)-Gaussian models:
Marginal Model: an unconnected graph, equivalent
to the distributions in Table 2.
10 Variable Model: 4 aggregate cycle times, ASA,
CaseType, Intended Destination, Management In-
HEALTHINF 2020 - 13th International Conference on Health Informatics
278
Send for patient
Anesthetic start Into anesthetic room Enter department
Incision stop
Into operating room
Incision start
Enter recovery
Leave operating room
Ready to leave recovery
Leave recovery
Figure 4: A Petri net generated by the Alpha miner on the
top 20 trace variants observed in the event log. This model
clearly allows implausible behavior, such as Incision start
preceding Anesthetic start.
tent, NCEPOD Category, Source of Admission.
22 Variable Model: 4 aggregate cycle times, ASA,
CaseType, Intended Destination, Management In-
tent, NCEPOD Category, Source of Admission,
Diabetic, Operating Room, 10 Anaesthetic Type
variables.
Figure 5: Heatmap of the mutual information between at-
tributes. The “bright” spots indicate that learning the out-
come of the corresponding variable on the x-axis decreases
the uncertainty about the outcome of the corresponding
variable on the y-axis. Destination denotes the intended
destination following the procedure, NCEPOD denotes the
urgency classification, and Intent denotes whether the case
is a day-case or inpatient case.
Feature Selection. The choice of variables was
based on analysis in Section 4, as well as the cardinal-
ity of variables. Variables with very large cardinality
often fail to improve results due to sparse represen-
tation in the data. One solution to allow the incor-
poration of these is to perform dimensionality reduc-
tion on these variables prior to training the network.
This is left for future work. For the largest model,
we started by including all features, removing those
which had no effect on performance.
Clustering. In order to explicitly incorporate the
clusters observed in Section 4, we performed simple
k-means clustering on the PCA transformed data and
added a Cluster attribute to each case. This new at-
tribute was then included as a node in some variants
of the Bayesian networks. Specifically, we added 4
variants of both the 10- and 22-variable model us-
ing different numbers of clusters: 5, 10, 15, 20. For
comparison a model without clusters added is evalu-
ated as well. These values were chosen to illustrate
the improvement in model performance upon adding
more clusters and the eventual appearance of an el-
bow of diminishing improvement usually around 15
to 20 clusters. We experimented with values ranging
between 2 and 40.
Mining Patient Flow Patterns in a Surgical Ward
279

Figure 6: Examples of conditional cycle time distributions.
Top: conditioned on ASA status. Middle: Source of Ad-
mission. Bottom: Intended Destination.
We found that performing clustering on the PCA
transformed data gave slightly better results than clus-
tering on the original data. Note that we used all 4
principal components, hence the data was only trans-
formed and not reduced in dimensionality. It turns
out that PCA and k-means are in fact closely linked:
in (Ding and He, 2004) it is shown that PCA effec-
tively performs clustering w.r.t. the k-means objective
function. While performing PCA prior to k-means is a
widespread practice, it should be noted that it does not
always lead to improved results (Yeung and Ruzzo,
2001). We did observe a small improvement over per-
forming k-means on the untransformed data.
Learning Algorithms. Structure learning was per-
formed using score-based methods, specifically Hill
Climbing and TABU search, using Akaike Informa-
tion Criterion (AIC), Bayesian Information Criteron
(BIC) scores. We were unable to obtain models us-
ing log-likelihood scoring within a reasonable time.
An example of the graph structure of the learned
Bayesian network is shown in Figure 8. Parameter
learning was performed using the standard maximum
likelihood estimation, partly due to the unavailability
of Bayesian estimation techniques for hybrid models
in the chosen inference library.
Smoothing & Priors. Simple smoothing was ap-
plied to avoid zero probabilities for outcomes not ob-
served in the training data. This was done by simply
adding 0.01% to all probabilities and subsequently re-
normalizing. For continuous nodes with discrete par-
ents, the marginal distribution was assigned in case
a combination of the parents’ values was observed in
the training data.
Evaluation. Evaluation of Bayesian networks is of-
ten based on quantifying how closely the probabil-
ity distribution represented by the network matches
the empirical distribution (data). Typical metrics in-
clude log likelihood, Akaike information criterion,
Bayesian information criterion, and Kullback-Liebler
divergence.
One can also consider a specific target variable for
prediction and measure the error rate. Since we are
specifically interested in predicting cycle times, we
report results of the mean absolute error of predic-
tions for these 4 target variables. We chose to report
this metric rather than the more standard (root) mean
squared error (RMSE), since it gives a more imme-
diate sense of how far predictions were from actual
cycle times in terms of the original time units (min-
utes). Results for RMSE follow very nearly the same
pattern between models. Results are reported for 5
runs of 10-fold cross-validation, see Figure 7.
A crucial point regarding our approach to cross
validation concerns which attributes were considered
observed at each phase of the process. When predict-
ing a given cycle time, clearly any future cycle times
will not have been observed and should not be in-
cluded as inputs to the model. So when predicting the
Preop cycle time, Anesthesia, Surgery, and Recovery
should not be including as inputs. However, once the
patient has reached the Recovery phase, the preceding
cycle times are at least theoretically known and can
be used as inputs. This was our approach, motivated
by the assumption that even if patient flow monitor-
ing systems do not presently integrate such real-time
information they will likely do so in the near future.
6 DISCUSSION
Our preliminary analysis of the ORSOS data set has
demonstrated three points. First, the importance of
data quality assurance, cleaning and the usefulness
HEALTHINF 2020 - 13th International Conference on Health Informatics
280
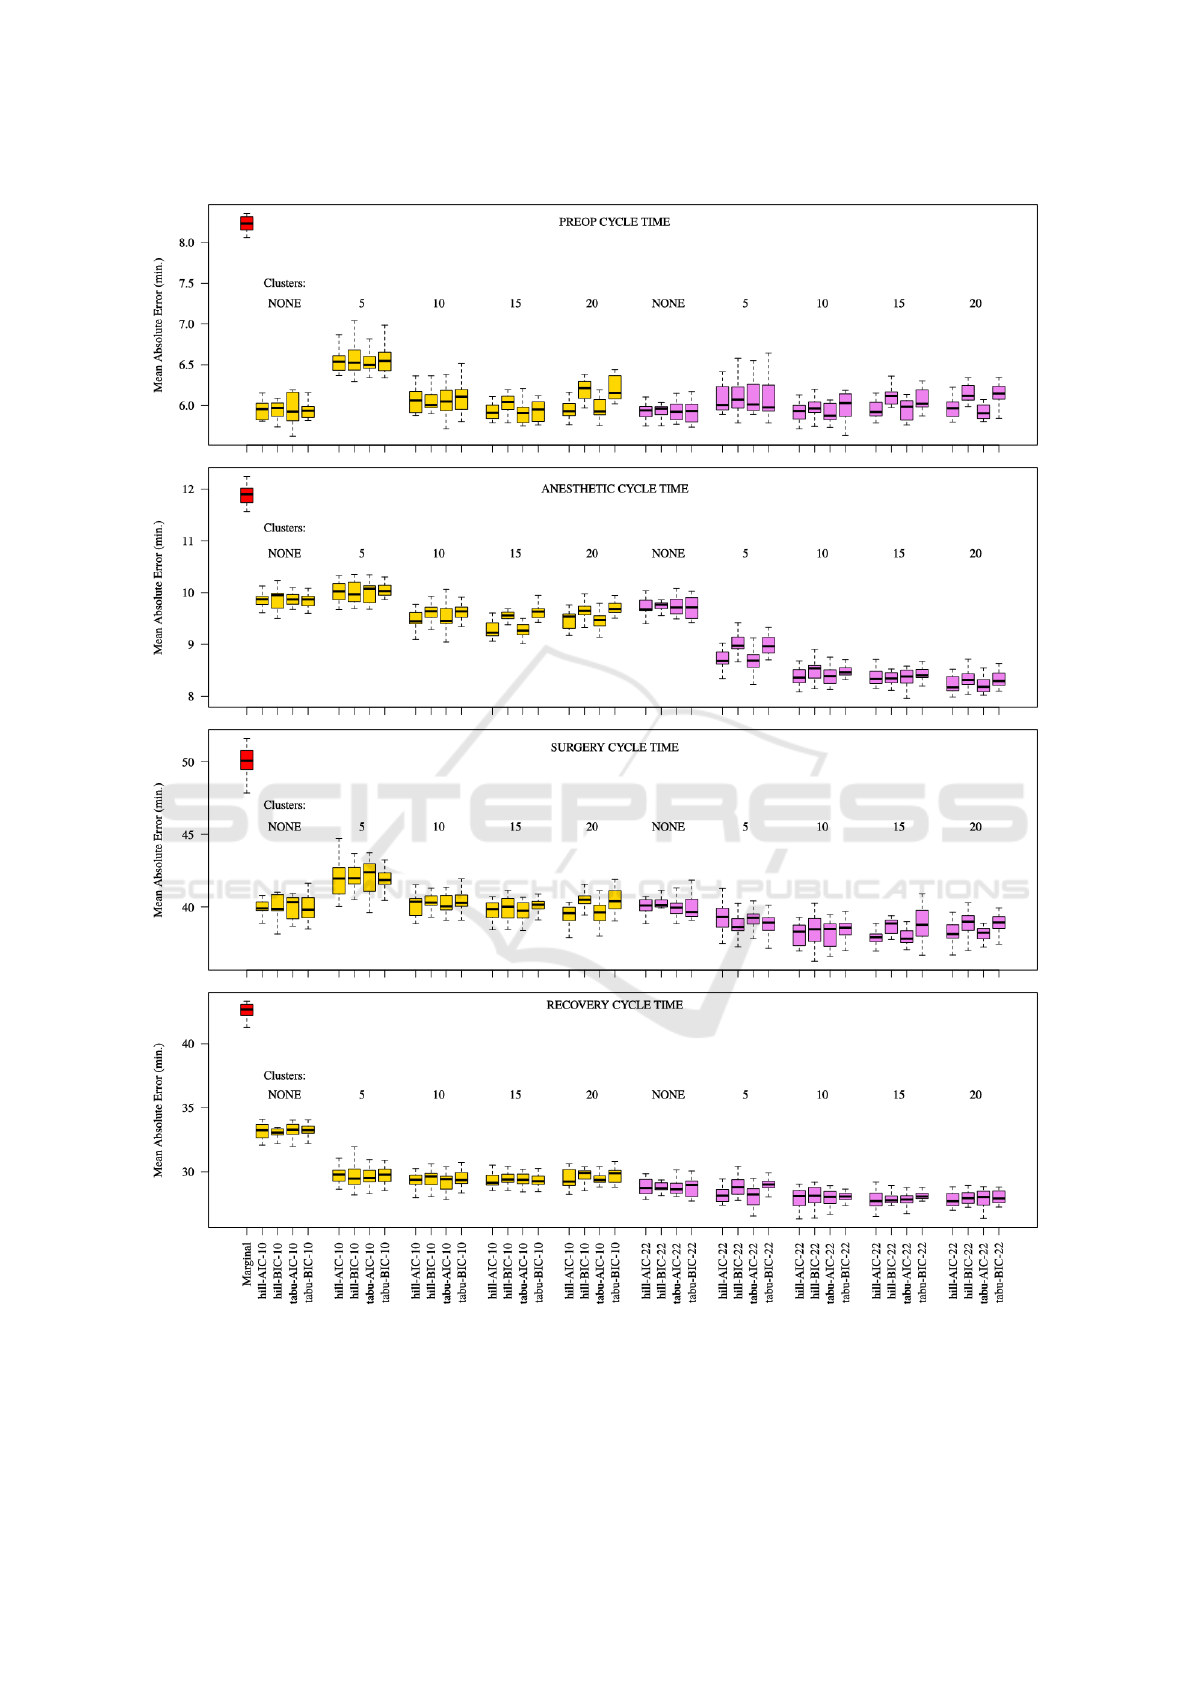
Figure 7: 5 runs of 10-fold cross-validation based on mean absolute error on the 4 cycle time target variables: preop, anesthetic,
surgery, and recovery. Red: Marginal baseline model. Gold: 10-variable model. Violet: 22-variable model. Within each
boxplot grouping are results for models learned with the Hill Climbing and TABU structure learning algorithms using Akaike
Information Criterion (AIC) and Bayesian Information Criterion (BIC) respectively.
Mining Patient Flow Patterns in a Surgical Ward
281

Source
CaseType
A_SED
IntendedDest
Intent
NCEPOD A_MINNB
A_IVMON
Cluster
OperatingRoom
A_EPI
A_LA
A_MAJNBSurgeryTime PreopTime
AnestheticTime
Diabetic ASA
A_GA
RecoveryTime A_SP
A_IVRA
A_CAU
Figure 8: The overall best performing model. The 22 variable model using TABU with BIC scoring and 20 clusters. Node
labels prefixed by Ane. denote anaesthetic types. NCEPOD indicates urgency classification, ASA patient condition and Intent
indicates day-case/inpatient.
of process mining techniques in this respect. Sec-
ond, that a reasonably accurate predictive model of
event cycle times in the form of a simple Bayesian
belief network can be built which significantly out-
performs simple marginal distribution fitting. Third,
that by clustering the target variables and including
these cluster labels as attribute in the model and train-
ing data improves accuracy yet further. Furthermore,
we describe how mutual information, tools for explor-
ing conditional probability distributions and principle
components analysis can not only give insight into the
data, but also guide model building
The choice of Bayesian networks was motivated
by their flexibility and interpretability. The fact that
they can be queried in such a versatile manner, based
on whatever data is available at the time, suggests they
would be a strong component of a predictive model in
a decision support and scheduling systems in surgery.
This allows for queries of the form, “what is the prob-
ability that case c will be in surgery for more than
m minutes given it has the following attributes, and
took n minutes to complete anesthesia?”. Specifically,
these could form the basis for probabilistic scheduling
systems.
7 CONCLUSION & FUTURE
WORK
We have demonstrated the utility of combining sev-
eral data analysis tools, including from process min-
ing and machine learning, to begin building a useful
model of a very complex set of processes in a sur-
gical ward. This approach would be also applica-
ble in other areas of the healthcare system in which
under-utilization of expensive resources calls for pre-
cise scheduling to avoid down-time.
In terms of the full data analytics workflow, often
summarized by Describe → Diagnose → Predict →
Prescribe, we have only just begun the Predict phase.
The incorporation of more aspects of the data set is
a clear next step - the huge cardinality of some at-
tributes, such as procedures and staff, should be ad-
dressed by incorporating domain knowledge and/or
dimensionality reduction. Considering the notable
improvements in precision we achieved with a rela-
tively limited data set, it is likely that incorporating
patient flow attributes across domains would lead to
yet more precise models.
A thorough comparison with learning algorithms
other than simple distribution fitting to confirm the
suitability of Bayesian networks to this application
is also important. Finally, while we have focused
on individual patient flows here, more comprehensive
HEALTHINF 2020 - 13th International Conference on Health Informatics
282

models which take into account ward level dynam-
ics such as patient arrival rates, resource constraints,
and resulting inter-patient dynamics are a natural ex-
tension. In such a system-wide model, the work pre-
sented here would serve as a component to more ac-
curately model local event timings and subsequent
downstream arrival rates.
REFERENCES
Acid, S., e. a. (2004). A comparison of learning algorithms
for bayesian networks: a case study based on data
from an emergency medical service. Artificial intel-
ligence in medicine, 30(3):215–232.
Ahmadi, S.A., e. a. (2009). Motif discovery in or sen-
sor data with application to surgical workflow analysis
and activity detection. In M2CAI workshop, MICCAI,
London. Citeseer.
Akkerman, R. and Knip, M. (2004). Reallocation of beds to
reduce waiting time for cardiac surgery. Health care
management science, 7(2):119–126.
Berti, A., e. a. (2019). Process Mining for Python (PM4Py):
Bridging the Gap Between Process-and Data Science.
In ICPM Demo Track (CEUR 2374).
Bishop, C. M. (2006). Pattern recognition and machine
learning. Springer Science+ Business Media.
Blum, T., e. a. (2008). Workflow mining for visualization
and analysis of surgeries. Int. journal of computer as-
sisted radiology and surgery, 3(5):379–386.
Bouarfa, L., e. a. (2011). Discovery of high-level tasks in
the operating room. Journal of biomedical informat-
ics, 44(3):455–462.
Bouarfa, L. and Dankelman, J. (2012). Workflow mining
and outlier detection from clinical activity logs. Jour-
nal of biomedical informatics, 45(6):1185–1190.
Cochran, J. K. and Bharti, A. (2006). Stochastic bed balanc-
ing of an obstetrics hospital. Health care management
science, 9(1):31–45.
Denton, B., e. a. (2007). Optimization of surgery se-
quencing and scheduling decisions under uncertainty.
Health care management science, 10(1):13–24.
Ding, C. and He, X. (2004). K-means clustering via prin-
cipal component analysis. In Proc. of the twenty-first
int. conference on Machine learning, page 29. ACM.
Dripps, R. (1963). American society of anesthesiologists.
New classification of physical status. Anesthesiology,
24(1):111.
Funkner, A. A., e. a. (2017). Towards evolutionary discov-
ery of typical clinical pathways in electronic health
records. Procedia computer science, 119:234–244.
Haro, B.B., e. a. (2012). Surgical gesture classification from
video data. In Int. Conf. on Medical Image Comput-
ing and Computer-Assisted Intervention, pages 34–
41. Springer.
Huang, Z., e. a. (2013). Summarizing clinical pathways
from event logs. Journal of biomedical informatics,
46(1):111–127.
Hulshof, P. J. H., e. a. (2013). Tactical resource allocation
and elective patient admission planning in care pro-
cesses. Health care management science, 16(2):152–
166.
Kayis, E., e. a. (2012). Improving prediction of surgery
duration using operational and temporal factors. In
AMIA Annual Symposium Proc., volume 2012, page
456. American Medical Informatics Association.
Koller, D. and Friedman, N. (2009). Probabilistic graphical
models: principles and techniques. MIT press.
Lalys, F. and Jannin, P. (2014). Surgical process modelling:
a review. Int. journal of computer assisted radiology
and surgery, 9(3):495–511.
Lin, H.C., e. a. (2006). Towards automatic skill evaluation:
Detection and segmentation of robot-assisted surgical
motions. Computer Aided Surgery, 11(5):220–230.
Mans, R., e. a. (2012). Mining processes in dentistry. In
Proc. of the 2nd ACM SIGHIT Int. Health Informatics
Symposium, pages 379–388. ACM.
NCEPOD (2019). NCEPOD classification of interven-
tion. https://www.ncepod.org.uk/classification.html.
Accessed: 2019-11-22.
Neumuth, T., e. a. (2011). Analysis of surgical interven-
tion populations using generic surgical process mod-
els. Int. Journal of Computer Assisted Radiology and
Surgery, 6(1):59–71.
Scotland, N. (2006). National theatres project re-
port. https://www.isdscotland.org/Health-Topics/
Quality-Indicators/National-Benchmarking-Project/
National-Theatres-Project/. Accessed: 2019-11-22.
Stahl, J. E., e. a. (2006). Reorganizing patient care and
workflow in the operating room: a cost-effectiveness
study. Surgery, 139(6):717–728.
Stauder, R., e. a. (2014). Random forests for phase detec-
tion in surgical workflow analysis. In Int. Conf. on In-
formation Processing in Computer-Assisted Interven-
tions, pages 148–157. Springer.
Strum, D., e. a. (2000). Modeling the uncertainty of sur-
gical procedure times: comparison of log-normal and
normal models. Anesthesiology, 92(4):1160–1167.
Van der Aalst, W. e. a. (2004). Workflow mining: Dis-
covering process models from event logs. IEEE
Transactions on Knowledge and Data Engineering,
16(9):1128–1142.
Yeung, K. and Ruzzo, W. L. (2001). An empirical study
on principal component analysis for clustering gene
expression data. Bioinformatics, 17(9):763–774.
Mining Patient Flow Patterns in a Surgical Ward
283
