
Use of Convolutional Neural Networks for Detection and Segmentation of
Pulmonary Nodules in Computed Tomography Images
A. A. Saraiva
2,6 a
, Luciano Lopes
1 b
, Pimentel Pedro
1 c
, Jose Vigno Moura Sousa
1 d
,
N. M. Fonseca Ferreira
3,4 e
, J. E. S. Batista Neto
6
, Salviano Soares
3 f
and Antonio Valente
2,5 g
1
UESPI - University of State Piaui, Piripiri, Brazil
2
University of Tr
´
as-os-Montes and Alto Douro, Vila Real, Portugal
3
Coimbra Polytechnic, ISEC, Coimbra, Portugal
4
Knowledge Engineering and Decision-Support Research Center (GECAD) of the Institute of Engineering,
Polytechnic Institute of Porto, Portugal
5
INESC-TEC Technology and Science, Porto, Portugal
6
University of S
˜
ao Paulo, S
˜
ao Carlos, Brazil
Keywords:
UNet, Segmentation, CT Scanner, Lung Nodes.
Abstract:
This paper presents a method capable of detecting and segmenting pulmonary nodules in clinical computed
tomography images, using UNet convolutional neural network powered by The Lung Image Database Con-
sortium image collection - LIDC-IDRI, that in the training process was submitted to different training tests,
where for each of them, their hyper-parameters were modified so that the results could be collected from
different media, getting quite satisfactory results in the segmentation task, highlighting the areas of interest
almost perfectly, resulting in 91.61% on the IoU (Intersection over Union) metric.
1 INTRODUCTION
According to the American Cancer Society (ACS),
cancer (CA) is a major public health problem world-
wide and is the second leading cause of death in the
United States. CA starts when body cells begin to
grow out of control. In 2019 the number of deaths
from CA is estimated to be 606,880 in the United
States, corresponding to almost 1,700 deaths per day
and 1,762,450 new cases of the disease.
Therefore, to find this type of pathology in indi-
viduals without symptoms, it is necessary to perform
a screening, that is nothing more than the use of tests
or exams, among them are the chest x-rays, which can
track lung CA and, in recent years, a test known as
computed tomography (CT) that can help find abnor-
a
https://orcid.org/0000-0002-3960-697X
b
https://orcid.org/0000-0003-0551-4804
c
https://orcid.org/0000-0002-5291-0810
d
https://orcid.org/0000-0002-5164-360X
e
https://orcid.org/0000-0002-2204-6339
f
https://orcid.org/0000-0001-5862-5706
g
https://orcid.org/0000-0002-5798-1298
mal areas in the lungs that may or may become CA
(Siegel et al., 2019).
Generally, in this scenario, one of the main prob-
lems in medical diagnosis is the subjectivity of the
expert at the time of the decision (Wang et al., 2018).
More specifically, when interpreting medical images,
the expertise of the specialist can greatly determine
the outcome of the final diagnosis.Sometimes manual
viewing methods can be very tedious, time consuming
and subject to error on the part of the interpreter. This
has led to the growth of automated image-based diag-
nostics as a support, and is one of the fastest growing
research topics today (Drozdzal et al., 2018).
As a result, the emergence of the Deep Learn-
ing paradigm and recent advances in computing
power have enabled the development of new intelli-
gent Computer Vision-based diagnostics (Xue et al.,
2018), (Saraiva et al., 2019a), (Saraiva et al., 2019b),
(Saraiva et al., 2018). Medical image analysis has
attracted increasing attention in recent years due to
its vital component in healthcare applications. Ad-
vances in computer vision such as multimodal image
fusion, medical image segmentation, image record-
292
Saraiva, A., Lopes, L., Pedro, P., Sousa, J., Ferreira, N., Neto, J., Soares, S. and Valente, A.
Use of Convolutional Neural Networks for Detection and Segmentation of Pulmonary Nodules in Computed Tomography Images.
DOI: 10.5220/0009178902920297
In Proceedings of the 13th International Joint Conference on Biomedical Engineering Systems and Technologies (BIOSTEC 2020) - Volume 1: BIODEVICES, pages 292-297
ISBN: 978-989-758-398-8; ISSN: 2184-4305
Copyright
c
2022 by SCITEPRESS – Science and Technology Publications, Lda. All rights reserved

ing, computer-assisted diagnostics, image annotation,
and image-guided therapy have opened up many new
possibilities for revolutionizing health. These ar-
eas include mobile device health care, biometric sen-
sors, computational vision for predictive therapy and
analysis, among other applications (Vardhana et al.,
2018).
Thus, this paper describes a system capable of de-
tecting and segmenting nodules in clinical computed
tomography images of the lung. For this segmenta-
tion, the convolutional neural network known as UNet
(Ronneberger et al., 2015) was used. In the training
process, the network was submitted to different train-
ing tests, in which for each one of them, its hyper-
parameters were modified so that the results could
be collected from different means, obtaining consid-
erable results, considering that the segmentation of
the carcinogenic nodules had good results, efficiently
segmenting them.
This article is divided into 5 sections. Section 2
consists of a summary of the literature. Section 3
deals with the methodology and its steps along with
the database description. In section 4, in turn, the re-
sults are described. And finally we present the con-
clusion in section 5.
2 RELATED WORK
A hybrid approach to medical ultrasound image seg-
mentation is presented by (Gupta and Anand, 2017),
which utilizes the spatially constrained core fuzzy
cluster capabilities and the active contour method us-
ing the DRLS (regularized distance) function. The re-
sult obtained from fuzzy kernel clustering is used, not
just to initialize the scatter curve to identify the esti-
mate. Region or object boundaries, but also helps to
estimate the optimal parameters responsible for con-
trolling the evolution of the level set.
In the work of (Bi et al., 2017), it demonstrates the
use of fully convolutional networks to automatically
segment skin lesions. Produce segmentation bound-
aries for challenging skin lesions (for example, those
with diffuse boundaries and / or low foreground and
background difference) through a multistage segmen-
tation approach in which multiple fully convolutional
networks learn complementary visual characteristics
of different skin lesions.
Continuing the dermatological segmentation, (Lin
et al., 2017) presents, examines and compares two dif-
ferent approaches to the segmentation of skin lesions.
The first approach uses U-Nets and introduces a pre-
processing step based on histogram equalization. The
second approach is cluster-based C-Means, which is
much simpler to implement and faster to execute.
The work of (Al-Masni et al., 2018) proposes a
new segmentation methodology through full resolu-
tion convolutional networks (FrCN). The proposed
FrCN method directly learns the full resolution capa-
bilities of each individual input data pixel without the
need for pre processing or post-processing operations
such as artifact removal, low contrast adjustment, or
further improvement of segmented skin lesion bound-
aries.
3 METHODOLOGY
This section aims to describe the method covered in
this article, consisting of three steps, in which these
steps are described in detail throughout the text, along
with the metrics chosen to assess the capability of the
method described. The first step is to read the training
dataset, after which begins the second step in which
UNet neural network training is performed.
3.1 Dataset Description
The images used to construct this work come from
the database named The Lung Image Database Con-
sortium image collection - LIDC-IDRI (Armato III
et al., 2015), (Armato III et al., 2011), (Clark et al.,
2013), which consist of diagnostic computed tomog-
raphy scans and screening for injured lung CA, where
they are marked and stored, generating a total of 1018
examined cases. This data set was initiated by the Na-
tional Cancer Institute (NCI), enhanced by the Foun-
dation for the National Institutes of Health (FNIH),
and monitored by the Food and Drug Administration
(FDA).
Eight medical imaging companies and seven aca-
demic centers collaborated to create this dataset. Each
patient includes images from a clinical thoracic CT
and an associated XML file that stores the results of
an image analysis and annotation process, thus form-
ing a DICOM format file built by four experienced
thoracic radiologists. These images can be seen in
Figure 1.
The analyzes are performed in two steps, the first
one being the cameras, where each radiologist re-
views and classifies the image into three possible cate-
gories: ≥ 3mm node, < 3mm node and ≥ 3mm node.
In the subsequent non-blind reading phase, each radi-
ologist independently reviewed his or her own marks,
along with the anonymous marks of the other three
radiologists, and finally issued a final opinion. The
aim of this process was to identify all lung nodules in
Use of Convolutional Neural Networks for Detection and Segmentation of Pulmonary Nodules in Computed Tomography Images
293
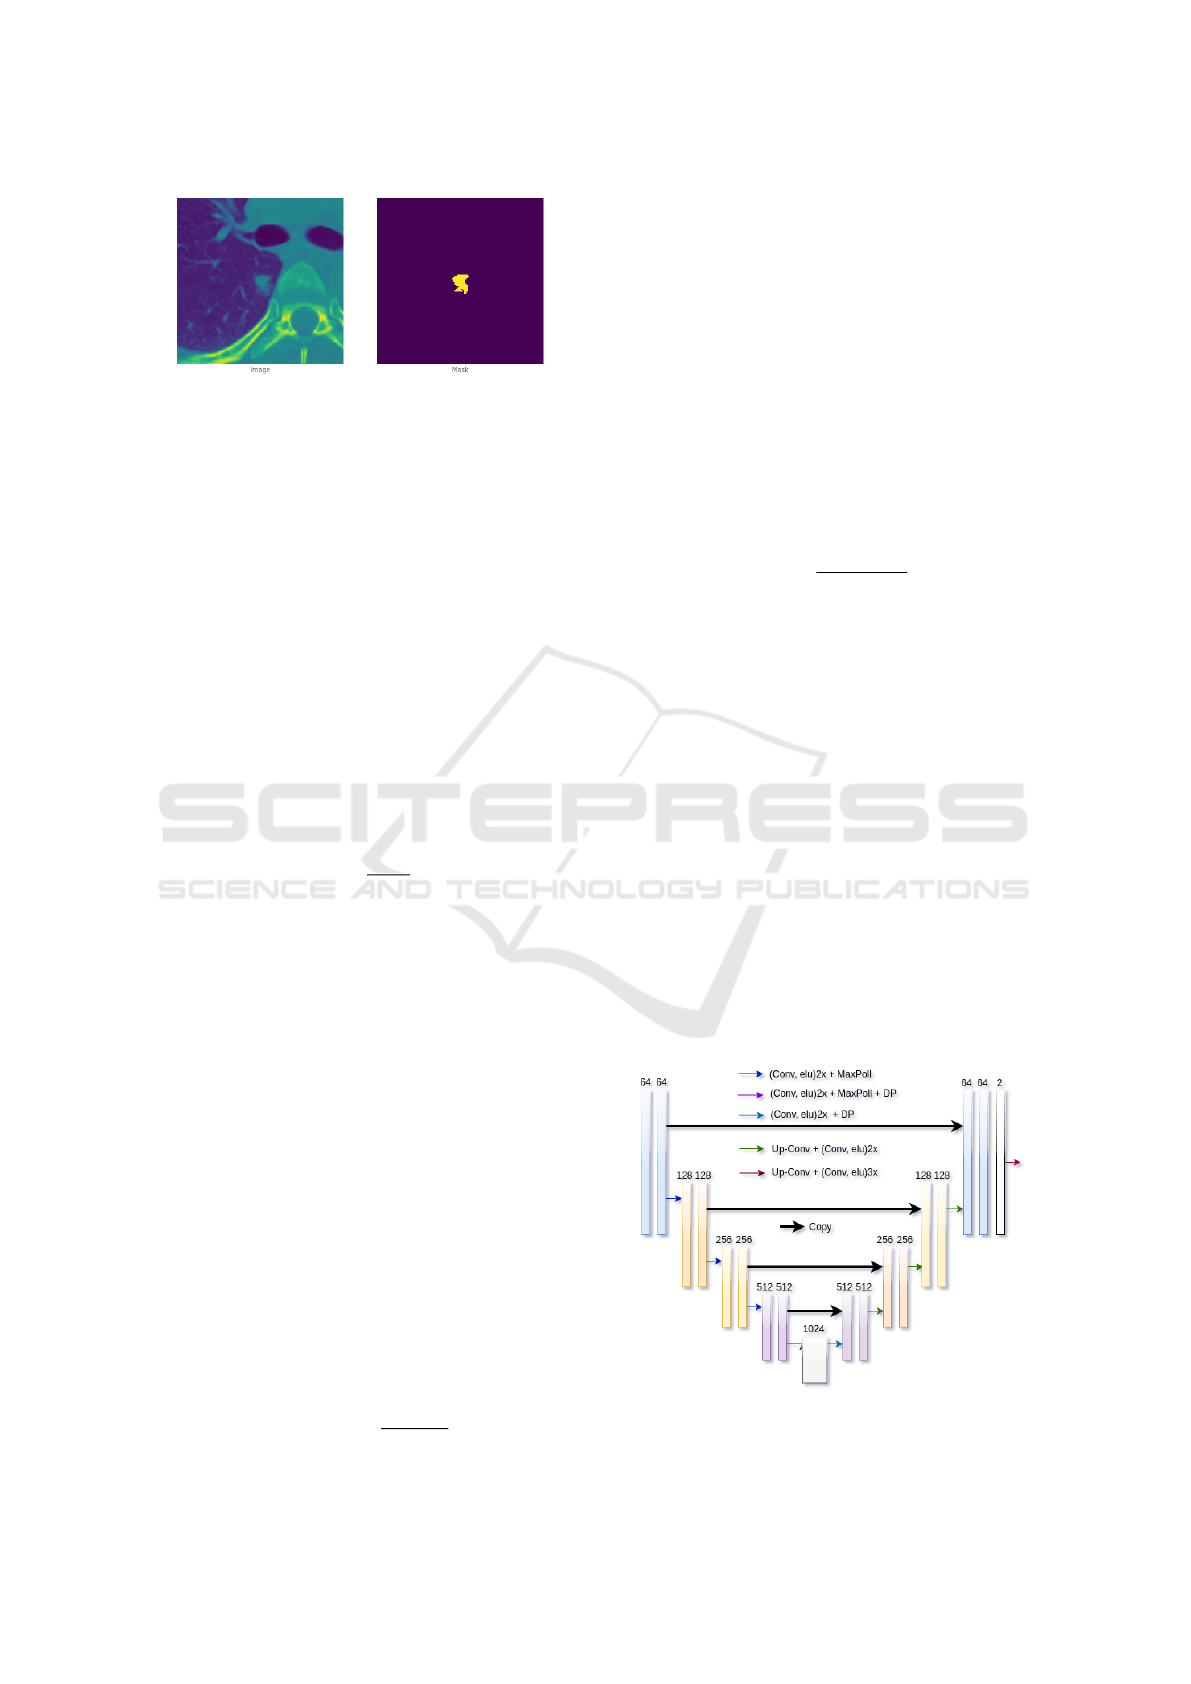
Figure 1: Image and Mask Example.
each CT scan as truly as possible without the need for
forced consensus.
3.2 Evaluation Metrics
To compare the performance of different tests, three
different metrics were used for evaluation, namely:
Intersection over Union (IoU), Dice Coefficient and
True Positive Rate.
3.2.1 Intersection over Union (IoU)
The IoU, also known as Jaccard index, is essentially
a method for quantifying the percentage overlap be-
tween the target mask and the forecast output. This
metric is closely related to the data coefficient, which
is often used as a loss function during training.
IoU =
A ∩ B
A ∪ B
(1)
Its formula is given according to 1, where A con-
tains the true representation and B represents the pre-
dicted segmentation by the network, so the number
of common pixels between the target and prediction
masks is divided by the total number of pixels present
in both masks (J
´
egou et al., 2017).
3.2.2 Dice Coefficient
The coefficient coefficient is commonly used to eval-
uate the performance of image segmentation meth-
ods. The formula is given according to the equation 2,
where it calculates the proportion of the intersection
area divided by the sum of the mean of each individ-
ual area, ie A represents a set containing the true rep-
resentation, while B represents calculated targeting on
network (Shamir et al., 2019). Therefore, the number
of true positives is the total number of positives that
can be found and the number of false positives is the
number of negative points that your method classifies
as positive.
Dice(A, B) =
2|A · B|
|A| + |B|
(2)
Data scoring is not only a measure of how many
true positives you find, but also penalizes the false
positives the method finds, similar to accuracy, the
only difference is the denominator, where you have
the total number of positives instead of only the posi-
tives found by the method.
3.2.3 True Positive Rate
In machine learning, true positive rate, also called
sensitivity or recall, is used to measure the percentage
of actual positives that are correctly identified. Your
calculation is defined by the number of correct posi-
tive predictions divided by the total number of posi-
tive (Nisbet et al., 2018).
T PR =
T P
(T P + FN)
(3)
Given the equation 3, which demonstrates the true
positive rate calculation, where T P is the number of
true positive cases and FN is the number of false neg-
ative cases.
3.3 UNet Architecture and Training
UNet is a deep learning architecture network that is
widely used for medical image segmentation, first
proposed by (Ronneberger et al., 2015). Its architec-
ture is divided into two parts: encoder and decoder.
The encoder is defined through multiple convolution
layers on the network so you can get different lev-
els of image characteristic. The decoder performs the
multi-layer deconvolution process to obtain the fea-
ture map at each higher level, and combines different
feature levels in the rescheduling process to restore
feature maps to the image size of original entry and
complete semantic segmentation of the image.
Figure 3: UNet Architeture.
BIODEVICES 2020 - 13th International Conference on Biomedical Electronics and Devices
294
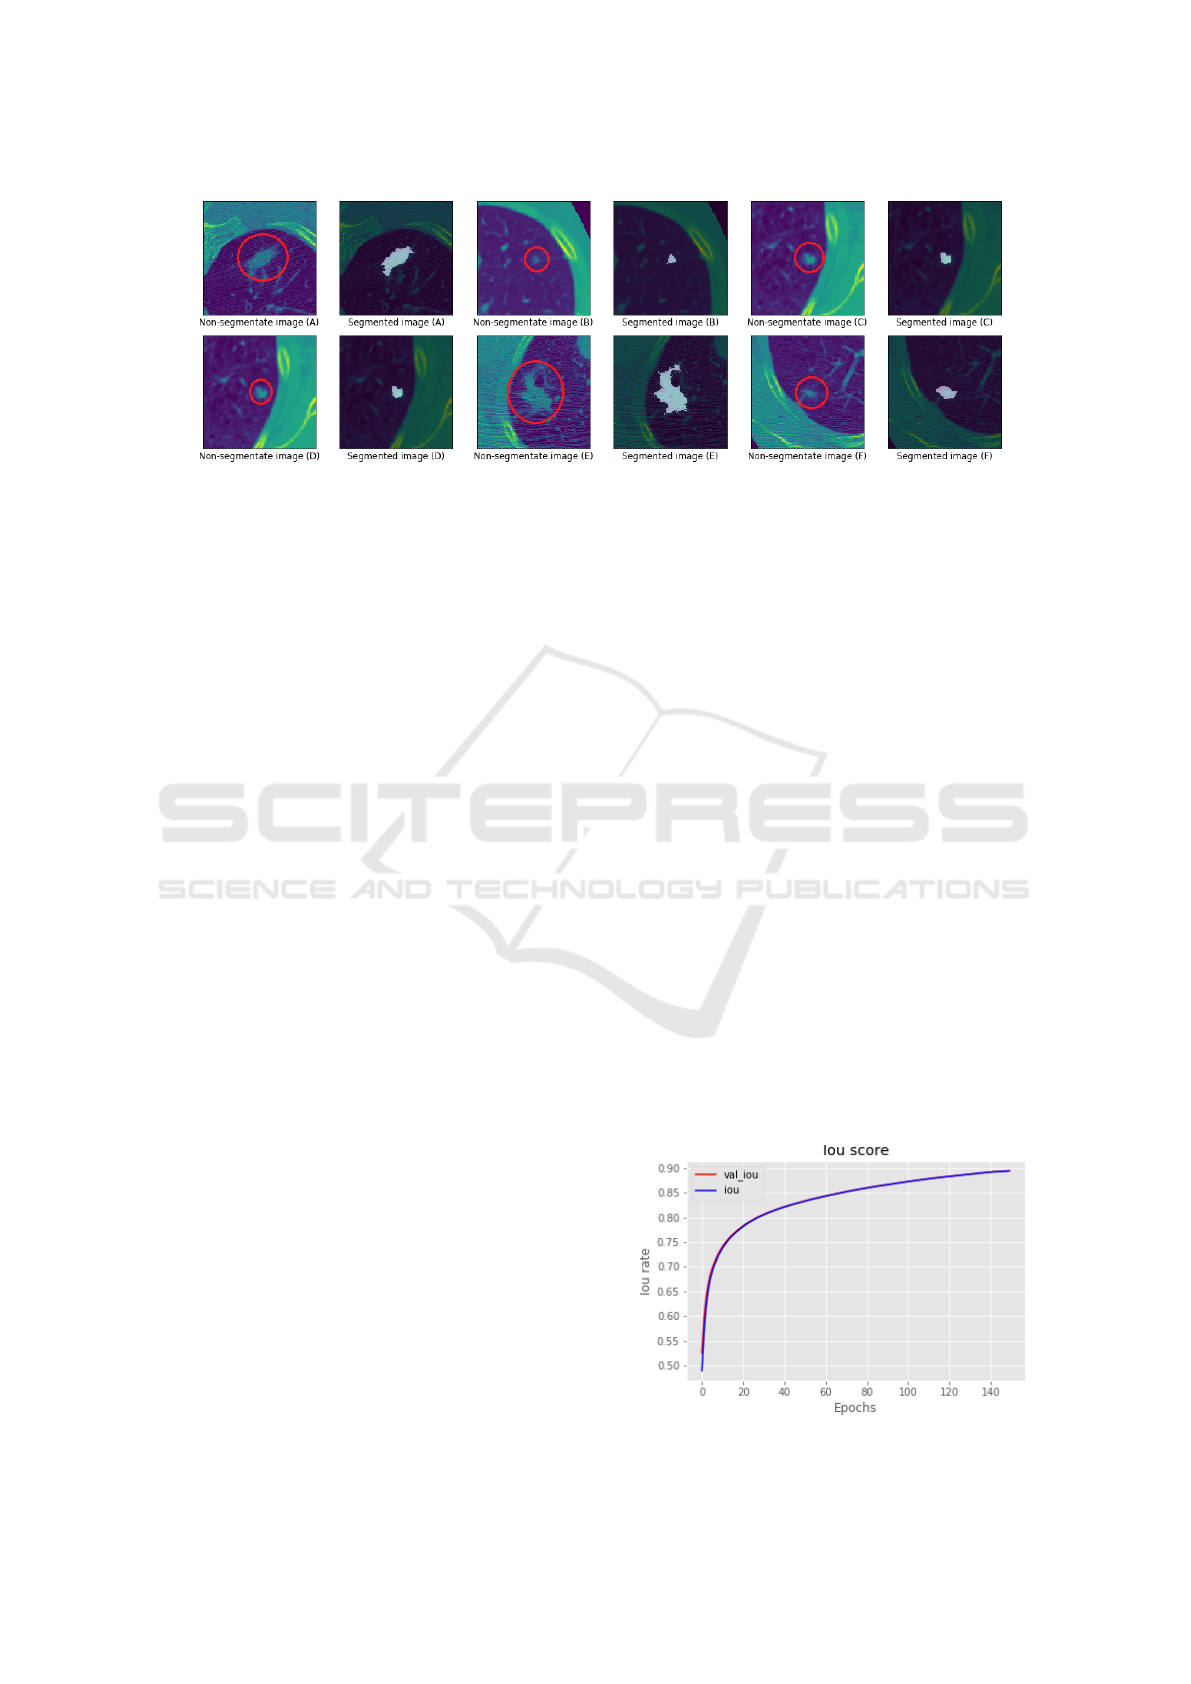
Figure 2: Segmentation samples made by the UNet network proposed in this article. For each image labeled A-F, such as
image A, has its segmentation on the right side.
In this work, the architecture of the UNet network
used to perform image segmentation can be seen in
figure 3. In the proposed model, the encoder has
an initial layer in which it contains two convolution
layers, followed by the Elu activation function and
a MaxPooling layer, where this segment is arranged
until the next to the last convolution block. The last
block of the encoder contains two convolution layers
with the Elu activation function, a MaxPooling layer
and a 0.5 dropout layer. The decoder has a block con-
taining one UpSampling layer, two convolution lay-
ers, in which this configuration model holds until the
second to last block of the decoder. The final layer
of the application model is composed of an UpSam-
pling layer, containing three convolution layers, with
the sigmoid output function.
To perform the training, the dataset was divided
into two parts, training and testing. For training, 70%
of the entire dataset was used, while for testing, 30%
was used. The training was performed by Google Co-
lab Notebook, which is a free platform with compu-
tational capabilities to create and test machine learn-
ing models. In the training process, the network was
submitted to different training tests, in which for each
one of them the hyperparameters were modified so
that the results could be collected from different me-
dia. In all tests the same Adam optimizer and three
different metrics were used to measure model perfor-
mance. The results obtained, as well as the training
time for each test can be seen according to table 5.
4 RESULTS
In this section, we show the results obtained for each
step of the segmentation model used to detect thoracic
nodules, analyzing the metrics used to validate the
model, as well as the training modes it was submit-
ted to.
All processing of the proposed methods was per-
formed by an Nvidia T4s graphics card, which has
3584 CUDA cores, 16 GB of dedicated graphics
memory. The RAM used was 25 GB and a x gener-
ation core ix processor. The training time consumed
by the methods proposed in this work can be seen ac-
cording to the table 5, where it can be seen that the
greater the number of times performed for the train-
ing of the algorithm, the greater will be the resources
used by machine.
The results of the predicted segmentation by the
UNet network can be observed according to the fig-
ure 2. In the images in which it contains a red circle,
it corresponds to the node that should be segmented,
while the image to its right, is the segmentation pro-
vided by the model proposed in this work. It is noted
that the performance on segmentation of the cancer-
ous nodule present in the images were almost per-
fectly segmented.
The results obtained by this model can be seen ac-
cording to the table 5. From it, It can be observed
that the network was submitted to four types of tests,
and for each one of them, their hyper-parameters were
modified in each situation, and different results were
obtained. In all tests the same optimizer was used.
Figure 4: IoU score.
Use of Convolutional Neural Networks for Detection and Segmentation of Pulmonary Nodules in Computed Tomography Images
295
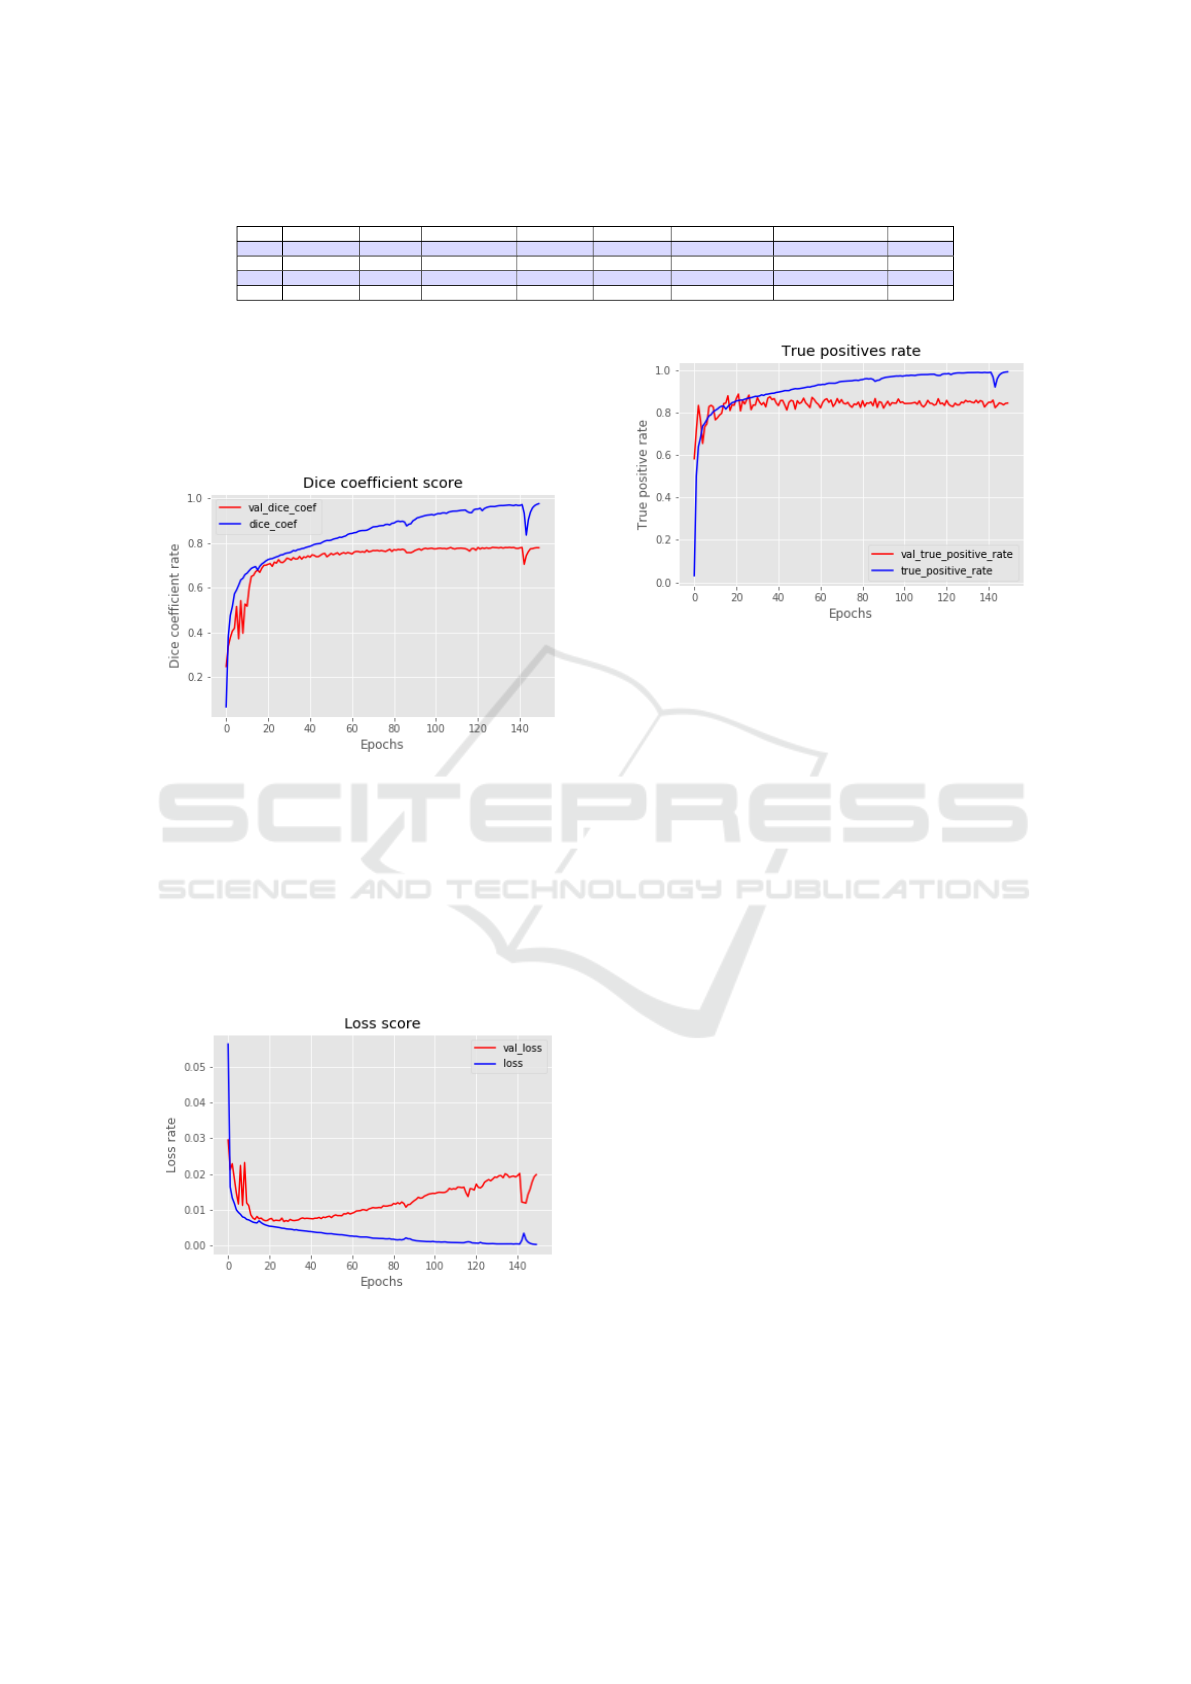
Table 1: Neural network performance measures.
Test Optimizer Epochs Learning rate Batch size Iou metric Dice coefficient True positive rate Time
1 Adam 50 1e-4 16 0.8606 0.7734 0.8444 64 min
2 Adam 80 2e-4 32 0.8858 0.7810 0.8213 102 min
3 Adam 130 2e-4 32 0.9161 0.7826 0.8317 166 min
4 Adam 150 1e-4 64 0.9050 0.7888 0.8453 192 min
The model configuration that corresponds to test 3
was the one with the highest IoU scores compared to
the others. From this, different evolution graphs were
plotted for each type of metric used to evaluate the
model.
Figure 5: Dice coefficient score.
The graphs in the figures 4 and 5 correspond to
the evolution of training calculated by the IoU and
dice coefficient metrics. In them, the hit rates of the
segmentation produced by the network will be calcu-
lated, compared to the expected segmentation. From
these results, it can be concluded that the performance
of the network was very positive in the task of seg-
menting the thoracic nodules.
Figure 6: Loss rate.
The network loss rate is shown in the figure 6 and
the true positives rate graph is shown in the figure 7,
representing for each one its full evolution over the
training seasons.
Figure 7: True positive rate chart.
5 CONCLUSION
A CNN was successfully implemented and applied
for the task of detection and segmentation of pul-
monary nodules in clinical computed tomography im-
ages. Four types of implementation of the UNet net-
work were performed, among them the best imple-
mentation was that of test 3, with the results of the
IoU Metric, Dice Coefficient, and True Positive Rate
with 91.61%, 78.26%, 83.17% respectively. In future
studies new models could be tested along with new
methods to have even better results than presented in
this article.
ACKNOWLEDGEMENTS
The elaboration of this work would not have been
possible without the collaboration of the Engineering
and Decision Support Research Center (GECAD) of
the Institute of Engineering, Polytechnic Institute of
Porto, Portugal and FAPEMA.
REFERENCES
Al-Masni, M. A., Al-antari, M. A., Choi, M.-T., Han, S.-
M., and Kim, T.-S. (2018). Skin lesion segmentation
in dermoscopy images via deep full resolution convo-
lutional networks. Computer methods and programs
in biomedicine, 162:221–231.
BIODEVICES 2020 - 13th International Conference on Biomedical Electronics and Devices
296

Armato III, S. G., McLennan, G., Bidaut, L., McNitt-Gray,
M. F., Meyer, C. R., Reeves, A. P., Clarke, L. P.,
et al. (2015). Data from lidc-idri. the cancer imaging
archive. DOI http://doi. org/10.7937 K, 9:7.
Armato III, S. G., McLennan, G., Bidaut, L., McNitt-Gray,
M. F., Meyer, C. R., Reeves, A. P., Zhao, B., Aberle,
D. R., Henschke, C. I., Hoffman, E. A., et al. (2011).
The lung image database consortium (lidc) and image
database resource initiative (idri): a completed refer-
ence database of lung nodules on ct scans. Medical
physics, 38(2):915–931.
Bi, L., Kim, J., Ahn, E., Kumar, A., Fulham, M., and Feng,
D. (2017). Dermoscopic image segmentation via mul-
tistage fully convolutional networks. IEEE Transac-
tions on Biomedical Engineering, 64(9):2065–2074.
Clark, K., Vendt, B., Smith, K., Freymann, J., Kirby, J.,
Koppel, P., Moore, S., Phillips, S., Maffitt, D., Pringle,
M., et al. (2013). The cancer imaging archive (tcia):
maintaining and operating a public information repos-
itory. Journal of digital imaging, 26(6):1045–1057.
Drozdzal, M., Chartrand, G., Vorontsov, E., Shakeri, M.,
Di Jorio, L., Tang, A., Romero, A., Bengio, Y., Pal,
C., and Kadoury, S. (2018). Learning normalized in-
puts for iterative estimation in medical image segmen-
tation. Medical image analysis, 44:1–13.
Gupta, D. and Anand, R. (2017). A hybrid edge-based seg-
mentation approach for ultrasound medical images.
Biomedical Signal Processing and Control, 31:116–
126.
J
´
egou, S., Drozdzal, M., Vazquez, D., Romero, A., and Ben-
gio, Y. (2017). The one hundred layers tiramisu: Fully
convolutional densenets for semantic segmentation. In
Proceedings of the IEEE Conference on Computer Vi-
sion and Pattern Recognition Workshops, pages 11–
19.
Lin, B. S., Michael, K., Kalra, S., and Tizhoosh, H. R.
(2017). Skin lesion segmentation: U-nets versus clus-
tering. In 2017 IEEE Symposium Series on Computa-
tional Intelligence (SSCI), pages 1–7. IEEE.
Nisbet, R., Miner, G., and Yale, K. (2018). Chapter 11
- model evaluation and enhancement. In Nisbet, R.,
Miner, G., and Yale, K., editors, Handbook of Statis-
tical Analysis and Data Mining Applications (Second
Edition), pages 215 – 233. Academic Press, Boston,
second edition edition.
Ronneberger, O., Fischer, P., and Brox, T. (2015). U-net:
Convolutional networks for biomedical image seg-
mentation. In International Conference on Medical
image computing and computer-assisted intervention,
pages 234–241. Springer.
Saraiva, A., Ferreira, N., Sousa, L., Carvalho da Costa, N.,
Sousa, J., Santos, D., and Soares, S. (2019a). Classi-
fication of images of childhood pneumonia using con-
volutional neural networks. In 6th International Con-
ference on Bioimaging, pages 112–119.
Saraiva, A., Melo, R., Filipe, V., Sousa, J., Ferreira, N. F.,
and Valente, A. (2018). Mobile multirobot manipula-
tion by image recognition.
Saraiva, A. A., Santos, D. B. S., Costa, N. J. C., Sousa, J.
V. M., Ferreira, N. M. F., Valente, A., and Soares, S.
F. S. P. (2019b). Models of learning to classify x-ray
images for the detection of pneumonia using neural
networks. In BIOIMAGING.
Shamir, R. R., Duchin, Y., Kim, J., Sapiro, G., and Harel,
N. (2019). Continuous dice coefficient: a method for
evaluating probabilistic segmentations. arXiv preprint
arXiv:1906.11031.
Siegel, R. L., Miller, K. D., and Jemal, A. (2019). Cancer
statistics, 2019. CA: a cancer journal for clinicians,
69(1):7–34.
Vardhana, M., Arunkumar, N., Lasrado, S., Abdulhay, E.,
and Ramirez-Gonzalez, G. (2018). Convolutional
neural network for bio-medical image segmentation
with hardware acceleration. Cognitive Systems Re-
search, 50:10–14.
Wang, G., Li, W., Zuluaga, M. A., Pratt, R., Patel, P. A.,
Aertsen, M., Doel, T., David, A. L., Deprest, J.,
Ourselin, S., et al. (2018). Interactive medical image
segmentation using deep learning with image-specific
fine tuning. IEEE transactions on medical imaging,
37(7):1562–1573.
Xue, Y., Xu, T., Zhang, H., Long, L. R., and Huang, X.
(2018). Segan: Adversarial network with multi-scale
l 1 loss for medical image segmentation. Neuroinfor-
matics, 16(3-4):383–392.
Use of Convolutional Neural Networks for Detection and Segmentation of Pulmonary Nodules in Computed Tomography Images
297
