
Memorable and Emotional Media Moments: Reminding Yourself of
the Good Things!
Teresa Chambel and Pedro Carvalho
LASIGE, Faculdade de Ciências, Universidade de Lisboa, Portugal
Keywords: Interactive Media Content, Wellbeing, Emotions, Positive Computing, Self-assessment, Sensors,
Multimodality, Happiness Jar, Personal Journal.
Abstract: Experiencing digital media content is among the most accessible and beloved recreational activities people
indulge in. It can promote learning and creative thinking, as well as being an important source of
entertainment, with a great impact in our emotions. In particular, it has the power to foster positive emotions
and attitudes, to regulate or enhance our mood, contributing to our general sense of wellbeing and quality of
life. This paper discusses and explores the potential of media and how it can be addressed to create a tool to
help individuals become more aware of their emotions and promote their psychological wellbeing. It
discusses main motivation and background and presents EmoJar, an interactive web application designed
and developed to allow users to collect and relive media that have significant impact and remind them of the
good things they experience along time in their lives. EmoJar is based on the Happiness Jar concept,
enriched here with media and its emotional impact, as an extension to Media4WellBeing, aligning with the
goals and approaches of Positive Psychology and Positive Computing. User evaluation results were very
encouraging in terms of perceived usefulness, usability and user experience. Future work will lead us further
in the aim to provide a useful and interesting digital experience that further supports users in their journey of
personal awareness and development.
1 INTRODUCTION
Accessing and consuming digital media content that
we treasure has never been so easy and quick to do.
Watching videos (from short clips, to full movies),
listening to audio (like podcasts, audio books, or
music), surveying images (like memes and photo-
graphs of awe-inspiring landscapes), and reading
text (factual, or literary) are among the most
accessible and beloved recreational activities.
Besides promoting learning, improving cognition,
endorsing creative thinking, aiding in productivity,
and generally being great sources of entertainment,
media has a great impact in our emotions (Oliveira
et al., 2013). In particular, it has the power to foster
positive emotions and attitudes, to regulate or
enhance our mood, contributing to our general sense
of wellbeing and quality of life (Bernardino et al.,
2016; Kok et al., 2013).
In this paper, we review main concepts and
related work as a background to help understand this
power, and how we can support users becoming
more aware, and regulating their emotions with
media through the EmoJar. We describe this
interactive web application designed and developed
as an extension to Media4WellBeing (Bernardino et
al., 2016) based on the Happiness Jar concept, to
collect and remind users of the good things they
experience along time, enriched with emotionally
impactful and memorable media, and supported by
sensors and self-report. It aligns with the approaches
of Positive Psychology and Positive Computing with
the ultimate goal of contributing to individuals’
psychological wellbeing and development. The
evaluation allowed validating the concept and the
design options; and the results revealed users’
interest and appreciation contributing to identify and
confirm preferred features, usability aspects and
future directions.
2 BACKGROUND
We present main concepts, goals and approaches
relevant in media support for wellbeing, as a back-
ground and context for our work and contributions.
86
Chambel, T. and Carvalho, P.
Memorable and Emotional Media Moments: Reminding Yourself of the Good Things!.
DOI: 10.5220/0009178300860098
In Proceedings of the 15th International Joint Conference on Computer Vision, Imaging and Computer Graphics Theory and Applications (VISIGRAPP 2020) - Volume 2: HUCAPP, pages
86-98
ISBN: 978-989-758-402-2; ISSN: 2184-4321
Copyright
c
2022 by SCITEPRESS – Science and Technology Publications, Lda. All rights reserved

2.1 Wellbeing, Positive Psychology and
Positive Computing
According to Dodge et al. (2012), coming up with a
single definition of wellbeing can be quite
challenging. But overall, one can say that wellbeing
is having the physical, psychological and social
resources necessary to meet a particular physical,
psychological or social challenge.
Positive Psychology focuses on the psycholo-
gical component of wellbeing (Seligman et al.,
2005). Established by Seligman in 1998 out of
frustration with Psychology’s narrow focus on
negative aspects and disfunctions, requiring to be
solved and cured. This newer perspective posits that
individuals should learn to embrace a more positive
perspective, which could lead to significant shifts
with impact on wellbeing and happiness. In one of
his studies (Seligman et al., 2005) on gratitude,
participants wrote down 3 things that went well each
day, and why, every night, for one week. This
greatly and lastingly contributed to individuals’
psychological wellbeing, suggesting that 1) the more
we shift our focus away from negativity, the happier
we will be, and that 2) reflecting on the good things
that happen to us contributes to our psychological
wellbeing. The EmoJar intends to support this
attitude with digital media.
Positive Computing is a related field, founded by
Calvo and Peters in 2014 (Calvo and Peters, 2014),
centered upon the design and development of
technology that supports psychological wellbeing
and human potential. It posits 3 approaches: 1) the
preventative approach, where technology is redesi-
gned to address or prevent detriments to wellbeing;
2) the active approach, where it is designed to
consider and promote the wellbeing of individuals
(the one adopted in our work); and 3) the dedicated
approach, where technology is created and totally
dedicated to promoting wellbeing.
2.2 The Happiness Jar
The Happiness Jar concept is about giving its users
the chance to collect and remind themselves of all
the good things that come out in their life (e.g. every
day for a year). The traditional ones are based on a
physical jar (often made of glass with a lid) where
individuals place small papers scribbled with things
that made them happy, proud, or grateful, to be read
on special occasions (e.g., New Year or birthday), or
when its owners feel like they need to be reminded
of the good things in their lives. In spite of its
simplicity, the idea behind this tool is quite power-
ful, aligning with Seligman’s (2005) and related
research on wellbeing and positive emotions. The
Happiness Jar not only serves as a great time capsule
of life’s best, but may also promote individuals’
psychological wellbeing. However, the traditional
analog physical jar is limited in its ability to support
users, in terms of flexibility, portability, media
types, organization, search, access, and emotional
awareness.
In digital apps like HappiJar (Cooper, 2014), Jar
of Awesome (JarAwe-ref), and The Happiness Jar
(TheHappiJar-ref), users can write down and collect
happy moments in a digital jar, and optionally
associate photos or music to them. Happiness Jar
and Jar of Awesome allow categorization of happy
moments. Jar of Awesome allows access in a
timeline, while HappiJar supports shared jars and the
possibility to shake to get a random jar entry. Not in
the form of jars: HappyFeed (HappyFeed-ref) and
Applied Happiness (2016) apps are daily journals to
register positive moments, thoughts or memories
with optional photos and locations. These projects
allow users to register what makes them happy, but
do not explore the power of media to do so, media
being an optional add-on. On the other hand in
approaches like Cove (Humane, 2015-19), media is
central but from the perspective of the creator; users
create small loops of music to help them express
how they feel in a safe, positive environment, and it
does not also support detecting user’s emotions.
2.3 Media Impact on Emotions and
Psychological Wellbeing
Media consumption (of video, audio, images, and
text) takes a significant share of our waking hours,
making media impact concerns increasingly rele-
vant. Most research has focused on detrimental
effects but, more recently, research has started to
explore potential benefits. It can e.g. provide relief
from stress and daily hassles, or facilitate recovery
after a long day (Reinecke, 2011). It can also: have
us reflect upon moral virtues and the purpose of life;
impel us to be more altruistic, empathetic, compas-
sionate, tolerant, and let go of feelings of resent-
ment; make us experience a range of emotions; and
help us be more appreciative of our life, and grateful
for the good things in it.
In spite of the emotional impact of media and its
potential to foster improved psychological well-
being, most work does not allow users to access,
visualize, explore, save and later relive media based
on this impact (Oliveira et al., 2013; Bernardino et
al., 2016). In our own work: in iFelt (Oliveira et al.,
Memorable and Emotional Media Moments: Reminding Yourself of the Good Things!
87

2013), users were given the ability to access,
explore, and visualize videos classified according to
the emotions felt (using biosensors and 5 out of 6
basic emotions by Ekman (1992)); MovieClouds
(Chambel et al., 2013) allowed to access, explore
and watch movies based on their content, mainly
audio and subtitles, and with a focus on emotions
expressed in the subtitles, in the mood of the music,
and felt by the users, like in X; in Media4WellBeing
(Bernardino et al., 2016) we took a step further to
include other media, a richer emotional model, and
the sense of wellbeing. More recently, it also
allowed users to add personal tags and self-
assessment in meditative states (Martins et al.,
2018); but not emotions, and no information about
why media made them experience those emotions or
improved their wellbeing, for increased awareness
and to recall in future accesses - like we now
included in EmoJar, to combine the ability to
consume media based on the emotional impact with
the strength of journals and jars.
3 EMOJAR
EmoJar is an interactive media application that is
based on the concept of the Happiness Jar, where
individuals typically collect and recall in small
papers things that made them happy, proud or
grateful for, now enriched with media and their
emotional impact. It has been designed and develo-
ped to let its users save, access, explore, and relive
media that was impactful and that they believe to
have positively contributed to their psychological
wellbeing. Users can rely on the emotional impact
based on biosensors and self-assessment, by
registering their personal perception and reflections
about the impact of the media and the associated
memories making it worth keeping in the jar, to be
relived. What follows is a presentation of EmoJar
characteristics and features, namely: its emotion
model and detection methods, how to collect and
relive media, how to filter the EmoJar for particular
entries, how one may interact with it, and what one
may learn from using it.
3.1 Emotions: Power, Models and
Detection
Emotions can be classified as positive or negative.
Positive emotions have been shown to foster
improved health, coping ability, physical and
psychological wellbeing, social relationships, work
life, and even income. They also enhance cognitive
capacities and creative problem solving; whereas
negative emotions, which narrow the individual’s
repertoire of thought and action, have a valuable
survival strategy, but have been shown to be
detrimental to physical and psychological health and
many other aspects of life (Chambel et al., 2011;
Kok et al., 2013). Emotion valence (polarity: posi-
tive-negative) is one important dimension, and along
with arousal (intensity) define the Dimensional
Model of emotions (Russell, 1980) in a spatial 2D
circumplex. The Categorical Model defines emo-
tions as discrete states, and can be represented in the
dimensional model.
In (Bernardino et al., 2016), we present more
details about models of emotions and wellbeing, and
describe the model we adopted in Media4Well-
Being, the same now in the EmoJar. It extends basic
emotions from Ekman (1992) and Plutchik’s (1980)
(adopting his color choices), aiming at: 1) emotional
richness; 2) covering positive emotions associated
with media and wellbeing (e.g. Ekman only has one
positive emotion, insufficient in this context); and 3)
being simple enough to enable an automatic
identification of emotions, based on valence and
arousal.
Figure 1: Emotion color wheels in EmoJar.
Figs. 1 and 3 present the adopted model with
categorical emotions placed around Russel’s circum-
plex as a wheel of emotions. Fig.1 presents 3
versions. The first one adopts emotion colors from
Plutchik’s (1980), but since these models have
different dimensions, the colors do not make as
harmonious smooth transitions around the wheel as
in Plutchik’s. The second version adopts Plutchick’s
color wheel mapping to the emotions on our wheel,
with an harmonious color sequence; and the third
version adopts Geneva wheel (Sacharin et al., 2012),
also with smooth transitions but with dimensions
closer to our own. Although some color-emotion
mappings are more common than others, these tend
to be subjective and also dependent on culture.
Different options in EmoJar allow for flexible and
personalized settings. Users may choose their
favorite anytime (clicking on the current wheel on
the right top corner, e.g. Fig1) and the interface
adjusts to the new color mapping. This was
appreciated by the users in the evaluation, and even,
HUCAPP 2020 - 4th International Conference on Human Computer Interaction Theory and Applications
88
by some, the possibility of having users personali-
zing or painting their own wheels - being considered
for future work.
One of the challenges in these approaches refers
to how wellbeing and emotions can be measured,
besides from self-assessment. To a greater or lesser
extent, they tend to bring about physiological
changes, which can be detected and processed, using
sensors. We are using BITalino (for ECG and EDA)
and MUSE (for EEG) to detect emotions based on
valence and arousal, complemented with meditative
states (Bernardino et al., 2016; Martins et al., 2018).
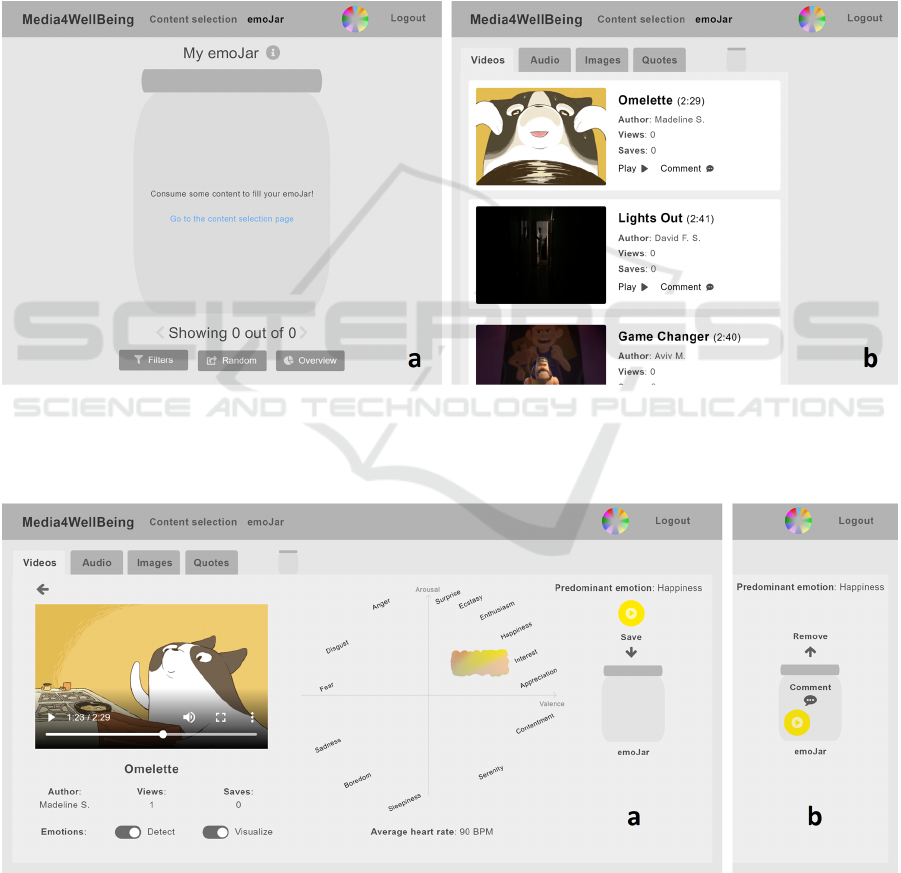
3.2 Collecting and Reliving Media
Users can collect media while browsing and
accessing it. If the EmoJar is accessed in its initial
empty state (Fig.2a), it prompts users to consume
some media in the content selection page (Fig.2).
Users may save content in the jar without consuming
it, pressing the icon to the right of its title (Fig.2b).
But at least they need to register what the content
means to them, in the “paper”/entry they save in the
jar, when there is no emotional information detected.
Fig.3 shows the case when there is an automatic
Figure. 2: Jar initial state - empty. (a) EmoJar invites users to consume content on the content selection page; (b) users can
access content items (e.g. videos) and play (Play icon) or save them in the jar (Comment icon); they can check how many
times this content was Viewed and Saved, the latter useful in situations when the same content was meaningful, possibly
with different emotions, and it is relevant to save it. A new jar entry is created for each time it is saved.
Figure 3: Content consumption and emotional evaluation. a) Each content (left) and its emotional evaluation (center, in
emoPaint view here) is represented by a circle (right) with dominant emotion color (detected or self-reported), with an icon
representing media type: users may comment to add self-assessment (Fig.3-Fig.5); and a/b) Save/Remove it as a jar entry.
Memorable and Emotional Media Moments: Reminding Yourself of the Good Things!
89
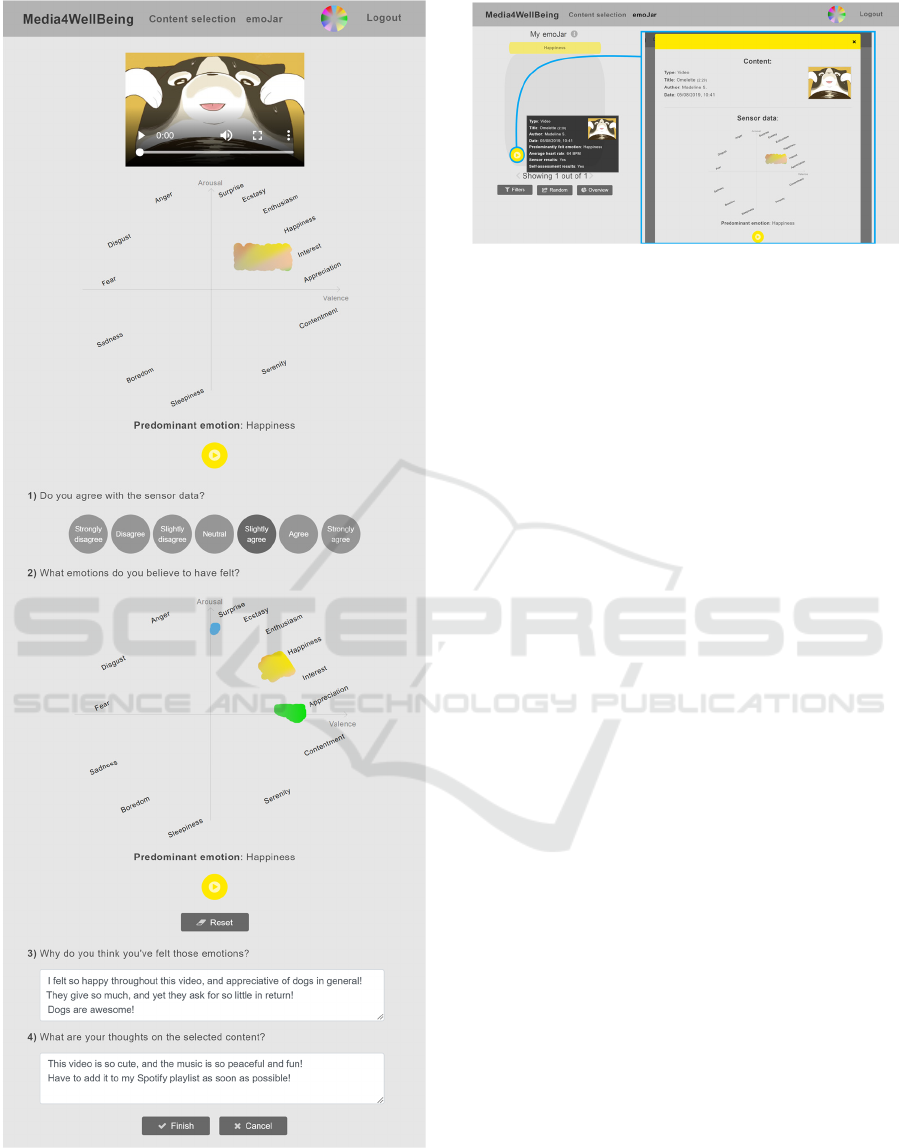
Figure 4: Entry in detail - content and detected emotions
(above); below: 1) level of agreement with detected
emotions; 2) self-reported emotions; 3) why user felt this
emotions; and 4) what user thinks about the video, what
makes it memorable.
Figure 5: Entry preview in the jar (left) before opening it
(right), when open is similar to Fig. 4, not editable in
viewing mode.
detection while consuming a video. Users get emo-
tional feedback (results provided by Media4Well-
Being with physiological sensors) that can be pre-
sented in the form of a painting in the emotion wheel
(emoPaint), a tag cloud (emoCloud), or a chart
(emoChart) (Bernardino et al., 2016), synchronized
with the video as it is being watched, or afterwards
(avoiding interfering with the watching) by
animation or final state. The users then have the
option to save (or remove) the selected content and
its emotional impact to their jar (Fig.3a/b), and to
further complement with information by self-
assessment (Fig.3b-Fig.4, and Fig.5 (right)).
In the paper/entry saved, besides the content that
provides context, and the detected emotions (in
emoPaint representation in Fig.4), users may
comment and report their self-assessment, by: 1)
rating how much they agree with the automatic
emotion recognition; 2) can draw their personal
perspective of how they felt; 3) comment on the felt
emotions; and 4) add their thoughts and perceptions
about the content, its emotional impact and the
associated memories making it worth keeping in the
jar. In Fig.4, the user agreed with the emotions
identified by Media4WellBeing (1), but there were
others (Surprise and Appreciation) that were
added/painted (2), explaining why these were felt
emotions (3), and commenting on how this video
was important and what made it memorable (4).
Once content has been consumed and saved or
commented upon, an EmoJar entry in the shape of a
circle (representing a crumpled paper, Fig.2) is
created, and can be retrieved and relived later on by
the user. The entry’s color is defined by the predo-
minantly felt emotion recognized by Media4Well-
Being or the users (in self assessment), the center
icon representing content type.
HUCAPP 2020 - 4th International Conference on Human Computer Interaction Theory and Applications
90
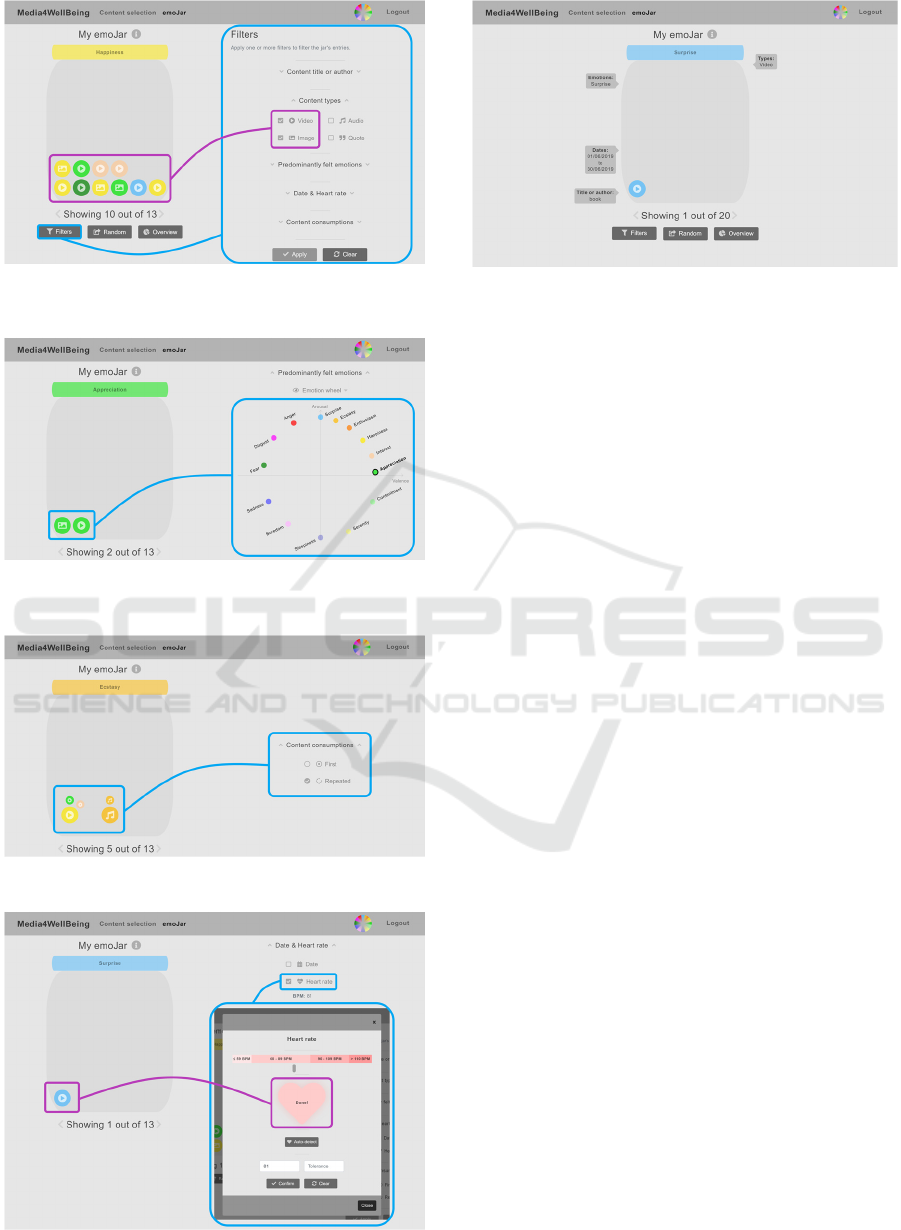
Figure 6: Jar filter in EmoJar. Filters (right); jar state after
applying content type filter for videos and images (left).
Figure 7: Jar state after dominant emotion filter for
Appreciation.
Figure 8: Filter for content with repeated saves.
Figure 9: Applying average heart rate filter.
Figure 10: Tooltips pop-up with filter options when filters
close.
This content entry, and whether it has associated
results/comments can be previewed on hover, and
reviewed/relived upon clicking (Fig.5). By way of
its color and label, the jar’s lid reflects which
emotion is more predominant in the jar.
3.3 Jar Filtering in Different
Perspectives
Along time, users’ jar starts to fill up and users may
also have in mind different properties to look for,
bringing about the need for filters, to allow users to
find and review contents that contributed to they
wellbeing in different ways (Fig.6-10). As presented
in Fig. 6, selecting the “Filters” option will show all
the filters in an overview with parameters hidden.
These will be revealed for each filter, when
selected: content type in the example, with video and
image selected in the check boxes. Figs. 7-10
exemplify other filters, with chosen parameters and
results. Currently, it is possible to filter entries by:
words in the title or the author; content type (video,
audio, image or quote); predominantly felt emotion
(selected in the emotion wheel in Fig.7); with or
without biosensor or self-assessment results
associated; first entry of all the content saved
(“First”) or all the entries of the same content that
were consumed and saved/collected more than once
(“Repeated”) because it made sense to save at
different times, possibly with a different emotional
impact and new comments (Fig. 8); date or time
interval when entries were collected (using a
calendar); and average heart rate (Fig. 9).
These filters can be selected separately or
combined. The jar then only shows matching entries
(Figs. 6-10). At any time, the lid of the jar adopts the
color and name of the dominant emotion in the set of
entries satisfying the filtering criteria.
Memorable and Emotional Media Moments: Reminding Yourself of the Good Things!
91
3.4 Multimodal Interaction
Multimodal interaction is being adopted for
flexibility, accessibility and its potential to increase
engagement and immersion (Serra et al., 2014) when
interacting with the jar and its contents.
Concerning heart rate filtering (Fig.9), we
designed and developed different modalities for
inserting a value (with a tolerance within its
vicinity): 1) text entry; 2) selecting a value on a
scale (a bar with different colors highlighting typical
values); 3) tapping the heart icon through mouse,
keyboard, or touch screen (as feedback the heart
updates the numeric value, and changes color,
according to the colored scale above); or 4) auto-
detecting users heartrate with sensor (placing finger
over the video camera on the mobile phone, it
measures image brightness variability, in accordance
with heart rate and subsequent blood pumping
reaching the finger). For their current heart rate, in
the absence of a sensor, users may e.g. press the
carotid artery to sense and try to tap the heart in the
interface (3) with the same frequency.
We also designed a feedback based on user’s
current heartbeat, e.g. in the rhythm of the emoPaint
output, or the rhythm of background color change
between two colors, or yet through haptic smart-
phone vibration, while a video is being watched, and
plan to consider other modalities in the future.
Janssen et. al. (2010) concluded that heartbeat
perception influences social behavior, promoting the
sense of closeness, as an intimate cue in immersive
virtual environments. Heartbeat communication was
also seen as a promising way to improve emotion
recognition with potential benefits on social
connectedness, health, and wellbeing. Their study
was done in the context of interpersonal
communication; we hypothesize that it can also be
beneficial on our own, for emotional self-awareness
and regulation.
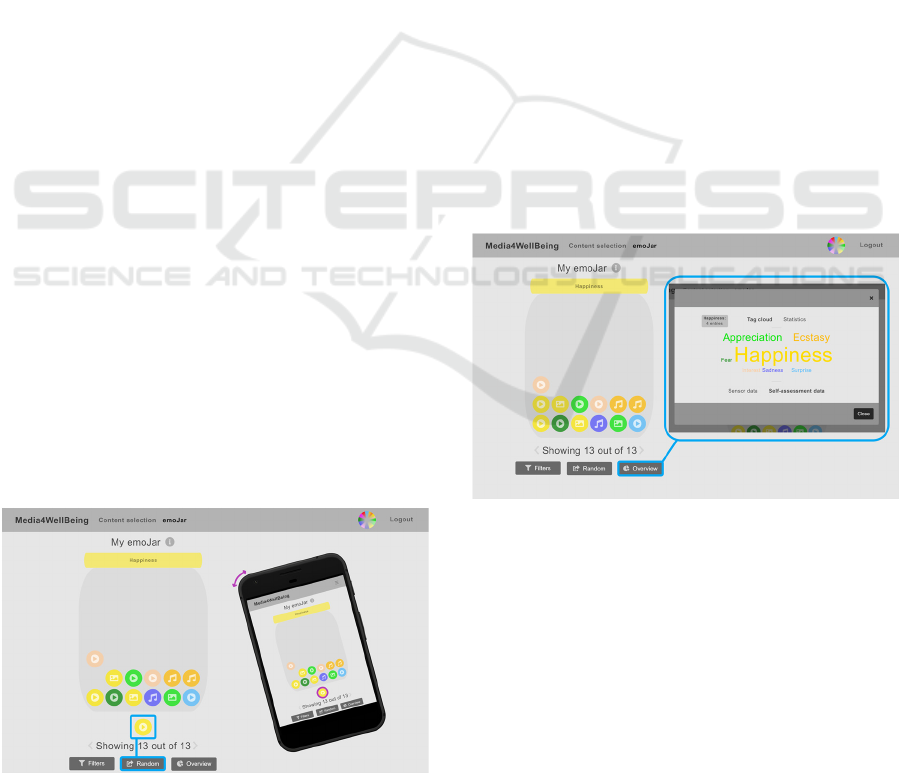
Figure 11: Get random jar entry: button (left), shaking
(right).
Another feature with multimodality is available
when the user desires to get a random EmoJar entry
(Fig.11): by pressing the “Random” button, or by
shaking the mobile device in the way suggested by
the “Pick random” button’s icon, which resembles a
mobile device being shaken. Doing so gets one
random EmoJar entry out of the jar, introducing a
flavor of serendipity (Chambel, 2011) creating the
chance to find a relevant unexpected content. Then it
is up to the user to preview and relive it (by clicking
on it).
3.5 Overviews for Self-awareness and
Learning
Users can get information about their media
consumption habits in EmoJar. This information can
add to the support of self-awareness that our
approach emphasizes, in a perspective of self-
development, along time. Users may, e.g., find out
what content types they consume the most, as well
as what emotions they have felt so far or throughout
time according to Media4WellBeing’s emotion reco-
gnition system and user self-assessment. Fig. 12
highlights a tagcloud view representing frequency of
dominant emotions in the jar content. Happiness is
more frequent in this example, being dominant in 4
of the 13 jar entries.
Figure 12: Overview of dominant felt emotions in jar’s
content. A tag cloud is presented, with “Happiness” as
most frequent one.
4 USER EVALUATION
The primary objective of this user evaluation was to
assess EmoJar usability and user experience through
perceived usefulness, satisfaction, and ease of use of
its functionalities. We also wanted to know the
users’ opinions, comments, and suggestions on the
features, interface and representations.
HUCAPP 2020 - 4th International Conference on Human Computer Interaction Theory and Applications
92

4.1 Methodology
This evaluation consisted of semi-structured
interviews and user observation while users carried
out previously defined tasks to test the different
features. First, the evaluation and system’s purpose
were explained, followed by a selection of
demographic questions to characterize the users,
who then performed the tasks, in the order listed in
Table 1. For each task, we 1) observed and noted
success, completion speed, errors and hesitations; 2)
asked users to rate the perceived usefulness,
satisfaction, and ease of use (based on USE (Lund,
2001)) of the tasks’ functionalities and
representations on a 5-point Likert scale; and 3)
gathered qualitative feedback as users’ comments
and suggestions. All tasks were executed on a
camera-equipped laptop, then on a smartphone, to 1)
know the impact of the screen size; and to 2) assess
the mobile-exclusive features (the vibration
feedback on content reproduction, and the “shake to
extract a random entry”).
In the end, users were asked to 1) make an
overall assessment of the system in terms of its
design, usefulness, satisfaction, ease of use, and
usability (SUS (Brooke, 1996)); 2) mention the
features and characteristics that positively stood out
to them; 3) make their final comments and
suggestions on what they would like to see improved
or added in the future; and 4) characterize the system
by selecting pre-defined terms that adequately
reflected its appeal and overall ergonomic and
hedonic qualities (Hassenzahl et al., 2000).
4.2 Participants
This evaluation had 10 participants, 5 male, 5 female
22-57 years old (Mean (M) 31.1, Std.Dev (SD)
12.6), all with higher education (1 PhD, 3 MSc, 6
BSc) in different areas (1 systems, 1 telecom and 1
electrical engineers, 1 highschool teacher, 1 human
resources manager, 1 multimedia designer, and 4 IT
graduates pursuing an MSc in Informatics),
moderate to high levels of digital literacy, and
having their first contact with EmoJar.
1) Digital media content impact: all 10
participants strongly agreed (5, in 1-5 Likert scale)
that digital content can make individuals experience
emotions; has the ability to evoke memories; and
that the experienced emotions can be a result of
these evoked memories .
2) Access digital content: using smartphone (10
every day); computer (2 every day (ed), 4 more than
1/week, 2 1/week, and 2 (occ)asionally); and tablet
(2 occ). Platforms: YouTube (5 ed, 3 >1/week, 2
occ); Netflix (4 ed, 3 >1/week, 2 occ); Spotify (2 ed,
6 >1/week); Instagram (4 ed); Pinterest (2 >1/week,
2 occ); Vimeo (4 occ), TED.com (3 occ); Crunchy-
roll (1>1/week); and Flickr (1 occ).
3) Motivation to access (1-5:“Strongly
disagree”-“Strongly agree”): be entertained (M:4.8,
SD: 0.4); feel more relaxed (M:4.2, SD:0.6); be
informed (M:3.5, SD:0.5); feel good (M:3.4,
SD:0.5); feel motivated (M:2.9, SD:1.1); be able to
deal with difficult situations (M:2.9, SD:1.1); feel
better about themselves (M:2.6, SD:1.1); feel more
creative (M:2.3, SD:1.2); be able to improve as a
person (M:2.3, SD:1.2); be able to work better
(M:2.2, SD:1.3); better know themselves (M:1.6,
SD:0.7); and positively influence others (M:1.3,
SD:0.5).
4) How and why digital content is saved: 9 save
in browser’s favorites; 6 in the playlist of the
platform used (e.g., YouTube, Spotify), and 5
download and store on computer (3) and smartphone
(2). They save it to: create a collection of contents
they enjoy (M:4.4, SD:0.5); consume later on
(M:4.1, SD:0.3); share later on (M:3.2, SD:0.9);
because they symbolize a moment of their lives
(M:3, SD: 0.9); to later change their mood (M:2.4,
SD:0.9); to reminisce about them later on (M:1.5,
SD:0.7).
5) Happiness Jar, related apps, and
physiological sensors: 6 of 10 participants are used
to recording and describing their lives’ most
memorable moments, associated thoughts and
emotions: on social media (5); journal (3);
smartphones’ note-taking apps (2); and on the back
of Polaroid photos (1). None of the participants were
familiar with the Happiness Jar concept, never
created or used one, nor did they use an app or
platform based on or related to it. On the other hand,
4 users had previous experience with physiological
sensors, 2 in academic contexts (EEG, ECG, and
BVP sensors), and 2 in personal use (at-home ECG).
The other 6 had never used but were interested in
doing so.
4.3 Results
In this section, we present the evaluation’s results.
Overall, users have completed all tasks quickly and
without much hesitation, and they generally enjoyed
their time and experience with the system. More
detailed results are presented in the tables and
commented in the text along with user suggestions.
Memorable and Emotional Media Moments: Reminding Yourself of the Good Things!
93

4.3.1 Content Selection
Task 1: “Gauge the jar’s state in content selection
page.” (initially empty). 6 users quickly found and
made use of the small jar representation to correctly
assess it was empty. The other 4 took some time to
find it, but as soon as they did, they easily deter-
mined its state. They suggested to add a label, which
we readily did. USE results were quite positive
(U:4.1, S:4.0, E:5.0). After tasks 4 and 5, users
rechecked the new state of the jar (with an entry in
the jar), and some found this feature “useful”,
“delightful”, and “amusing”.
4.3.2 Content Reproduction
Task 2: “Select, consume, and save the video
‘Omelette’”. In Media4WellBeing (Bernardino et
al., 2016) we had already evaluated the “emoPaint”
view, here we focused on the new features, namely:
2.1) interface’s background pulsing to the
rhythm of one’s heartbeat (U:3.3,S:3.3,E:4.1). 3
users preferred “on” (to know their heart rate was
being estimated), 2 users preferred “off” (finding it
distracting), and 5 users were “indifferent” (subtle
enough to go unnoticed when focusing on the
content);
2.2) feeling heartbeat through smartphone
vibration (U:3.5, S:3.8, E:5.0). 3 users would rather
see “on” (found it “uniquely different” and “a very
real way of communicating one’s heart rate”), 2
preferred “off” (“distracting” and “potentially
irritating” in long-term), and 5 were “indifferent”
(subtle enough to not disturb and go unnoticed after
a while);
2.3) having “emoPaint” be painted to the rhythm
of heartbeat (U:3.5, S:3.4, E:4.0). 3 users found
“curious” and “interesting”, and we felt that, if not
for smartphone’s vibration along with the painting of
a dot, this feature could go a little “unnoticed”;
2.4) having an “average heart rate” text shown in
real-time (U:3.8, S:3.8, E:5.0), which users found
“interesting” and “informative”, and allowed
awareness of how their bodies responded to the
content they found emotionally uplifting, sad, or
even scary. After task 7.2, one user suggested a heart
rate line graph drawn along content’s consumption;
2.5) having “Predominant felt emotion” in text
(U:4.8, S:4.5, E:5.0). All users appreciated, some
believed to be “absolutely essential” to understand
which emotion was predominant when more than
one was painted in an identical way;
2.6) being able to save the consumed content on
the jar (U:4.1, S:4.1, E:4.5). Users found easy to do
and communicated clearly (when saved or not).
4.3.3 Self-assessment
Task 3: “Comment on the consumed video.” to get
their input on some of this page’s features, like:
3.1) the ability to rate how much they agree with the
sensor-recognized emotions (U: 5.0, S: 4.4, E: 5.0).
Table 1: USE evaluation of EmoJar (Scale:1-5: lowest-
highest); M=Mean; SD=Std. Deviation).
Task U
S E
T# Feature
M SD M SD M SD
Content Selection: (M)
4.1 0.7 4.0 0.5 5.0 0.0
1 small jar representation 4.1 0.7 4.0 0.5 5.0 0.0
Content Reproduction(M)
3.8 0.6 3.8 0.7 4.6 0.4
2.1 heartbeat: background 3.3 0.5 3.3 0.5 4.1 0.9
2.2 heartbeat: phone vibration 3.5 0.5 3.8 0.6 5.0 0.0
2.3 heartbeat: emoPaint rhythm 3.5 0.5 3.4 0.5 4.0 0.9
2.4 heartbeat: avg in text field 3.8 0.9 3.8 0.9 5.0 0.0
2.5 predom. emotion: text field 4.8 0.4 4.5 0.5 5.0 0.0
2.6 saving content in own jar 4.1 0.9 4.1 0.9 4.5 0.5
Self-Assessment: (M)
5.0 0.0 4.6 0.3 5.0 0.0
3.1 rate sensor-rec emotions 5.0 0.0 4.4 0.5 5.0 0.0
3.2 draw own emoPaint 5.0 0.0 5.0 0.0 5.0 0.0
3.3 provide self-assessment 5.0 0.0 4.3 0.5 5.0 0.0
Jar View: (M)
4.7 0.1 4.2 0.5 4.7 0.2
4.1 jar entry: preview 5.0 0.0 4.3 0.5 4.4 0.5
4.2 jar entry: review 5.0 0.0 4.5 0.5 5.0 0.0
4.3 direct access to its content 4.3 0.5 4.0 0.4 4.5 0.5
5.1 emo representation: icon 4.1 0.5 3.9 0.5 5.0 0.0
5.2 emo representation: change 4.4 0.5 4.8 0.4 5.0 0.0
6.1 random entry: with button 4.5 0.5 4.5 0.5 5.0 0.0
6.2 random entry: shake phone 2.7 0.5 3.4 0.5 3.6 0.7
Filters: (M)
4.7 0.1 4.2 0.5 4.7 0.2
7.1 a) by content type 5.0 0.0 3.6 0.5 5.0 0.0
7.1 b) by content title or author 5.0 0.0 3.5 0.5 5.0 0.0
7.1 c) by predominant emotion 5.0 0.0 4.1 0.3 5.0 0.0
7.1 d) small tooltips pop up 5.0 0.0 4.6 0.5 5.0 0.0
7.2 a) by sensor & selfassessmt 5.0 0.0 3.3 0.5 4.6 0.8
7.2 b) by date 5.0 0.0 3.5 0.5 5.0 0.0
7.2 c1) by heart rate (HR):write 5.0 0.0 4.7 0.5 4.5 0.5
7.2 c2) by HR: phone camera 5.0 0.0 4.4 0.5 3.5 0.7
7.2 c3) by HR: tapping 5.0 0.0 4.6 0.5 4.6 0.5
7.3 a) by “First” save 5.0 0.0 4.3 0.5 5.0 0.0
7.3 b) by “Repeated” saves 5.0 0.0 4.7 0.5 5.0 0.0
8
Jar Overview
5.0 0.0 4.6 0.5 4.8 0.4
Global Evaluation
4.1 0.3 4.4 0.5 4.3 0.5
Users found “convenient”, when disagreeing or
finding detected emotions incomplete. A user men-
tioned machine learning to allow precise results;
3.2) the ability to draw their own “emoPaint”
(U:5.0, S:5.0, E:5.0), which users found “original”
and an “inventive” way of providing their personal
perspective. Two users strongly appreciated the
sensor-generated “emoPaint” being automatically
replicated in their own “emoPaint” drawing area,
excusing them of trying to match the sensor-
generated one. It was not yet possible to “Undo”
potential mistakes in the drawing, only “Reset” and
draw anew. Curiously, no one complained about this
HUCAPP 2020 - 4th International Conference on Human Computer Interaction Theory and Applications
94

limitation, as they simply focused on drawing. When
alerted about it, some users said it would not be hard
to reset and replicate a drawing, but all recognized
the usefulness of having “Undo” and “Redo”.
Another limitations to be addressed in the future, is
that a user’s self-assess-ment cannot be delayed or
edited at a later time.
3.3) Overall, being able to provide self-assess-
ment about consumed content was seen as (U:5.0,
S:4.3, E:5.0). All users felt that the questions were
completely relevant (1-5 Likert scale; M: 5.0, SD:
0.0) and in the right amount (4), some stating that
more questions might become “tedious” and “labori-
ous”, and less questions would not allow to properly
explain what made the content worth saving.
4.3.4 Jar View
For Task 4 and 5, all users had in their jar the entry
that resulted from the previous tasks. From Task 6
on, they would have 13 entries to test other features.
Task 4: “Review the jar entry that was created
as a result of consuming, saving, and commenting
the selected video”. This was the users’ feedback:
To start with, just by looking at their first jar
entry it was very easy for everyone (M: 5.0, SD: 0.0)
to understand that it concerned a video, and had the
predominant emotion provided on self-assessment;
4.1) the jar entry’s preview (U:5.0, S:4.3, E:4.4),
was found “convenient” by all, as it allowed to know
about the entry’s content and self-assessment. On
the computer, all users found this preview trivial
(hovering). On the smartphone, 4 users did not know
what to do and asked for help (as stated in the
instructions it required long pressing). The other 6,
relying on previous experience with smartphones did
it well. All agreed that the entry’s preview had the
right amount of information;
4.2) the ability to review a jar entry (U:5.0,
S:4.5, E:5.0) was found instrumental in understan-
ding what made their consumed contents memorable
and ultimately worth saving. All users thought that
their entry’s information was well sorted (M: 4.5 and
SD: 0.5), but 4 mentioned that they would like to
have the sensor and user-generated “emoPaint” side
by side - challenging with the limited amount of
horizontal space on smartphones in vertical position;
4.3) the ability to directly access the content the
jar entry was about (U:4.3, S:4.0, E:4.5), considered
to be a nice shortcut to searching for that content on
the content selection page, and a quick way of
replaying content that they found memorable.
Task 5: “Change the emotion representation at
use.” and see how this reflected on their previously
created entry and both “emoPaint”. In that process,
we collected the users’ feedback on:
5.1) the multicolored icon that illustrates the
currently selected emotion representation (U: 4.1, S:
3.9, E: 5.0), which users found “handy” as it quickly
informed them of the emotion representation at use;
5.2) the ability to change to another emotion
representation (U:4.4, S:4.8, E:5.0), which all users
appreciated. After selecting one of our 3 available, 6
users stated their choice was driven by their personal
preference of colors, 2 stated they felt the selected
colors to be more representative of the emotions in
the system, and the remaining 2 said it was due to a
mix of both reasons. Most users suggested to better
highlight the current representation in the selection
dialogue, with the addition of small arrows or a text
label (which we adopted);
For the future, users would appreciate the ability
to: a) create their own emotion representation, with
their own colors (8 said, 2 were well served with the
3 options offered); and b) customize their jar (4 to
change its name, give its lid a checkered or striped
pattern, and turn its entries into emojis or make them
heart-shaped; 6 did not have much interest in this, as
they liked it in its current, unadorned form).
From Task 6 onwards, the users’ jar had 13
entries. Before these tasks, we asked users to
identify the jar’s most present emotion. All 10 users
correctly identified “Happiness”, coming to that
conclusion, they stated, through the jar’s lid, and by
checking that there were more entries with the color
of the jar’s lid than with any other color.
Task 6: “Extract a random entry from the jar”.
On both computer and smartphone, all 10 users
made quick use of the “Random” button (U:4.5, S:
4.5, E:5.0), not occurring to anyone, even those who
read the instructions, that they could shake the
smartphone. After being reminded and trying it,
most users commented that having the “Random”
button below the jar made the “shake” command
“somewhat redundant”, believing it would be faster
and easier to click on the button. Still, users found it
interesting and distinctive (U:2.7, S:3.4, E:3.6).
4.3.5 Jar Filtering
Task 7.1: “Find specific jar entries: a video called
‘Tabook’ that had made them predominantly
experience ‘Surprise’”. Then they replied about: a)
the ability and process of filtering the jar’s entries by
their content’s type (U:5.0, S:3.6, E:5.0), b) by title
or author (U:5.0, S:3.5, E:5.0), and c) by predomi-
nantly felt emotion (U:5.0,S:4.1,E:5.0); and d) the
small tooltips that pop up when a filter region is
Memorable and Emotional Media Moments: Reminding Yourself of the Good Things!
95

closed with filters active (U:5.0,S:4.6,E:5.0), a detail
that users found to be “very thoughtful” and useful.
Five users preferred the filtering process to work
the way it currently did (i.e., getting the desired
results after selecting and then applying filters), they
like to state “go-ahead” or find too distracting or
confusing to have the jar changing every time a filter
was selected or deselected (real-time); 2 would
prefer real-time, as it is what they were accustomed
to; and 3 did not have a preference;
To select “Surprise”, 7 users used the wheel of
emotions (6 because it was selected by default, and 1
because this was the favorite emotion arrangement),
and the other 3 used alphabetically ordered buttons
(because they prefer buttons and the alphabetical
order allowed quick finding of the emotion).
Task 7.2: “Find specific jar entries that
contained sensor data, were created between two
provided dates, and had the user’s current heart rate
(with tolerance of 40 bpm) as average heart rate”.
Then, we wanted the users’ feedback on:
The ability and process of filtering the jar’s
entries by a) whether or not they contain sensor
and/or self-assessment data (U:5.0, S:3.3, E:4.6), b)
the date or date interval in which these entries were
created (5-7 June, 2019) (U:5.0,S: 3.5,E: 5.0); and
c1) writing an average heart rate (U:5.0,S:4.7,E:4.5);
c2) estimating user’s average heart rate at the
time of the content’s consumption using the device’s
camera and a finger (U:5.0,S:4.4,E:3.5) was found
“unique” and “very interesting”, even if it turned out
to be “somewhat frustrating” due to its slight sensiti-
vity to changes in lighting and finger placement.
Only 4 users managed to get an estimate of their
heart rate, with 3 of them requiring more than one
try;
c3) using the tapping mechanism to estimate
one’s heart rate (U:5.0,S:4.6,E:4.6) was found “fun”
and “original”. The 4 who obtained an estimate with
the previous mechanism were pleased to see that the
tapping presented a very similar estimate. One user
mistakenly tapped the heart icon twice with each
heartbeat (contraction and relaxation), this could be
an alternative but might be more challenging to feel
and replicate, so not our (and the other 9 users)
choice.
Task 7.3: “Find the first jar entries created
about every saved content, and all jar entries about
every repeatedly saved content”.
The ability and process of a) finding the first jar
entries (U:4.6, S:4.6, E:5.0), and b) finding all
repeated entries (U:4.7, S:4.4, E:5.0) were apprecia-
ted with users considering the latter especially useful
for comparing how they felt upon subsequent con-
sumptions of the same content.
To learn about how well they understood the
views in which these first and repeated entries are
presented, we asked how many, out of a total of 13,
corresponded to a) the first time some content was
saved in the jar, b) content repeatedly saved, and c)
repeated saves of the video “Omelette”, with all
users answering correctly to the three questions.
4.3.6 Jar Overview
Finally, in Task 8: “Get an overview of one’s jar
use”, accessing the “Overview” perspective and
feeding us 9 bits of information regarding: 1) how
many times “Happiness” had been predominantly
felt, according to sensors and user’s self-assessment;
2) how many entries concerned videos, audio,
images, and text quotes; 3) how many entries have
sensor data, and how many have self-assessment
data; 4) the distribution of predominantly felt
emotions recognized by sensors and by self-
assessment in the jar; 5) the percentage of times that
the user “Agreed” with sensor’s results; 6) the
average number of words written in each self-
assessment; 7) the date of first entry ever created in
the jar; 8) the date on which the highest number of
entries were created; and 9) the overall average heart
rate of the user when consuming digital content. All
information was correctly provided, with overall
“Overview” feature rated as (U:5.0, S:4.6, E:4.8).
4.3.7 Global Evaluation
EmoJar was considered to have a quite good design
(M:4.2, SD:0.4) and found “visually appealing”. In
terms of perceived usefulness, satisfaction, and ease
of use, the overall USE ratings were (U:4.1, S:4.4,
E:4.1). As for its usability, the system’s overall SUS
score (Brooke, 1992) was very good: 89.5 out of
100.
The most appreciated details and features
included (ordered by times mentioned): the “ability
to draw one’s emotions” (7), “saving content with
emotional information associated to it” (6), “camera
and tapping mechanisms to get an estimate of one’s
heart rate” (6), “ability to change the system’s
emotion representation, and thus its colors” (5),
“Overview’ perspective” (4), “ability to filter based
on many different criteria” (3), “tooltips that inform
users of their selected filters” (3), “colored entries”
(2), “jar’s lid color changing according to the jar’s
most present emotion” (2), “ability to feel one’s
heartbeat while consuming some content” (1), and
“ability to contest the sensor’s results” (1).
HUCAPP 2020 - 4th International Conference on Human Computer Interaction Theory and Applications
96

As suggestions, users mentioned it would be
interesting to have EmoJar work in tandem with
YouTube, Spotify, Instagram, and other such
platforms. Some users commented that EmoJar had
a lot of potential, and that we should continue to
work on it, as they were unfamiliar with any other
applications that explored the emotional and well-
being dimensions of digital content consumption.
Table 2: Quality terms users chose for EmoJar.
H:Hedonic; E: Ergonomic; A: Appeal.
Terms type # Terms type #
Comprehensible
E 10
Inviting
A 8
Simple
E 10 Impressive H 7
Interesting
H 10 Familiar E 6
Aesthetic
A 10 Innovative H 6
Attractive
A 10 Good A 6
Pleasant
A 9 Exciting H 4
Clear
E 8 Motivating A 4
Original
H
8 Simpathetic A 3
In the end, users characterized EmoJar choosing
most relevant perceived hedonic, ergonomic and
appeal quality aspects (out of a total of 46: 23
positive, and 23 negative opposites) (Hassenzahl et
al., 2000). Comprehensible, Simple, Interesting,
Aesthetic, and Attractive were chosen by all the
participants, followed by Pleasant, Clear and
Inviting (Table 2).
5 CONCLUSION AND
PERSPECTIVES
Based on the Positive Psychology and Positive
Computing approaches, this paper addressed the
potential benefits of digital media content and its
consumption on individuals’ psychological well-
being; and presented and evaluated EmoJar as an
extension to Media4WellBeing, allowing users to
collect and relive emotionally impactful and memo-
rable moments.
In the user evaluation, we observed a quick and
successful completion of all tasks, and realized that
users were interested and invested in using and
exploring EmoJar. They appreciated that it allowed
them to elaborate on why certain emotions had been
felt throughout content’s consumption, and what
made said content memorable. Users also valued the
existence of EmoJar, as it allowed them to collect
content that was memorable to them, and that
positively contributed to their psychological well-
being, and to recall and reminisce upon all the
emotions, memories, thoughts, and perceptions that
resulted from consuming said content. Aligning with
exercises Seligman (2005) has shown to promote
individuals’ psychological wellbeing, revolving
around coming up with things one is grateful for.
Overall, users recognized EmoJar as useful,
satisfactory and easy to use, and capable of making
digital content consumption more meaningful and
profound. They encouraged us to develop it further,
as they found the idea behind it to be very
interesting, and the process and mechanisms by
which this system operates unlike anything they had
previously seen.
Future work includes refining based on the
evaluation, and further extending the interactive
features of EmoJar so as to provide a useful and
interesting digital experience that further supports
users in their journey of personal awareness and
development. A larger scale in terms of information
and time span is being addressed. More modalities,
like sound and haptics, are also being designed for
emotional feedback, to complement or be
experienced in alternative to the visual feedback,
e.g. to allow users to focus their visual attention to a
video they are watching, or to experience a song
with eyes closed, or yet to make the experience more
accessible to users with special perceptual needs.
The option of letting users record, comment, and
insert their own media (e.g., video or audio recor-
dings) in the jar is also a direction to explore.
EmoJar was tested in a short term usage. It is our
intention to go on enriching the user experience with
features found useful and interesting, that go in the
direction of promoting and supporting users in their
journey of self-awareness and personal develop-
ment, also in a consistent and prolonged longer term
usage.
ACKNOWLEDGEMENTS
This work was partially supported by FCT through
funding of the AWESOME project, ref. PTDC/CCI/
29234/2017, and LASIGE Research Unit, ref. UIDB
/00408/2020.
REFERENCES
Applied Happiness Ltd. Gratitude Garden. 2016.
https://itunes.apple.com/us/app/gratitude-garden/
id1101115763?mt=8
Bernardino, C., Ferreira, H.A., and Chambel, T. 2016.
Towards Media for Wellbeing. In Proc. of ACM TVX'
2016, ACM. 171-177.
Memorable and Emotional Media Moments: Reminding Yourself of the Good Things!
97

Brooke, J., 1996. SUS – A quick and dirty usability scale.
Usability evaluation in industry, 189(194), 4-7.
Calvo, R. A., and Peters, D., 2014. Positive computing:
Technology for wellbeing and human potential.
Cambridge, MA: MIT Press.
Chambel, T. 2011. Towards Serendipity and Insights in
Movies and Multimedia. In Proc. of International
Workshop on Encouraging Serendipity in Interactive
Systems. Interact'2011. 12-16.
Chambel, T., Oliveira, E., and Martins, P., 2011. Being
Happy, Healthy and Whole Watching Movies that
Affect our Emotions. In Proceedings of ACII 2011,
4th Int. Conf. on Affective Computing and Intelligent
Interaction, Springer. 35-45.
Chambel, T., Langlois, T., Martins, P., Gil, N., Silva, N.,
Duarte, E., 2013. Content-Based Search Overviews
and Exploratory Browsing of Movies with Movie-
Clouds. International Journal of Advanced Media and
Communication, 5(1): 58-79.
Cooper, G., 2014. HappiJar - The Happiness, Gratitude,
Blessings and Affirmations Jar & Journal. https://
itunes.apple.com/app/id692709737?mt=8&&referrer
=click=ef5237b2-fbd1-464e-ba89-0ad4ed86e02d
Dodge, R., Daly, A., Huyton, J., and Sanders, L., 2012.
The challenge of defining wellbeing. International
Journal of Wellbeing, 2(3), 222-235.
Ekman, P., 1992. Are there basic emotions? Psychological
Review, 99(3):550-553.
HappyFeed-ref: HappyFeed Inc. Happyfeed - Gratitude
Journal. https://itunes.apple.com/us/app/happyfeed-
gratitude-journal/ id707073943
Hassenzahl, M., Platz, A., Burmester, M, Lehner, K.,
2000. Hedonic and Ergonomic Quality Aspects
Determine a Software’s Appeal. In Proceedings of
ACM CHI 2000. ACM, pp.201-208.
Humane Engineering Ltd., Cove: music for mental health,
2015-19. https://apps.apple.com/app/cove-the-musi-
cal-journal/id1020256581
Janssen, J. H.,Bailenson, J. N., Ijsselsteijn, W. A., and
Westerink, J. H., 2010. Intimate Heartbeats: Oppor-
tunities for Affective Communication Technology.
IEEE Trans. on Affective Computing, 1(2), 72-80.
JarAwe-ref: Jar of Awesome app. https://play.google.com
/store/apps/details?id=com.sibayak9.jarofawesome
Kok, B. E., Coffey, K. A., Cohn, M. A., Catalino, L. I.,
Vacharkulksemsuk, T., Algoe, S. B., Brantley, M., and
Fredrickson, B. L., 2013. How Positive Emotions
Build Physical Health. Psychological Science, 24(7),
1123-1132.
Lund, A. M., 2001. Measuring usability with the USE
questionnaire. Usability and User Experience, 8(2).
Martins, S., Chambel, T., and Ferreira, H. A. 2018.
Meditative States in Personal Media Access. In
Proceedings of ICGI' 2018, International Conference
on Graphics and Interaction, Lisbon Portugal, IEEE,
pp.181-182.
Oliveira, E., Martins, P., and Chambel, T. 2013. Accessing
Movies Based on Emotional Impact. ACM/Springer
Multimedia Systems Journal, 19(6), Nov. 559-576.
Plutchik, R., 1980. Emotion: A psychoevolutionary
synthesis. Harper & Row New York.
Reinecke, L., Klatt, J., and Krämer, N. C. 2011.
Entertaining Media Use and the Satisfaction of Reco-
very Needs: Recovery Outcomes Associated with the
Use of Interactive and Noninteractive Entertaining
Media. Media Psychology, 14(2), 192-215.
Russell, J. A., 1980. A circumplex model of affect.
Journal of Personality and Social Psychology, 39(6),
1161-1178.
Sacharin, V., Schlegel, K., & Scherer, K. R., 2012.
Geneva Emotion Wheel rating study (Report). Univ. of
Geneva, Swiss Center for Affective Sciences.
Seligman, M. E., Steen, T. A., Park, N., and Peterson, C.,
2005. Positive Psychology Progress: Empirical
Validation of Interventions. American Psychologist,
60(5), 410-421.
Serra, S., Jorge, A., Chambel, T., 2014. Multimodal
Access to Georeferenced Mobile Video through
Shape, Speed and Time. In Proceedings of British
HCI’2014, ACM, 347-352.
TheHappiJar-ref: The Happiness Jar app.http://www.
thehappinessjar.com/en.
HUCAPP 2020 - 4th International Conference on Human Computer Interaction Theory and Applications
98
