
The Labeling Distribution Matrix (LDM): A Tool for Estimating
Machine Learning Algorithm Capacity
Pedro Sandoval Segura
1,2
, Julius Lauw
1
, Daniel Bashir
1
, Kinjal Shah
1
, Sonia Sehra
1
,
Dominique Macias
1
and George Monta
˜
nez
1
1
AMISTAD Lab, Department of Computer Science, Harvey Mudd College, Claremont, CA, U.S.A.
2
Department of Computer Science, University of Maryland, College Park, MD, U.S.A.
Keywords:
Machine Learning, Model Complexity, Algorithm Capacity, VC Dimension, Label Recorder.
Abstract:
Algorithm performance in supervised learning is a combination of memorization, generalization, and luck. By
estimating how much information an algorithm can memorize from a dataset, we can set a lower bound on
the amount of performance due to other factors such as generalization and luck. With this goal in mind, we
introduce the Labeling Distribution Matrix (LDM) as a tool for estimating the capacity of learning algorithms.
The method attempts to characterize the diversity of possible outputs by an algorithm for different training
datasets, using this to measure algorithm flexibility and responsiveness to data. We test the method on several
supervised learning algorithms, and find that while the results are not conclusive, the LDM does allow us
to gain potentially valuable insight into the prediction behavior of algorithms. We also introduce the Label
Recorder as an additional tool for estimating algorithm capacity, with more promising initial results.
1 INTRODUCTION
Determining the representational complexity of a
learning algorithm is a long-standing problem in ma-
chine learning. Well-known methods for doing so in-
clude upper bounding an algorithm’s model complex-
ity using the VC dimension and measuring an algo-
rithm’s ability to fit noise with Rademacher complex-
ity. We let algorithm capacity denote the represen-
tational complexity of the outputs of a learning al-
gorithm, which is a measure of the algorithm’s abil-
ity to store information in its trained models that can
subsequently be used to make inferences–this stored
information might take the form of memorized data
points or underlying information about how the data
was generated. A method capable of providing an es-
timate of an algorithm’s capacity instead of bound-
ing it offers concrete progress towards answering the
question of whether a given algorithm will overfit or
underfit on a particular dataset.
Building a formal framework for the overfitting
and underfitting of machine learning models is of
prime importance as researchers desire to tune their
models in ways that will lead to greater generaliza-
tion performance. We want to train our models to
capture inherent data relationships and be able to per-
form accurately over unseen data. It is common belief
that machine learning algorithms perform better when
their capacity is appropriate for the true complexity of
the task, such that the algorithm is able to capture re-
lationships within the provided training data. In other
words, underfitting is a result of a model having in-
sufficient capacity, while overfitting is a repercussion
of models with excess capacity. In this manuscript,
we introduce a proxy for model capacity through em-
pirically observable Labeling Distribution Matrices
(LDMs).
1.1 Existing Characterizations
To the authors’ knowledge, there is no general method
to empirically measure algorithm capacity for an ar-
bitrary machine learning method. If such a procedure
existed, we would make progress toward determining
whether overfitting or underfitting could occur on a
dataset, given information on the complexity of said
dataset. It is important to note the distinctions of dif-
ferent definitions of model capacity as currently un-
derstood.
Representational Capacity: specifies the family
of functions a learning algorithm can choose from
when varying the parameters in order to reduce a
training objective.
Effective Capacity: specifies that imperfections
980
Segura, P., Lauw, J., Bashir, D., Shah, K., Sehra, S., Macias, D. and Montañez, G.
The Labeling Distribution Matrix (LDM): A Tool for Estimating Machine Learning Algorithm Capacity.
DOI: 10.5220/0009178209800986
In Proceedings of the 12th International Conference on Agents and Artificial Intelligence (ICAART 2020) - Volume 2, pages 980-986
ISBN: 978-989-758-395-7; ISSN: 2184-433X
Copyright
c
2022 by SCITEPRESS – Science and Technology Publications, Lda. All rights reserved

and assumptions made in the optimization learning al-
gorithm can limit representational capacity.
Our method for measuring the entropy of the la-
beling distributions produced from a classification
model aims to capture representational capacity. We
train a given classification model on noisy datasets,
then measure how the training affects the distribu-
tion of output labels. Training a model on noise and
analyzing how that affects the labeling distributions
that are produced should serve as a reasonable proxy
for a classification model’s ability to model arbitrarily
complex relationships.
1.2 Experimental Setup
Our goal is to characterize the capacity of a classi-
fication algorithm by measuring its expressiveness.
In this exploratory work, we will focus our attention
on determining the capacity of classification models.
The procedure involves analyzing the probability dis-
tributions over all possible ways of labeling a holdout
set, given an information resource that the model was
trained on. Note that we use information resource to
mean training data within this context. We want to de-
termine to what extent is an arbitrary machine learn-
ing classification model capable of capturing the re-
lationship between features and labels for a given set
of information resources. Our hypothesis is that if,
on datasets without any inherent relationship between
features and labels, the model is able to classify cor-
rectly beyond what is expected by random guessing
then this suggests the model has the storage capacity
to memorize elements of the dataset.
As a concrete example, consider a set of K training
datasets, each with N data points. Each data point can
be labeled as one of C possible classes. We define the
i
th
training dataset formally as follows:
f
i
= {(x
1
,y
1
),(x
2
,y
2
),...,(x
N
,y
N
)}
where x
j
= j
th
data point
y
j
= label assigned to data point x
j
for all 1 ≤ i ≤ K. Also, let us consider a holdout set
H of size N
0
:
H = {z
1
,z
2
,...,z
N
0
}
which we label using a trained classification model M.
Here, z
j
is the j
th
data point of the holdout set. The
label for the data point z
j
of the holdout set is M(z
j
).
Based on the above definitions, we see that for
any classification model trained on dataset f
i
, there
is a total of C
N
0
possible labeling combinations for a
given holdout set H, where C represents the number
of classes available for the given dataset. For exam-
ple, if the training dataset contains binary labelings
(where y
j
∈ {0, 1}), then C = 2 and there are 2
N
0
pos-
sible labelings for the holdout set.
1.3 Simplex Vectors
We will be using a probabilistic model to evaluate al-
gorithm expressiveness. The first step is to construct
a series of simplex vectors P
f
i
, each of which is rep-
resented as a vector of probabilities of size C
N
0
for a
given training dataset f
i
. The idea is that, for each
data point z
j
in a given holdout set H, we can find
the probability that the trained classification model M
will assign each of the possible C classes. By deter-
mining the probability distribution of a classification
model’s assignments over C
N
0
possible labeling com-
binations for a given training dataset f
i
, we can gain
a better understanding of the capacity of the model
based on the nature of the resulting probability dis-
tributions. If we see that the model typically assigns
probability mass on the same subset of possible label-
ings regardless of the training data, then we can say
that the model is less expressive and has lower capac-
ity. We construct the simplex vector P
f
i
for a given
training dataset f
i
as follows:
1. Train classification model M on f
i
.
2. Label holdout set H using M.
3. For every j
th
possible labeling l of the holdout
set, compute the probability that M would have
assigned l. Set this probability as the j
th
entry of
P
f
i
.
4. Normalize P
f
i
.
Given that each entry in the simplex vector corre-
sponds to the probability of a particular labeling com-
bination for a given holdout set H, the entry is com-
puted by taking the product of the probabilities as-
signed to each class for the given holdout feature sam-
ple. Consider a holdout set H = {z
1
,z
2
,z
3
} of size 3.
If a given training dataset has classes 0, 1, or 2, then
the probability assigned to the entry corresponding to
the labeling {z
1
: 0, z
2
: 1, z
3
: 2} will be the product of
the probability of the class 0 being assigned, the prob-
ability of class 1 being assigned, and the probability
of class 2 being assigned. In other words,
P(M(z
1
) = 0,M(z
2
) = 1,M(z
3
) = 2 | z
1
,z
2
,z
3
) =
P(M(z
1
) = 0)P(M(z
2
) = 1)P(M(z
3
) = 2)
where we assume that the probability of a single label
is conditionally independent of the probability of any
other label, since we are randomly generating training
datasets.
The Labeling Distribution Matrix (LDM): A Tool for Estimating Machine Learning Algorithm Capacity
981

1.4 Dirichlet Characterization
Now that we have a series of simplex vectors P
f
i
for
all 1 ≤ i ≤ K, we seek to measure the diversity of these
probability distributions. Because the support of a
Dirichlet distribution can be viewed as a set of proba-
bility distributions, we worked to infer the parameters
of the Dirichlet distribution from which the simplex
vectors P
f
i
were drawn. The idea is that we can de-
termine how expressive an algorithm based on the di-
versity of the probability distributions generated over
labelings of a given holdout H, for different infor-
mation resources f
i
. We hypothesize that the greater
the expressiveness of an algorithm, the more diverse
the probability distributions will be, since such algo-
rithms will not tend to have fixed preference for out-
put responses regardless of the training data. An ex-
pressive algorithm tends to be more “flexible” such
that, given multiple information resources f
i
to train
on and a fixed set of holdout features, it will be more
responsive to the differences in the different informa-
tion resources that it trained on. Thus, the more re-
sponsive an algorithm is to changes in training data,
the resulting simplex vectors for different datasets
should show greater diversity.
Supposing the simplex vectors were drawn inde-
pendently from a Dirichlet distribution, we could use
them to infer a vector of alpha priors
~
α corresponding
to that Dirichlet distribution. We claim that the en-
tropy of this distribution gives us a means to estimate
expressiveness because it tells us how uniformly the
inferred Dirichlet distribution assigns probabilities to
its support. The more uniform the distribution, the
more expressive the algorithm, since the simplex vec-
tors could then be drawn from anywhere on the sim-
plex. Diversity of sampled simplex vectors implies
more uniform mass over the support. We compute the
entropy of the Dirichlet distribution by computing the
entropy of
~
α, which parameterizes the distribution.
1.5 Connections to Rademacher
Complexity
One can view this technique, of training an algorithm
on noise and analyzing the distribution of possible la-
belings, as a means of better understanding the space
of functions that the classification algorithm is rea-
soning over. Similarly, in computational learning the-
ory, Rademacher complexity provides us with another
way of measuring hypothesis space complexity.
Definition: (Rademacher Complexity) Let H ⊂
F = { f : X → R} be a class of functions we are ex-
ploring defined on domain X ⊂ X , and S = {x
i
}
n
i=1
be set of samples generated by some unknown dis-
tribution D
X
on the same domain X . Define σ
i
to be
uniform random variable on ±1, for any i. The empir-
ical Rademacher complexity or Rademacher average
is defined as follows:
ˆ
ℜ
S
(H ) = E
σ
"
sup
f ∈H
1
n
n
∑
i=1
σ
i
f (x
i
)
#
The supremum measures the maximum correlation
between f (x
i
) and σ
i
over all f ∈ H , for a given set S
and Rademacher vector σ. Because we’re taking the
expectation over σ, the empirical Rademacher com-
plexity of H measures the ability of functions within
this space to fit random noise. The Rademacher com-
plexity, therefore, can be thought of as the expected
noise fitting ability of H over all data sets S drawn
from D
X
(Balcan, 2011).
1.6 Estimating Complexity from the
Labeling Distribution Matrix
(LDM)
As described in Section 1.4, we take an arbitrary clas-
sification model M, train it on an information resource
(training dataset) f
i
, and build a probability distri-
bution over Ω, the space of all possible labelings of
our holdout set H. Because a classification algorithm
can only provide us with class probabilities given the
features of an example, we build probability distribu-
tions of length |Ω|, which are simplex vectors. Each
element in a simplex vector represents the probabil-
ity of encountering a particular combination of label-
ing. Iterating this process over all K training datasets,
we eventually generate a series of simplex vectors
P
f
1
,P
f
2
,...,P
f
K
each of length |Ω| to characterize the
probabilities that M places on each element of Ω. This
produces our labeling distribution matrix L,
L =
| | |
P
f
1
P
f
2
··· P
f
K
| | |
Given these K simplex vectors, whose entries sum to
1 after normalization described in 1.3, we propose
a method to measure the capacity of model M that
works as follows:
1. We suppose each of the column vectors in our ma-
trix is an independent sample from some Dirichlet
distribution parameterized by
~
α.
2. Use an iterative method (Sklar, 2014; Minka,
2003) to infer the parameters of the Dirchlet dis-
tribution from our sample vectors, as seen in Line
5 of Algorithm 1.
ICAART 2020 - 12th International Conference on Agents and Artificial Intelligence
982

3. Compute the entropy of the Dirichlet distribution
we inferred.
The pseudocode for constructing an LDM of M and
estimating its complexity by measuring the entropy
~
α
is below:
Variable definitions:
M = input classification model
K = number of datasets (columns) for LDM
D = input dataset
Algorithm 1: LDM Entropy Calculation Algorithm.
1: for i = 1, ... , K do
2: f
i
, H ← splitIntoTrainHoldout(D)
3: P
f
i
← getSimplexVector(M, f
i
, H)
4: L ← [P
f
1
,P
f
2
,...,P
f
K
]
5: dirichletAlphas ← findDirichlet(L)
6: entropy ← computeEntropy(dirichletAlphas)
We claim that this method can be used to measure
model complexity. To give an intuitive sense of why,
we first look at the labeling distribution matrix itself.
If our model M was trained on dataset D
i
, then the
output is a row vector P
Ω
(D
i
), indicating a probability
distribution placed on Ω when M was trained on D
i
.
If we train on K distinct datasets D
1
,D
2
,...,D
K
, M
produces K such column simplex vectors. Intuitively,
if M is a particularly expressive algorithm, then M
will be able to adapt well to different datasets, cap-
turing the true relationships (and perhaps noise). As
a result, we would expect more variance in the poten-
tial distributions over Ω that M would be able to pro-
duce. On the other hand, if the simplex vectors in our
algorithm’s matrix are mostly very similar, then our
algorithm M does not have much capacity to adapt its
parameters to the given dataset.
In general, if the LDM is “compressible” (con-
taining redundant simplex vectors whose distributions
are similar) then our algorithm is not very expressive.
Thus, we consider the simplex vectors of our matrix
themselves as samples from a Dirichlet distribution.
If these vectors imply that the Dirichlet distribution
covers most of its support, i.e., has a uniform distri-
bution, then that means that our algorithm is as ex-
pressive as possible. This is because any vector in the
support has the same probability assigned to it as any
other vector, meaning that our algorithm is capable of
producing anything in the support with equal likeli-
hood. Therefore, the entropy of the inferred distribu-
tion is effectively a measure of the expressiveness of
the algorithm that produced our labeling distribution
matrix—a low entropy indicates a relatively less ex-
pressive algorithm, while high entropy implies a more
expressive algorithm.
1.7 Results
Using the methodology described in our experimen-
tal setup, we calculated the entropy of the labeling
distribution matrices of a variety of machine learn-
ing models averaged over 20 runs. Every classifica-
tion algorithm was trained on scikit-learn’s Iris
Dataset (Fisher, 1936), which consists of 3 classes,
4 real-valued features for every example, and 150 ex-
amples total. Our Gaussian Process Classifier uses a
default RBF kernel. Our Decision Tree uses a maxi-
mum depth of 5. Our Random Forest Classifier uses
10 estimators, a maximum of 1 feature, and a maxi-
mum depth of 5.
The entropies computed give us some insight as
to a model’s capacity and expressiveness. Every in-
formation resource on which we train a classification
model is randomly generated, since we permute the
labels of the original dataset when generating a col-
umn of an LDM. Thus, computing the entropy of
~
α
parameterizing a Dirichlet distribution over an LDM
gives us a measure of the diversity of distributions
over labelings that the classification algorithm is ca-
pable of producing. The results are given in Table 1.
Additionally, the LDM heatmaps shown in Fig-
ure 1 provides a visualization of the probability dis-
tributions of an LDM, with dark cells representing
low probability, and brighter cells representing higher
probability. Every index i of the x-axis represents
a particular labeling distribution P
f
i
, while every in-
dex j of the y-axis represents a unique labeling of the
holdout set H, of which there are C
N
0
.
The average entropy of different classification
models, as outlined in Figure 1, coincides with what
the average LDM looks like for the same model.
Note, for example, that the highest entropy values are
achieved by models like the Gaussian Process Classi-
fier and AdaBoost Classifier.
If we look at the Gaussian Process Classifier’s
LDM, as represented by the heatmap in Figure 1c, we
see that the texture of the matrix is consistent (in color
and pattern) over different information resources and
labelings. Notice, it has an overall “brightness” that
exceeds that of other classifiers, meaning that its mod-
els place more probability on different labelings than
other models do. This means that, despite being
trained on different training datasets where the re-
lationship between features and labels is broken or
nonexistent, the Gaussian Process Classifier is still
able to assign nonzero probability to most labelings
of the holdout set.
In similar vein, for the AdaBoost Classifier’s
LDM, as represented by the heatmap in Figure 1d, we
see that the texture of the matrix is distinct from oth-
The Labeling Distribution Matrix (LDM): A Tool for Estimating Machine Learning Algorithm Capacity
983
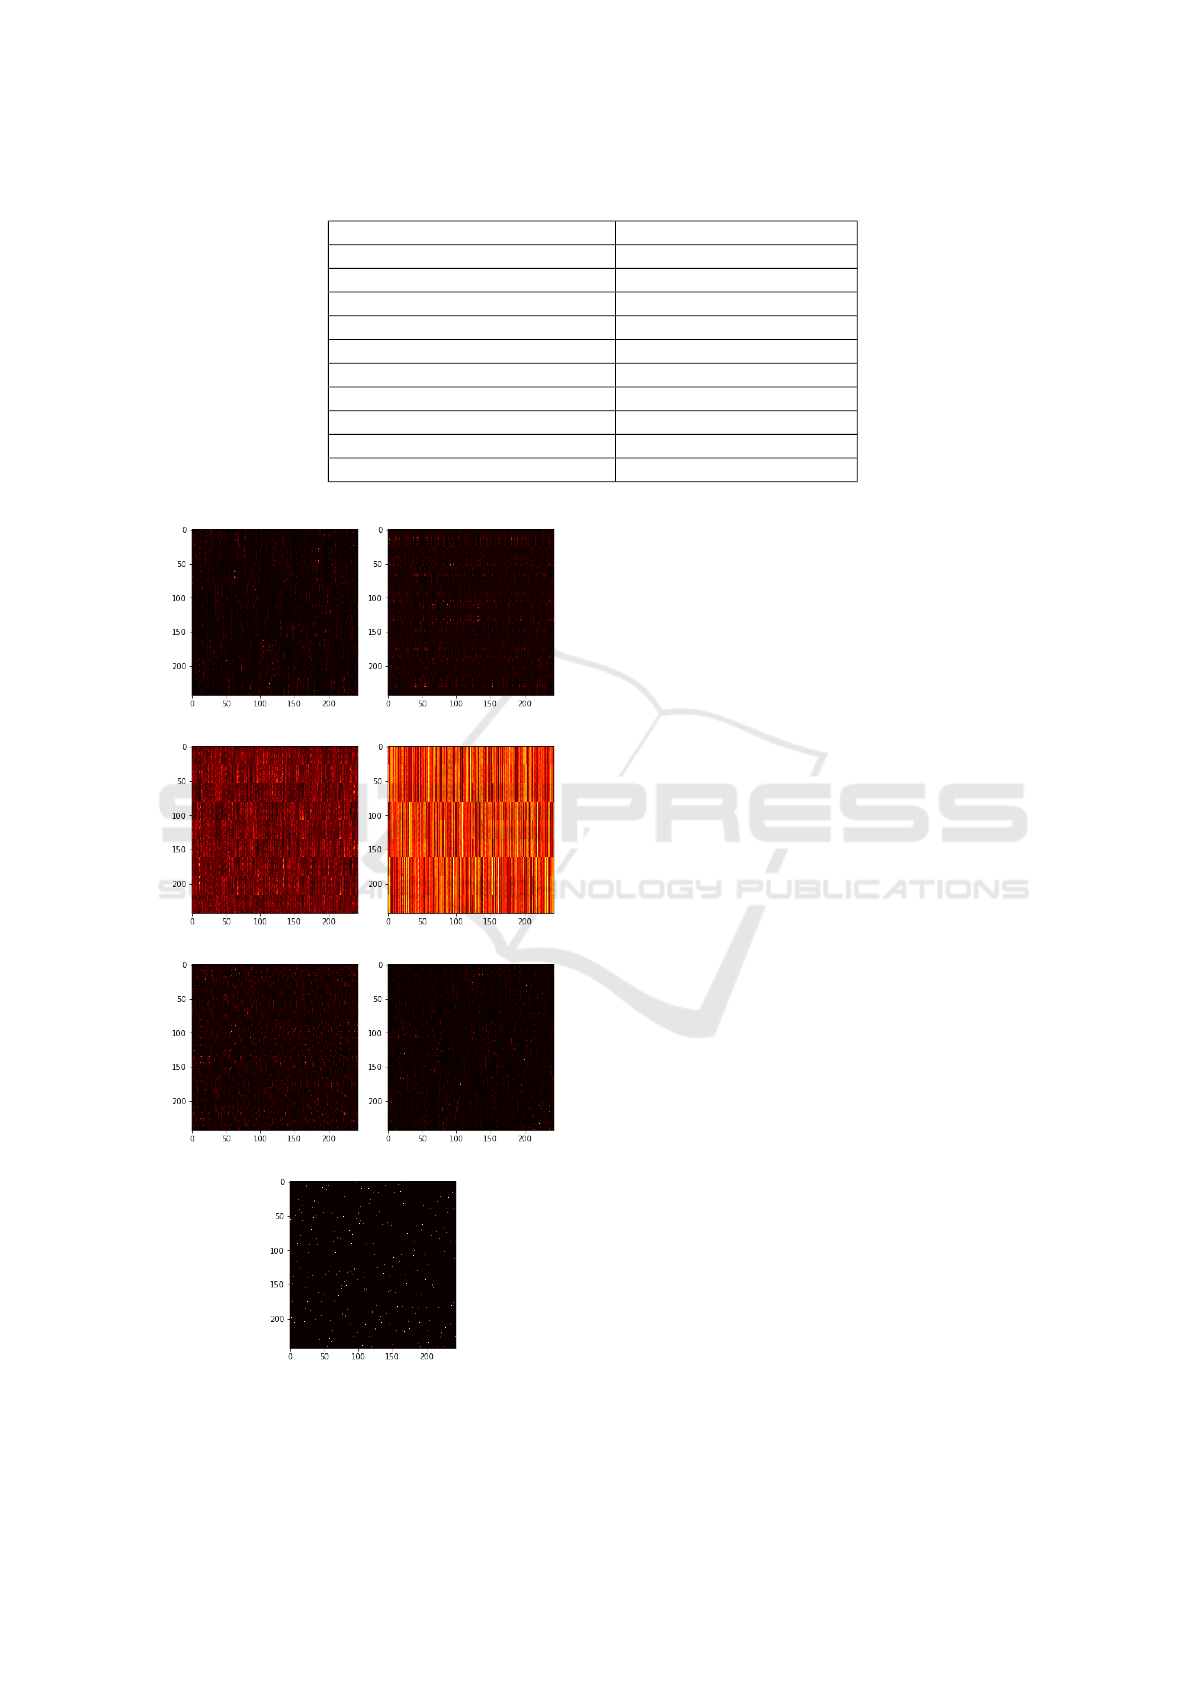
Table 1: Average Entropy of LDM for a variety of classifiers.
Model Average Entropy of LDM
Random Forest -3100
Gaussian Na
¨
ıve Bayes -1728
Gaussian Process Classifier -1244
AdaBoost Classifier -1264
Quadratic Discriminant Analysis -1128
Decision Tree Classifier -4908
K-Nearest Neighbors (K = 10) -1178
K-Nearest Neighbors (K = 5) -8429
K-Nearest Neighbors (K = 3) -18175
K-Nearest Neighbors (K = 1) -17227
(a) Random Forest (b) Gaussian Naive Bayes
(c) Gaussian Process (d) AdaBoost
(e) QDA (f) KNN-3
(g) Decision Tree
Figure 1: LDM Heatmaps for various classifiers.
ers, but still regular. It seems like there are three bands
or sections regardless of the information resource that
the model was trained on. In generating this matrix,
we used a holdout set of size 5, where there were 3
classes. Since the ordering of the labelings along the
y-axis are ordered lexicographically (with “00000” as
the first labeling of the y-axis), the ridges of the matrix
are potentially caused by the shift from labelings that
start with a “0”, to labelings that start with a “1”, and
finally to labelings that start with a “2”. This is fur-
ther verified by the fact that there are 3
4
= 81 unique
labelings of the holdout set that begin with a “0” and
we can see that the first ridge of the heatmap occurs
at exactly index 81.
Conversely, the heatmap for the Decision Tree
Classifier is dark overall, scattered with tiny spikes of
light color. This means that its model confidently as-
signs most probability mass to a single or few possible
labelings, and no probability mass to other possible
labelings. The Random Forest and KNN-3 classifiers
have an appearance that is somewhere in between the
extremes represented by the Gaussian Process Clas-
sifier and the Decision Tree Classifier. Comparing to
the table, however, we see that the heatmap appear-
ance doesn’t fit neatly into the pattern of increasing
entropy values for successive models.
The LDM attempts to capture two aspects simul-
taneously: the variation between output simplex vec-
tors for models trained on different datasets, and the
confidence (sparsity) within each individual simplex
vector which determines how much probability mass
is placed on the preferred labeling for a given dataset.
In combining these two dimensions into a single num-
ber, the LDM estimation procedure loses some infor-
mation, in that we do not know if a final high en-
tropy value represents the averaging of many diverse
high confidence vectors, or the averaging of less con-
fident models, which produce homogeneous simplex
vectors and lead to the same observed value. Flexi-
ble models should make confident predictions and be
ICAART 2020 - 12th International Conference on Agents and Artificial Intelligence
984

responsive to new data, leading to diverse output sim-
plex vectors. Combining these features into a single
number that measures capacity is the goal of the LDM
process, of which it is only partially successful.
2 SHORTCOMINGS
As notes in our Results section, the full LDM pro-
cess seems to struggle in combining the two aspects
of flexible models in an unambiguous way. Further-
more, we observe some values and trends which dis-
agree with our traditional understanding of the rel-
ative flexibility of various methods. For example,
KNN-1 should be the most prone to overfitting, hav-
ing the greatest flexibility, yet its average entropy
value is lower than that of KNN-10, which should be
far more constrained and thus far less flexible.
The problem could stem from one or more aspects
of the procedure. Perhaps crucial information was lost
as a result of averaging the values of the simplex vec-
tors, as suggested in the previous section. In addition,
by making algorithms output probabilities based on
conditional independence of test instance labelings,
this allows an algorithm like KNN-10 to place posi-
tive probability mass on many more individual test in-
stances (likely having some nonzero number of neigh-
bors with any chosen class label), whereas KNN-1
can only ever assign positive probability to the la-
bel of its single neighbor. Treating arbitrary simplex
vectors as parameters for a Dirichlet model may also
be problematic, since this modeling assumption was
made for simplicity.
Lastly, given the negative entropy values of the
LDM process, it is difficult to understand these as
positive capacity values, undermining the purpose for
which the LDM was proposed. Negative entropy val-
ues can arise when using differential entropy, as when
estimating the entropy of a continuous Dirichlet dis-
tribution. For the LDM-Dirichlet process to be used,
one would still need a way of correlating entropy
scores to storage capacity in bits.
3 FUTURE WORK
Given the aforementioned shortcomings of the LDM
process and the continued need for methods of esti-
mating algorithm capacity, other approaches should
continue to be pursued. The question of how to es-
timate algorithm capacity is important, and failing to
find a general solution to the question does not render
the question any less important.
One particularly promising idea, inspired by re-
search in deep neural networks, is to use a form of
autoencoder (Doersch, 2016; Olshausen and Field,
1996; Lee et al., 2007; Bengio et al., 2014; Bengio
et al., 2013; Kingma and Welling, 2014) as applied
to training data with labels that are independent of
features. Generalization requires being able to pre-
dict labels given knowledge of the true relationship
between features and labels. For a dataset with no
relationship (in other words, with independence be-
tween features and labels), the only way an algorithm
can reproduce the labels from the training dataset con-
sistently is to memorize them, which it can do only in
proportion to its capacity. Thus, for binary labels, the
number of labels the algorithm can correctly retrieve
in testing is the capacity (in bits) of how many labels
it could memorize, plus some small number of luck-
ily guessed labels (the number of which can be bound
with high probability).
A label recorder takes randomly generated labels
and independent training features comprising a train-
ing dataset, trains on that dataset, then tests on the
same training set. The number of correctly repro-
duced labels will give a point estimate of the capacity,
subject to random variation. Repeating this process
and taking the average of the observed capacities will
allow one to get an increasingly tighter estimate of the
true algorithm capacity, arguably with fewer assump-
tions and steps than the LDM process.
Table 2 shows preliminary label recorder results
for the models tested. Each method was tested on
a set of 150 instances from the Iris dataset (Fisher,
1936), with labels generated independently and uni-
formly at random. The point estimates were the aver-
age number of labels correctly recovered at test time,
averaged over 1000 independent trials for each model.
As can be seen from the table, we have unpruned De-
cision Trees and the Random Forest Classifier having
the highest estimated capacity, while more bias-heavy
models such as Quadratic Discriminant Analysis and
Gaussian Na
¨
ıve Bayes have less capacity. Further-
more, the estimated capacities for KNN as a func-
tion of the regularization parameter K show decreas-
ing capacity with increasing K, aligning better with
our intuition than the LDM inferred entropies. Thus,
label recorders present a promising avenue for esti-
mating algorithm capacity. Creating label recorders
and using them to provide rigorous bounds on algo-
rithm capacity is the subject of future work, which
we hope will complement (if not supersede) the work
presented here.
The Labeling Distribution Matrix (LDM): A Tool for Estimating Machine Learning Algorithm Capacity
985
Table 2: Estimated capacity of a variety of classifiers using label recorders, with 95% confidence intervals.
Model Estimated Capacity 95% CI
Random Forest 144.79 [144.66, 144.92]
Gaussian Na
¨
ıve Bayes 60.79 [60.53, 61.06]
Gaussian Process Classifier 75.00 [74.75, 75.26]
AdaBoost Classifier 92.58 [92.24, 92.91]
Quadratic Discriminant Analysis 69.53 [69.22, 69.83]
Decision Tree Classifier 149.34 [149.31, 149.37]
K-Nearest Neighbors (K = 10) 73.26 [72.91, 73.61]
K-Nearest Neighbors (K = 5) 82.85 [82.50, 83.19]
K-Nearest Neighbors (K = 3) 93.74 [93.40, 94.08]
K-Nearest Neighbors (K = 1) 149.34 [149.31, 149.37]
4 CONCLUSIONS
In an attempt to estimate the capacity of algorithms,
as a measure of the amount of data their models can
store, we introduce the LDM. We tested the LDM pro-
cedure on several learning models and observed the
average entropy values over a variety of datasets. Our
results highlighted interesting behaviors of the algo-
rithms tested, but were not as conclusive or consistent
as initially hoped.
Although the LDM process falls short in several
respects, the underlying idea of a Labeling Distribu-
tion Matrix could prove useful in developing other
methods for measuring algorithm capacity. Perhaps
other ways of averaging or combining data from the
LDM could lead to better, more interpretable results.
Recent theoretical work on entropic expressivity may
be one such application of the LDM (Lauw et al.,
2019). Thus, even though the LDM process is not
a perfect capacity estimation method, the LDM ob-
ject itself might still prove useful as a component of
such a method. Lastly, the label recorders briefly pre-
sented here hold promise for serving as a method of
estimating algorithm capacity, as shown through our
preliminary results.
REFERENCES
Balcan, M.-F. (2011). Rademacher Complexity.
Bengio, Y., Laufer, E., Alain, G., and Yosinski, J. (2014).
Deep generative stochastic networks trainable by
backprop. In International Conference on Machine
Learning, pages 226–234.
Bengio, Y., Yao, L., Alain, G., and Vincent, P. (2013). Gen-
eralized denoising auto-encoders as generative mod-
els. In Advances in neural information processing sys-
tems, pages 899–907.
Doersch, C. (2016). Tutorial on variational autoencoders.
arXiv preprint arXiv:1606.05908.
Fisher, R. A. (1936). The use of multiple measurements in
taxonomic problems. Annals of Eugenics, 7(7):179–
188.
Kingma, D. P. and Welling, M. (2014). Stochastic gradi-
ent vb and the variational auto-encoder. In Second In-
ternational Conference on Learning Representations,
ICLR, volume 19.
Lauw, J., Macias, D., Trikha, A., Vendemiatti, J., and Mon-
tanez, G. D. (2019). The Bias-Expressivity Trade-off.
arXiv e-prints, page arXiv:1911.04964.
Lee, H., Battle, A., Raina, R., and Ng, A. Y. (2007). Effi-
cient sparse coding algorithms. In Advances in neural
information processing systems, pages 801–808.
Minka, T. (2003). Estimating a Dirichlet distribution. Tech-
nical report.
Olshausen, B. A. and Field, D. J. (1996). Emergence
of simple-cell receptive field properties by learn-
ing a sparse code for natural images. Nature,
381(6583):607.
Sklar, M. (2014). Fast MLE computation for the Dirichlet
multinomial.
ICAART 2020 - 12th International Conference on Agents and Artificial Intelligence
986
