
Gene Co-expression Analysis for Lung Cancer Biomarkers Detection
Stefani Kostadinovska, Slobodan Kalajdziski and Monika Simjanoska
Faculty of Computer Science and Engineering, Ss. Cyril and Methodius University,
Rugjer Boshkovikj 16,1000 Skopje, North Macedonia
Keywords:
Gene Expression, Co-expression Gene-based Network, Gene Regulatory Networks, Gene Ontology, Hub
Genes, Biomarkers.
Abstract:
Cancer is one of the most widespread diseases that we come across. The complexity of this disease makes it
difficult to analyze and detect biomarkers with the purpose to ease the targeted treatments. This study presents
a methodology based on gene expression data that provides promising results in terms of revealing potential
biomarkers associated with lung cancer. To accomplish this, gene networks are built presenting the correlation
among the genes. These networks are further analyzed and thus specific modules are created. Hereupon
special representative genes for each of the modules are detected that lead to the identification of potential
biomarkers for lung cancer. The reliability of the revealed biomarkers has been proved in the literature.
1 INTRODUCTION
Each cell has the potential to undergo malignant
changes and lead to the development of cancer.
Cancer cells do not always undergo local diffusion
through the infiltration of the tissue they made up, but
can sometimes spread throughout the body through
the lymphatic system, the bloodstream where they
create metastases. This can happen when the mecha-
nism of a “normal“ cell is disrupted, or simply does
not perform the functions it is intended for. All cells
replicate and this process usually occurs 50-60 times
before the cell dies. Accordingly, malignant cells also
replicate as they grow in atypical forms and infiltrate
into the tissue that comprises (Weinberg, 2013; Panov,
2014).
In addition to cardiovascular disease, which is the first
most common cause of death in the world, the sec-
ond leading cause of death are malignancies (WHO,
2018b). As a synonym for these malignant diseases,
the term cancer is commonly used, which actually en-
compasses a class of hundreds of heterogeneous dis-
eases that, if not treated appropriately and effectively,
lead to the death of the organism. According to the
World Health Organization (WHO), the number of
people who died of lung cancer in 2018 was 2.09 mil-
lion (WHO, 2018a).
Considering the importance of impact these diseases
make, in order to find a solution and proper treat-
ment, a lot of organisations are publishing data for
different cancer types for every researcher, so every-
one can work from a different perspective. One of the
largest database for this kind of data is Data portal
provided by The International Cancer Genome Con-
sortium (ICGC) which contains data from 24 cancer
projects, including ICGC, The Cancer Genome At-
las (TCGA), Johns Hopkins University and the Tu-
mor Sequencing Project (Zhang et al., 2011). Also,
very popular database for cancer related data is The
Cancer Genome Atlas (TCGA) where over the previ-
ous years, it generated over 2.5 petabytes of genomic,
epigenomic, transcriptomic and proteomic data which
can be used for various studies (TCG, 2019).
Detecting and identifying the genes that are respon-
sible for malignant diseases are crucial because they
can help in finding, or creating new targeted drug
treatments with the purpose to help predict patients’
survival and to provide insights into the molecular
mechanisms of tumour progression (Sotiriou et al.,
2006; Bullinger et al., 2004; Adler and Chang, 2006).
Thus, the main challenge is to reveal these genes
by creating a specific methodology that can be in-
terpreted in terms of biology, and which because of
the problem size usually includes various techniques
from biotechnology and computer science.
In this paper, we propose a methodology for
biomarkers detection from lung cancer data. The
methodology relies on gene networks analysis, by
which hidden correlations among the genes are re-
vealed. The paper is organized as follows. In Sec-
tion 2 we present previous studies focused on using
network methods to analyze functional modules of
60
Kostadinovska, S., Kalajdziski, S. and Simjanoska, M.
Gene Co-expression Analysis for Lung Cancer Biomarkers Detection.
DOI: 10.5220/0009176400600067
In Proceedings of the 13th International Joint Conference on Biomedical Engineering Systems and Technologies (BIOSTEC 2020) - Volume 3: BIOINFORMATICS, pages 60-67
ISBN: 978-989-758-398-8; ISSN: 2184-4305
Copyright
c
2022 by SCITEPRESS – Science and Technology Publications, Lda. All rights reserved

genes. The materials for the experiments as well as
the data used in this research are described in Sec-
tion 3. Details of the methodology and the outcomes
are presented in Section 4. In the final Section 5 we
present the conclusions from the research and provide
directions for future work.
2 RELATED WORK
Gene expression profiles are mostly used for analyz-
ing genes and their properties in terms of the whole
genome. Cluster visualization is an intuitive view for
displaying the genes that have similar functions. The
basic idea is to determine how genes interact between
each other and to obtain new properties that can de-
scribe the biological processes that they engage in.
Logical step would be to identify the significantly dif-
ferential expression in two individual samples. How-
ever, such approach would provide limited knowledge
based on the samples that are used, so the best ap-
proach would be to adopt mathematical support where
the patterns of gene expression could be used (Eisen
et al., 1998).
Previous studies show that there is plenty of evi-
dence where genes and their protein products are or-
ganized into functional modules according to cellular
processes and pathways (Segal et al., 2003; Canchi
et al., 2019). One approach to analyse these modules
and interactions is by using network methods where
co-expression modules can be studied with respect to
gene expression profiles. The aim is to find the eigen-
gene of each of the modules that represents the mod-
ule, and build a network of all eigengenes to find the
relationships between consensus modules in different
organisms (Langfelder and Horvath, 2007).
Most of the studies are focused on analyzing the mod-
ules based on some clinical utilities without studying
the emergent properties and behaviours of these genes
at the system level. This approach differs from the
one described in this paper, but it allows us to see
that not only the hub genes are the ones responsible
and considered as biomarkers for some type of cancer
(Yang et al., 2014). Another approach is to simultane-
ously use different types of techniques for obtaining
the data from cancerous cells, e.g., SNP array, array-
CGH, CGH, GWAS, where all the data is combined
to build such a network and analysed by using net-
work methods. With this approach the basic idea is to
build ”genome-scale co-expression network” where
new perspective of mutated genes would be shown
and where new significant genes are to be found (Bid-
khori et al., 2013).
3 MATERIALS
The data for this research are taken from GEO (Gene
Expression Omnibus) within NCBI (National Center
for Biotechnology Information) (Edgar et al., 2002).
The data on this platform is mainly from the field
of genomics and is mostly data colected from DNA
microchips and genome sequences. DNA microchips
are one of the most important tools for studying thou-
sands of genes and genome-level gene features. They
are used to investigate the different manifestations of
genomics information in relation to cell processes and
biochemical products that directly reflect the behavior
of one organism or specific cell type, and also show
how it interacts with the others (Rueda, 2018).
The data used for the purpose of this research can
be found by using the ID number GSE116959. The
dataset involves the expression of genes at some point
in some tissue obtained through RNA sequences. The
number of people who participated in the experi-
ment is 57, and the time frame in which the data
have been processed is from 2004 to 2010. Every-
one who participated in this experiment has been di-
agnosed with lung adenocarcinoma. The number of
cancer tissues analyzed is 57, while the number of
tissues classified as healthy is 11. The healthy tis-
sues are taken from the same patients. The platform
on which the gene analysis has been performed is
Agilent-039494 SurePrint G3 Human GE v2 8x60K
Microarray 039381. The total number of probes on
the chip is 50 599. Multiple probes might represent a
single gene.
4 METHODOLOGY AND
RESULTS
In this study, we propose a methodology for analyzing
DNA microchip data, and by using network analysis
we discover the potential biomarkers for lung cancer.
Figure 1 depicts the stages of the proposed method-
ology for analysis of lung cancer microarray data and
prediction of possible lung cancer biomarkers.
As can be seen from the Figure 1, first step is
the network generation from the data obtained from
gene expression profiles. Next, by performing net-
work analysis, modules are built according to certain
rules, upon which gene regulatory networks are built
and gene ontology is applied to determine which bio-
logical processes these genes appear in, and finally by
using the association-by-guilt approach it is possible
to determine whether a gene is a potential biomarker
for lung cancer or not. The methodology presented is
inspired by (van Dam et al., 2017).
Gene Co-expression Analysis for Lung Cancer Biomarkers Detection
61
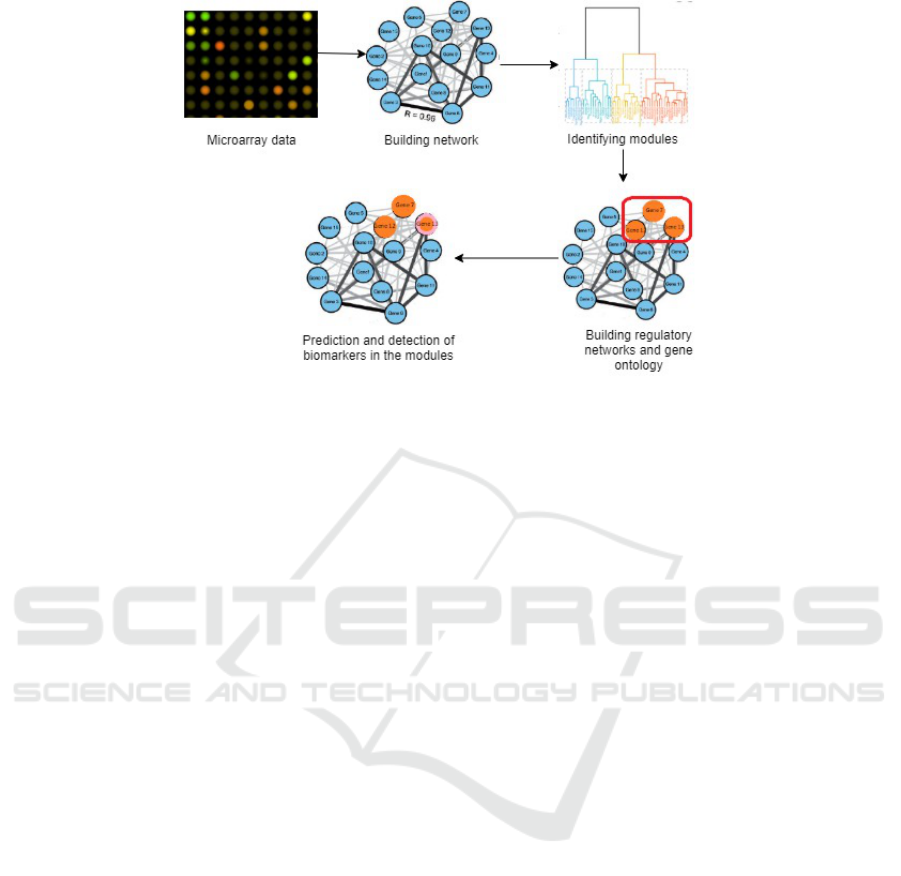
Figure 1: Methodology for analysis of lung cancer data and prediction of possible biomarkers.
4.1 Building a Gene Co-expression
Network
The necessity to build a gene co-expression
correlation-based network is to use the proper-
ties of gene dependencies in order to be able to build
the modules that are later described in this section
(van Dam et al., 2017). The network is created by
using the Weighted gene correlation network analysis
(WGCNA) method (Langfelder and Horvath, 2008).
The first step in creating a network is to calculate
a matrix of co-expressive similarity between all
genes. Absolute correlation is calculated to obtain
the corresponding values for the pair of genes. Most
often in biological networks there are two types
of nodes, those that are highly connected, or hub
nodes, and those that are poorly connected. In order
to adhere to this rule, an additional coefficient β
is obtained by analyzing the data in order to retain
the scale-free property (Zhang and Horvath, 2005).
In other words, each individual element in the
co-expressive similarity matrix is obtained by:
a
i j
= |Corr(x
i
, x
j
)|
β
(1)
where x
i
and x
j
are the expression values of i − th
and j −th gene.
In our case, the coefficient β is 7, obtained by the
use of soft thresholding power which is based on the
criterion to follow scale-free topology proposed by
(Zhang and Horvath, 2005). Using this matrix, links
will be shown describing the similarities, i.e., the ex-
pression patterns of genes that can be found for all
samples. The successive step is to construct a net-
work according to the obtained co-expressive similar-
ity matrix, where each node represents a gene, and
the links between the genes are in fact the presence of
some kind of connection, i.e., dependence on the co-
expressive similarity of the genes (Albert et al., 2002).
Genes in a cell function as a whole and therefore,
are grouped into biological functional units. Con-
sequently the next and the last step of this phase is
the generation of modules, or clusters of co-expressed
genes obtained by the most commonly used technique
for clustering - hierarchical clustering (Yip and Hor-
vath, 2007; Yin et al., 2018).
Due to the large number of microchip probes as well
as the resource constraint, the way the network has
been built is based on blocks. These blocks include a
number of genes that are analyzed. In our case the
maximum number of genes per block is 2000, and
thus each block has been analyzed separately. The
total number of blocks is 27. These blocks contained
groups of linked genes called modules. Each mod-
ule is represented by its eigengene. The first princi-
pal component obtained from the PCA method, that
is the eigengene representing the central gene in the
module, was used to calculate the module’s eigen-
gene. Eventually, the modules whose eigengenes
were highly correlated were fused. The total number
of modules completed is 121.
In order to better analyze these modules, usually the
correlation of all genes belonging to a given module
is analyzed, however, there is an alternative approach
that looks for a correlation between eigengenes and
some clinical traits. In this research, due to the vol-
ume of modules and resource constraints, we were al-
lowed to analyze the correlation between the modules
and the participants’ age. Figure 2 shows the depen-
dencies between the modules and the age of the par-
BIOINFORMATICS 2020 - 11th International Conference on Bioinformatics Models, Methods and Algorithms
62
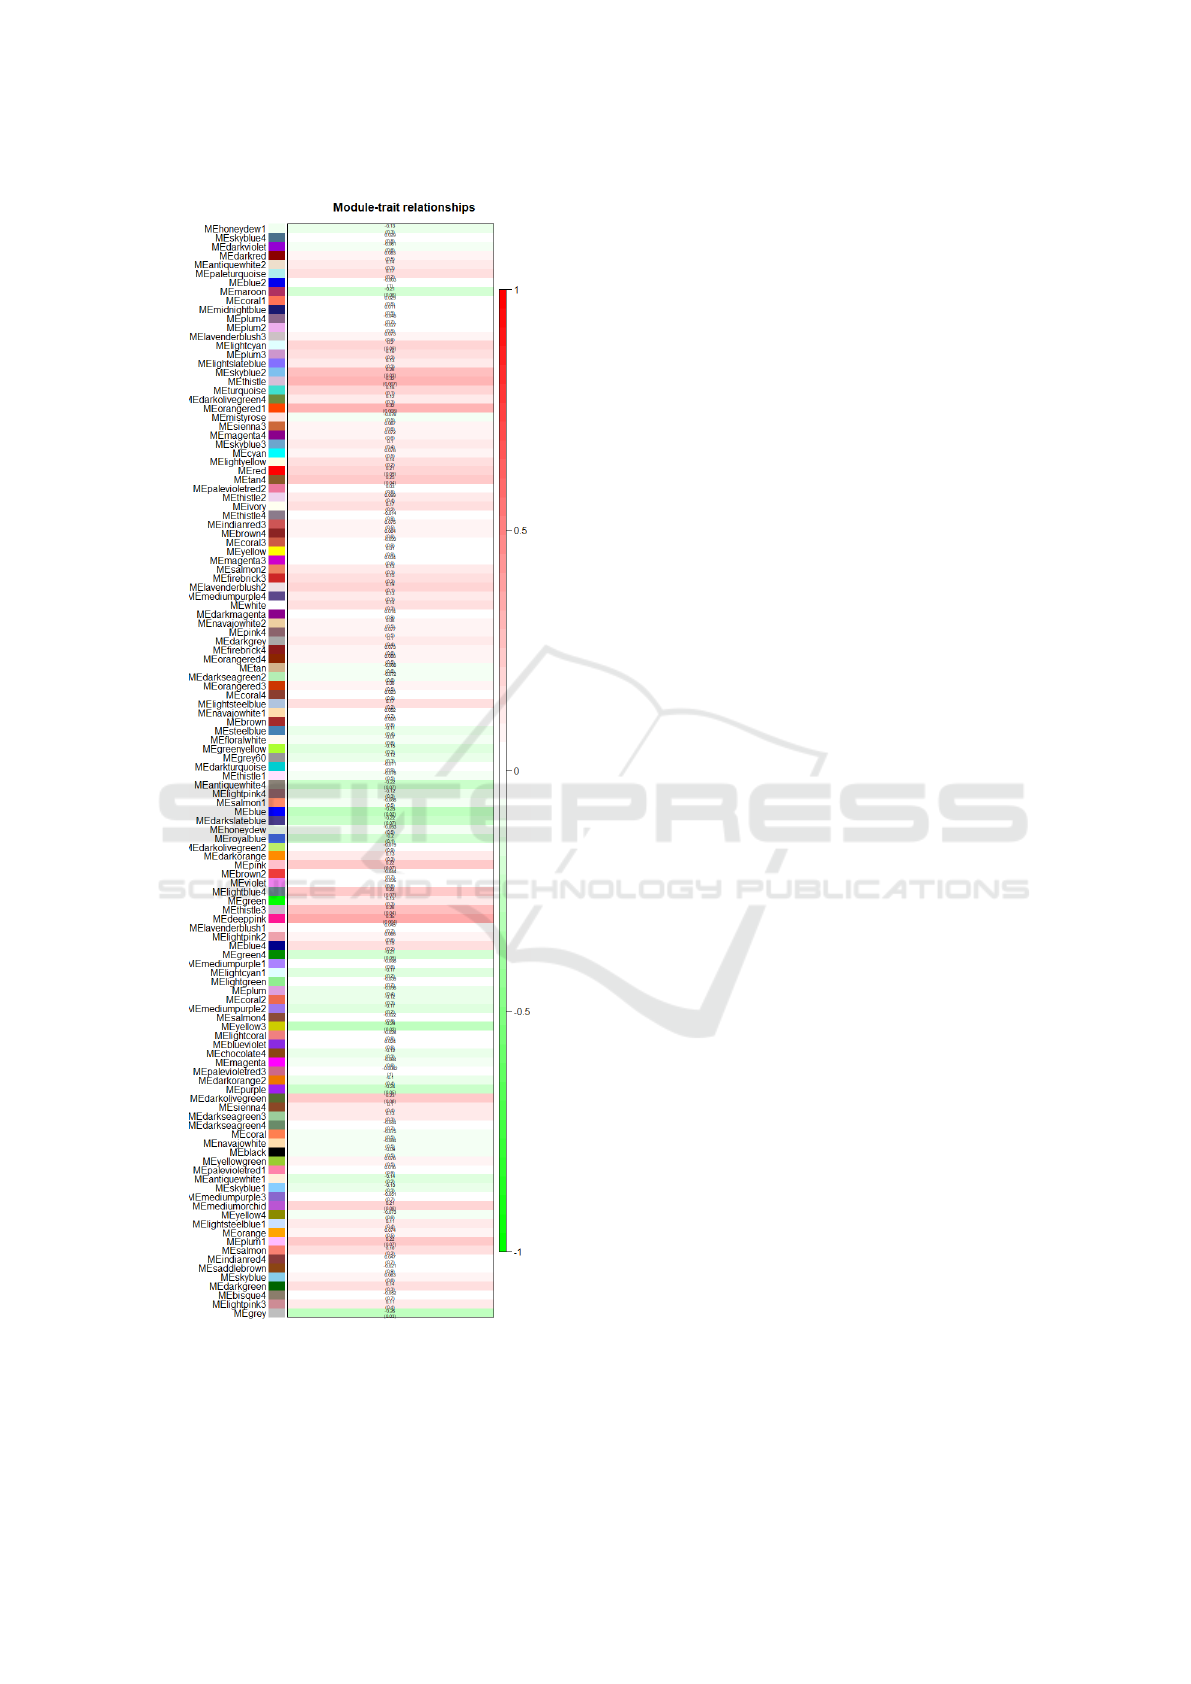
Figure 2: Correlation between module genes and clinical
year data.
ticipants. As it can be seen, the age of the participants
is highly correlated with the modules represented by
the colors deeppink and orangered1 with correlations
of 0.35 and 0.32 respectively. Each row represents the
eigengene of the module, and the column is the age of
the subjects. In each row we have appropriate corre-
lation values and p values. The values in the table are
colored according to legend.
The module deeppink contains a total of 44 genes, and
the module orangered1 contains 52 genes. We will
only use these two modules to create gene regulatory
networks described in the following section.
4.2 Gene Regulatory Networks
In all living organisms the major types of molecules
that are necessary for the performance of ba-
sic biological processes are deoxyribonucleic acid
(DNA), ribonucleic acid (RNA) and proteins. These
molecules are dynamic, in constant interaction with
each other and depend on each other for the complex
biological functions they perform. These molecules,
together with their interactions, build complex net-
works called Gene Regulatory Networks (GRN) (San-
guinetti and Huynh-Thu, 2018).
These networks are important for almost all biologi-
cal processes including cell division, metabolism, cell
cycle. By discovering the dynamics, properties and
functions of these networks, it is possible to build spe-
cific mechanisms for the prevention of various dis-
eases that occur at the cellular level. In general, there
are two different approaches to studying the interac-
tions that occur in the GRN (Iba and Noman, 2016):
• Topological analysis - is based on data obtained
from regulatory interactions such as protein-DNA
interactions and protein-protein interactions.
• Conclusion on Regulatory Gene Connection -
based on data obtained from gene expertise.
These GRN can be modeled using coupled ordinary
differential equations, boolean networks, continuous
networks, stochastic gene networks. Using one of
these approaches and data from biological experi-
ments, we can build a GRN where we can study and
analyse gene interactions.
We used the GeneMANIA (Franz et al., 2018) tool
to build these networks. The modules specified in sec-
tion 4.1, were selected individually to find out what
are the true functional similarities, by using already
published and verified evidence. In both modules we
had a number of trials that were not annotated with
genes, or had gene symbols that could not be found in
the GeneMANIA application database and were man-
ually removed from the list. The table 1 lists the genes
included in the modules that can be found in the Gen-
eMANIA database.
Gene Co-expression Analysis for Lung Cancer Biomarkers Detection
63
GRN is build using prior knowledge for the query
genes, where the query genes are seen as a part of a
protein complex or they have a similar protein domain
structures using additional databases that contains re-
lated information for protein complexes. Although,
this tool often finds additional members to that com-
plex in order to give high weight to physical interac-
tions or predicted physical interactions.
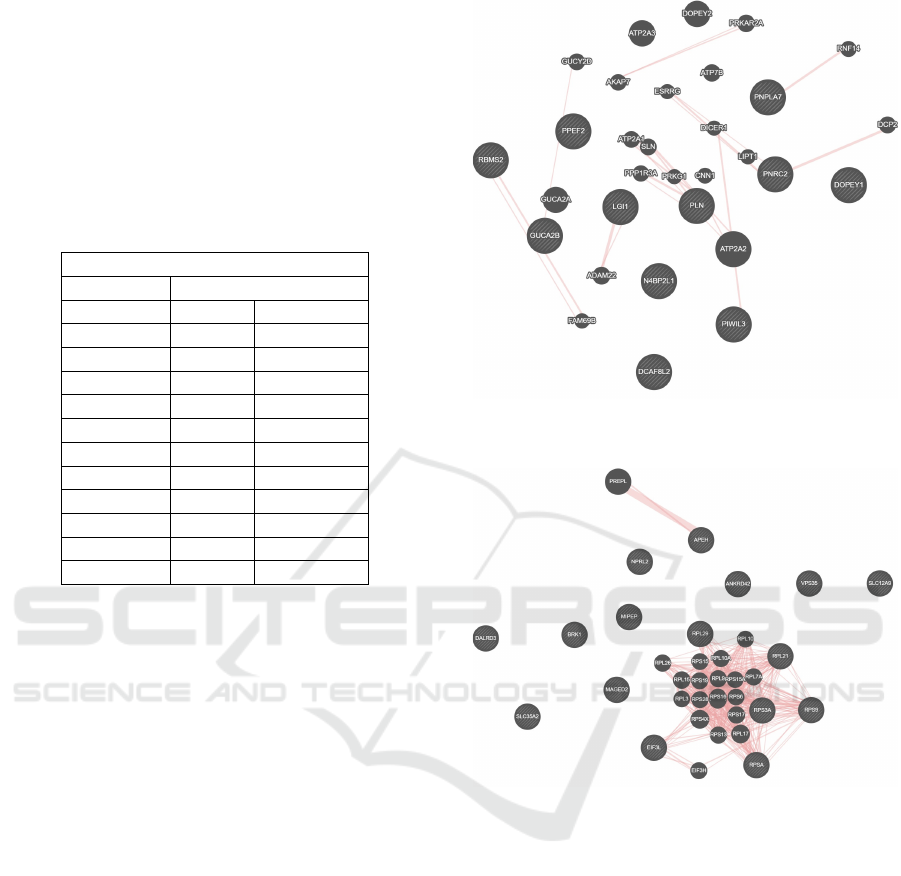
Table 1: List of the genes found in the modules and found
in the GeneMANIA database.
Modules
Deep pink Orange Red 1
DCAF8L2 RPL21 RPL29
GUCA2B RPS3A DALRD3
DOPEY1 RPL21 BRK1
N4BP2L1 RPS9 EIF3L
PNPLA7 RPSA ANKRD42
PPEF2 RPSA MIPEP
PIWIL3 RPL29 SLC12A9
PLN MIPEP APEH
LGI1 RPL29 SLC35A2
PNRC2 RPSA MAGED2
RBMS2 RPL29 RPSA
VPS35
These modules build two networks corresponding
to each module and are shown in the Figure 3 and Fig-
ure 4, correspondingly. As can be seen, in both fig-
ures there are additional genes that are involved man-
ually through the application itself in order to capture
physical interactions between the genes. The num-
ber of genes that can be added to the network is lim-
ited to 20, and all other parameters are left to their
default values. In addition to these physical inter-
actions, the network can also be analyzed in terms
of co-expression of these genes, genetic interaction,
pathways involved and co-localization. For the pur-
pose of this research, only physical interactions have
been considered. The genes that belong to the module
in each of the Figures 3 and 4 are marked with lines
inside the circle.
4.3 Gene Ontology
The probes, i.e., the genes found on the microchips if
we look at them individually, they do not have a func-
tional unit role as such, unless we include them in an
organism. In order to find out how and in which pro-
cesses these genes participate, we will first visualize
them in terms of the processes in which they partic-
ipate by using some kind of ontology. Gene ontol-
ogy (GO) connects to the largest and most important
Figure 3: Physical interaction network between genes in the
deeppink module using the GeneMANIA application.
Figure 4: Physical interaction network between genes in the
orangered1 module using the GeneMANIA application.
database when it comes to the function of genes (Con-
sortium, 2004).
The GO knowledge base is a structured database that
formally expresses the classes of gene functions as
well as the specific relationships that genes have with
each other. Logical rules and axioms are often de-
fined to maintain this structure as well as to facili-
tate the study and analysis of gene relationships. The
GO structure is constantly evolving and upgrading in
order to build more detailed networks and build on
current knowledge of molecular biology for the or-
ganisms being studied. In order to better understand
the visualization of data through gene ontology, spe-
cial annotations are used that are well known to all
who perform research in these areas (The Gene On-
tology Consortium, 2018).
In addition to the physical interactions of the
BIOINFORMATICS 2020 - 11th International Conference on Bioinformatics Models, Methods and Algorithms
64
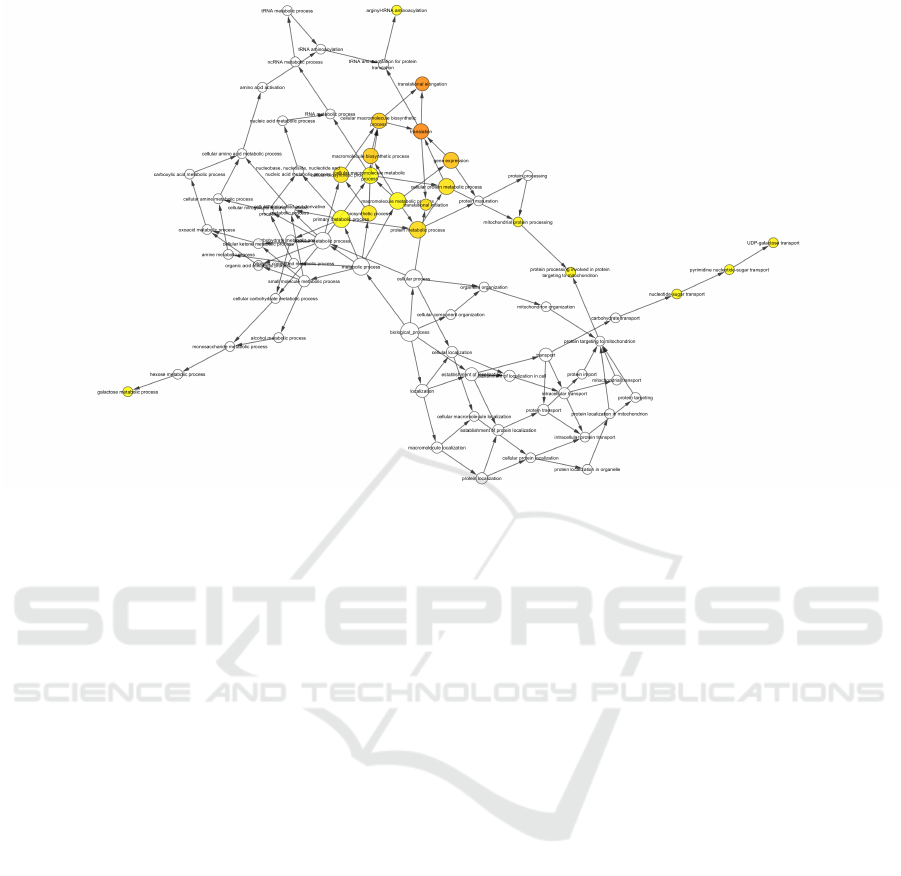
Figure 5: GO network of genes that participate in the orangered1 module, in relation to the biological process in which they
participate.
genes in the modules, we also found the biological
processes in which these genes participate. Figure
5 shows the processes in which genes from oran-
gered1 module participate. It can be seen that most
of the genes participate in the processes translational
elongation and translation, whereas for the deeppink
module we were unable to determine which biologi-
cal processes the genes participate in, due to the small
number of genes in the module. Nodes that are darker
in yellow mean more genes involved in that particu-
lar process, and those in white mean less or no genes
at all. BiNGO (Biological Networks Gene Ontology)
tool running on the Cytoscape (Maere et al., 2005)
platform was used for this type of analysis.
4.4 Biomarkers Detection and
Identification
Using the modules built and described in Section 4.1,
the next step is to find the hub nodes in these net-
works. Hub nodes are defined as nodes that have a
high degree of intra-modular connectivity (Zhu et al.,
2019). These genes often play an important role in
cells. We consider a gene to be a hub if its signifi-
cance is greater than 0.3 and module membership is
greater than 0.6. Gene Significance - GS and Mod-
ule Membership - MM are calculated by the following
equations:
GS = |corr(x, t)|
β
(2)
MM = |corr(x, M)| (3)
where x is gene expression, t is clinical trait and M is
the eigengene of the module.
Considering the given conditions, the hub genes,
or potential biomarkers, in the deeppink module are
DCAF8L2 and GUCA2B, while in orangered1 mod-
ule are RPL21 and RPS3A. It is important to note that
these hub genes are biased towards the dataset used
because of the influence of clinical traits over the cor-
relation calculation. Concerning potential biomark-
ers, using related studies investigating lung cancer-
related genes, it has been confirmed that all genes
involved in biomarkers are part of the lung cancer
cells (Sun et al., 2004; Slizhikova et al., 2005; Yim
et al., 2011; Montazeri et al., 2019). Additionally, the
biomarker GUCA2B has been previously reported in
a related research to be also relevant biomarker for
colorectal cancer (Simjanoska et al., 2013).
Fig. 6 presents the expression of the corresponding
detected biomarkers at healthy and cancer tissues ob-
tained from anonymous participants p1 − p9. The ex-
pressions are completely comparable since they rep-
resent pairs of tissues, meaning from each participant
p1 − p9 there is normal (healthy) and corresponding
cancer tissue. Given the values on the graph, it can be
seen that at most of the participants, the expressions
of all the four biomarkers completely show separabil-
ity between the normal and the cancer tissues. Even
though, for some participants part of the biomarkers
Gene Co-expression Analysis for Lung Cancer Biomarkers Detection
65

Figure 6: Biomarkers expressions at healthy and cancer tissues.
might show very close values, there is still at least one
biomarker that distinguishes between the two health
conditions.
5 CONCLUSION
In this research, a methodology for analyzing genetic
data by creating networks using the WGCNA pack-
age is presented. These networks are based on co-
expression of genes, and as a result, modules that
contain biologically functional information are ob-
tained. Hereupon, gene regulatory networks have
been built by which we discovered the physical in-
teractions among genes. Even more, the biological
dependence among the genes involved in the modules
has been inspected, and an analysis of which biolog-
ical processes the genes were involved in has been
done, all in correspondence with their correlation with
clinical data, that is the participant’s age in this study.
The last phase of this research was to find hub genes
in the network created in the first phase, meaning, to
identify hub genes in highly correlated modules with
respect to some clinical traits. Those hub genes would
represent potential biomarkers for the disease of inter-
est in this paper. For some of the revealed biomark-
ers, the related research prove their connection to lung
cancer.
Due to the limitations and complexity of the algo-
rithms and methods used in this study, we have iden-
tified 4 potential genes that may represent potential
biomarkers. In the future, more reliable results can
be obtained if more clinical data on the participant’s
health are available, meaning it can aid the process of
central genes detection in the modules. Additionally,
the research can be improved if the data is grouped
by stage of progress of the cancer. By obtaining mod-
ules for each cancer progression stage, we would be
able to reveal the potential biomarkers for each phase,
which is a basis for deeper analysis and understanding
of the lung cancer.
REFERENCES
(2018a). Cancer. https://www.who.int/news-room/
fact-sheets/detail/cancer. [Online; accessed 11-
October-2019].
(2018b). The top 10 causes of death. https:
//www.who.int/news-room/fact-sheets/detail/
the-top-10-causes-of-death. [Online; accessed
06-October-2019].
(2019). The cancer genome atlas. https://www.cancer.gov/
tcga. [Online; accessed 20-October-2019].
Adler, A. S. and Chang, H. Y. (2006). From description to
causality: mechanisms of gene expression signatures
in cancer. Cell Cycle, 5(11):1148–1151.
Albert, R. et al. (2002). A.-l. baraba si. Statistical mechan-
BIOINFORMATICS 2020 - 11th International Conference on Bioinformatics Models, Methods and Algorithms
66

ics of complex networks, Rev. Mod. Phys, 74(1):47–
97.
Bidkhori, G., Narimani, Z., Ashtiani, S. H., Moeini, A.,
Nowzari-Dalini, A., and Masoudi-Nejad, A. (2013).
Reconstruction of an integrated genome-scale co-
expression network reveals key modules involved in
lung adenocarcinoma. PloS one, 8(7):e67552.
Bullinger, L., D
¨
ohner, K., Bair, E., Fr
¨
ohling, S., Schlenk,
R. F., Tibshirani, R., D
¨
ohner, H., and Pollack, J. R.
(2004). Use of gene-expression profiling to iden-
tify prognostic subclasses in adult acute myeloid
leukemia. New England Journal of Medicine,
350(16):1605–1616.
Canchi, S., Raao, B., Masliah, D., Rosenthal, S. B., Sasik,
R., Fisch, K. M., De Jager, P. L., Bennett, D. A., and
Rissman, R. A. (2019). Integrating gene and protein
expression reveals perturbed functional networks in
alzheimer’s disease. Cell reports, 28(4):1103–1116.
Consortium, G. O. (2004). The gene ontology (go) database
and informatics resource. Nucleic acids research,
32(suppl 1):D258–D261.
Edgar, R., Domrachev, M., and Lash, A. E. (2002). Gene
expression omnibus: Ncbi gene expression and hy-
bridization array data repository. Nucleic acids re-
search, 30(1):207–210.
Eisen, M. B., Spellman, P. T., Brown, P. O., and Botstein,
D. (1998). Cluster analysis and display of genome-
wide expression patterns. Proceedings of the National
Academy of Sciences, 95(25):14863–14868.
Franz, M., Rodriguez, H., Lopes, C., Zuberi, K., Montojo,
J., Bader, G. D., and Morris, Q. (2018). Genemania
update 2018. Nucleic acids research, 46(W1):W60–
W64.
Iba, H. and Noman, N. (2016). Evolutionary computation
in gene regulatory network research. John Wiley &
Sons.
Langfelder, P. and Horvath, S. (2007). Eigengene networks
for studying the relationships between co-expression
modules. BMC systems biology, 1(1):54.
Langfelder, P. and Horvath, S. (2008). Wgcna: an r pack-
age for weighted correlation network analysis. BMC
bioinformatics, 9(1):559.
Maere, S., Heymans, K., and Kuiper, M. (2005). Bingo: a
cytoscape plugin to assess overrepresentation of gene
ontology categories in biological networks. Bioinfor-
matics, 21(16):3448–3449.
Montazeri, H., Coto-Llerena, M., Bianco, G., Zangeneh, E.,
Taha-Mehlitz, S., Paradiso, V., Srivatsa, S., de Weck,
A., Roma, G., Lanzafame, M., et al. (2019). Apsic:
Analysis of perturbation screens for the identification
of novel cancer genes. bioRxiv, page 807248.
Panov (2014). Basics of Molecular Biology and Genetics.
University ”St. Cyril and Methodius”, Skopje.
Rueda, L. (2018). Microarray image and data analysis:
theory and practice. CRC Press.
Sanguinetti, G. and Huynh-Thu, V. (2018). Gene Regula-
tory Networks: Methods and Protocols. Methods in
Molecular Biology. Springer New York.
Segal, E., Wang, H., and Koller, D. (2003). Discovering
molecular pathways from protein interaction and gene
expression data. Bioinformatics, 19(suppl 1):i264–
i272.
Simjanoska, M., Bogdanova, A. M., and Panov, S. (2013).
Gene ontology analysis of colorectal cancer biomark-
ers probed with affymetrix and illumina microarrays.
In IJCCI, pages 396–406.
Slizhikova, D., Vinogradova, T., and Sverdlov, E. (2005).
The nola2 and rps3a genes as highly informative
markers of human squamous cell carcinoma of lung.
Russian Journal of Bioorganic Chemistry, 31(2):178–
182.
Sotiriou, C., Wirapati, P., Loi, S., Harris, A., Fox, S.,
Smeds, J., Nordgren, H., Farmer, P., Praz, V., Haibe-
Kains, B., et al. (2006). Gene expression profiling in
breast cancer: understanding the molecular basis of
histologic grade to improve prognosis. Journal of the
National Cancer Institute, 98(4):262–272.
Sun, W., Zhang, K., Zhang, X., Lei, W., Xiao, T., Ma, J.,
Guo, S., Shao, S., Zhang, H., Liu, Y., et al. (2004).
Identification of differentially expressed genes in hu-
man lung squamous cell carcinoma using suppression
subtractive hybridization. Cancer letters, 212(1):83–
93.
The Gene Ontology Consortium (2018). The Gene Ontol-
ogy Resource: 20 years and still GOing strong. Nu-
cleic Acids Research, 47(D1):D330–D338.
van Dam, S., Vosa, U., van der Graaf, A., Franke, L., and
de Magalhaes, J. P. (2017). Gene co-expression analy-
sis for functional classification and gene–disease pre-
dictions. Briefings in bioinformatics, 19(4):575–592.
Weinberg, R. A. (2013). The Biology of Cancer: Second
International Student Edition. WW Norton & Com-
pany.
Yang, Y., Han, L., Yuan, Y., Li, J., Hei, N., and Liang, H.
(2014). Gene co-expression network analysis reveals
common system-level properties of prognostic genes
across cancer types. Nature communications, 5:3231.
Yim, W. C., Min, K., Jung, D., Lee, B.-M., and Kwon,
Y. (2011). Cross experimental analysis of microar-
ray gene expression data from volatile organic com-
pounds treated targets. Molecular & Cellular Toxicol-
ogy, 7(3):233.
Yin, L., Cai, Z., Zhu, B., and Xu, C. (2018). Identification
of key pathways and genes in the dynamic progression
of hcc based on wgcna. Genes, 9(2):92.
Yip, A. M. and Horvath, S. (2007). Gene network inter-
connectedness and the generalized topological overlap
measure. BMC bioinformatics, 8(1):22.
Zhang, B. and Horvath, S. (2005). A general framework for
weighted gene co-expression network analysis. Statis-
tical applications in genetics and molecular biology,
4(1).
Zhang, J., Baran, J., Cros, A., Guberman, J. M., Haider,
S., Hsu, J., Liang, Y., Rivkin, E., Wang, J., Whitty,
B., et al. (2011). International cancer genome con-
sortium data portal—a one-stop shop for cancer ge-
nomics data. Database, 2011.
Zhu, Z., Jin, Z., Deng, Y., Wei, L., Yuan, X., Zhang, M.,
and Sun, D. (2019). Co-expression network analysis
identifies four hub genes associated with prognosis in
soft tissue sarcoma. Frontiers in genetics, 10:37.
Gene Co-expression Analysis for Lung Cancer Biomarkers Detection
67
