
Determination of ISO 22400 Key Performance Indicators
using Simulation Models: The Concept and Methodology
Mateusz Kikolski
a
Faculty of Engineering Management, Bialystok University of Technology, Bialystok, Poland
Keywords: ISO 22400, Key Performance Indicators, Plant Simulation, Manufacturing Simulation.
Abstract: The study focuses on developing an approach to determining production key performance indicators (KPIs).
Different types of KPIs have been defined and their distribution has been determined. The article deals with
the problem of how to determine indicators. A review of KPIs and ISO 22400 was carried out. The author's
own methodology for simulation determination of indicators was proposed. The conducted case studies were
prepared on the basis of sample processes in order to indicate the mechanism of proceeding in the author's
methodology. The research used one of the available systems for designing and optimizing virtual models of
production processes and showed the possibilities of its use in the analysis of production processes.
1 INTRODUCTION
In today's highly competitive and dynamic business
environment, manufacturing industry faces new
challenges that require a broader view of the four
main classes of production attributes, i.e. cost, time,
quality and flexibility, as well as the need to increase
productivity.
The problem with a reliable and unambiguous
assessment of production efficiency is the lack of
ability to use comprehensive indicators to determine
it. Productivity is analyzed at the level of workstation,
individual operation, as well as the entire production
process and production lines. There are difficulties in
understanding and selecting specific indicators for
research, and there is a growing need for quick and
clear key performance indicators for sustainable
production (Kibira, Brundage, Feng, Morris, 2018).
Depending on the specifications of the production
process and the industry in which the company
operates, production lines can vary considerably in
design and configuration (Zwierzyński, 2018), which
can also affect how these processes are measured.
The performance indicators are a reference point
for employees, reflect current process characteristics,
facilitate collaboration rules that are defined, clear
and acceptable to all parties. At the operational level,
the indicators are used to solve current problems in a
dynamic way, while when planning and setting
a
https://orcid.org/0000-0003-1875-2625
strategies, they are used to analyze and build
objectives based on results. KPIs include a set of
individually selected indicators, which can be either
financial or non-financial (Rydzewska-Włodarczyk,
Sobieraj, 2015).
The aim of introducing KPIs into the production
process is to provide support to managers and to
enable them to quickly, easily and transparently
review the overall state of production processes in all
segments in a sustainable way. When a section fails
to meet predefined requirements, the manager is
quickly informed to find the cause and take further
action. In this way, potential damage can be avoided
or minimized (Rakar, Zorzut, Jovan, 2004).
2 ISO 22400 KEY
PERFORMANCE INDICATORS
According to ISO 22400, KPIs are defined as
quantifiable and strategic measurements that reflect
the critical success factors of an organization. Key
performance indicators are very important for
understanding and improving production efficiency.
ISO 22400 is a standard defined by the International
Organization for Standardization that defines how to
define, compose, exchange and use Key Performance
Indicators (KPIs) to support the management of
92
Kikolski, M.
Determination of ISO 22400 Key Performance Indicators using Simulation Models: The Concept and Methodology.
DOI: 10.5220/0009175800920099
In Proceedings of the 8th International Conference on Model-Driven Engineering and Software Development (MODELSWARD 2020), pages 92-99
ISBN: 978-989-758-400-8; ISSN: 2184-4348
Copyright
c
2022 by SCITEPRESS – Science and Technology Publications, Lda. All rights reserved
production operations. ISO 22400 defines these
principles in a way that is as independent as possible
of the industry in which the manufacturing company
operates. It is defined by two catalogues: ISO 22400-
1:2014 (ISO 22400-1:2014) and ISO 22400-2:2014
(ISO 22400-2:2014).
ISO 22400 specifies an industry-neutral
framework for defining, composing, exchanging, and
using key performance indicators (KPIs) for
manufacturing operations management (MOM), as
defined in IEC 62264‑1 for batch, continuous and
discrete industries. ISO 22400-1:2014 provides an
overview of what a KPI is, presents concepts of
relevance for working with KPIs including criteria for
constructing KPIs, specifies terminology related to
KPIs, and describes how a KPI can be used (ISO
22400-1:2014).
ISO 22400-2:2014 specifies a selected number of
KPIs in current practice. The KPIs are presented by
means of their formula and corresponding elements,
their time behaviour, their unit/dimension and other
characteristics. ISO 22400-2:2014 also indicates the
user group where the KPIs are used, and the
production methodology to which they correspond
(ISO 22400-2:2014). With reference to equipment,
the KPIs in ISO 22400-2:2014 relate to work units, as
specified in IEC 62264 (IEC 62264).
In the literature, a constant upward trend can be
observed in the context of the number of studies
related to KPIs, and a steady increase in the number
of studies on this problem can be observed (Kikolski,
2019).
The indicators describing the operation of the
production system and being an object of the ISO
22400 standard, are characterized by a structured
structure and interrelationships. In ISO-22400-2 all of
the 34 KPIs are divided into four groups in production
systems. These four types are production,
maintenance, quality and inventory operations
management.
The production operations management KPIs deal
with production line activities. These KPIs are mostly
related to product managers and workers that work
close to the production lines.
The maintenance operations management KPIs
are regarding the maintenance of all the
manufacturing resources.
The quality operations management KPIs are of
importance in any manufacturing system, they ensure
that all products produced are of best quality. These
KPIs indicate the performance of whole production
line in terms of quality perspective.
Inventory operations KPIs deal with activities
such as transportation of raw material from
warehouse to production lines and picking up finished
products for storage.
Table 1 presents a set of KPIs of the ISO 22400
standard (P – production, M – maintenance, I –
inventory, Q – quality).
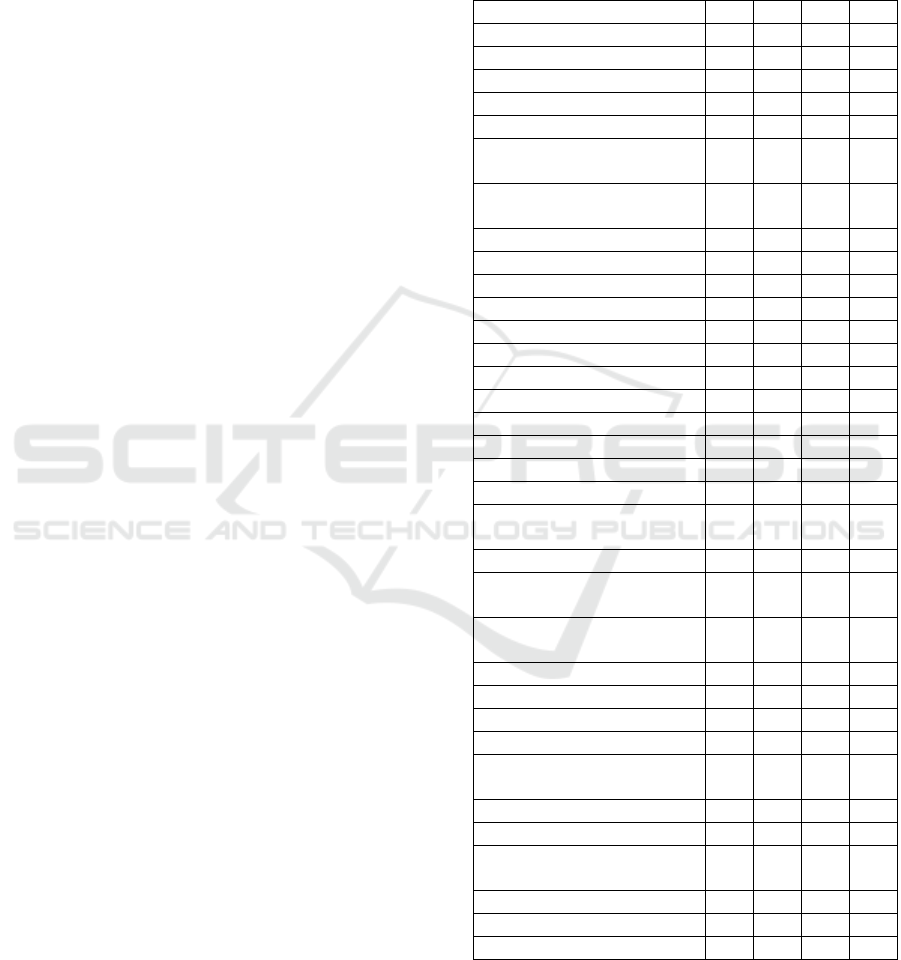
Table 1: ISO 22400 key performance indicators.
KPIs P M I Q
Worker efficiency X
Allocation ratio X
Throughput rate X
Allocation efficiency X
Utilization efficiency X
Overall equipment
effectiveness index
X
Net equipment effectiveness
index
X
Availability X
Effectiveness X
Quality ratio X
Setup ratio X
Technical efficiency X
Production process ratio X
Actual to planned scrap ratio X
First pass yield X
Scrap ratio X
Rework ratio X
Fall off ratio X
Machine capability index X
Critical machine capability
index
X
Process capability index X
Critical process capability
index
X
Comprehensive energy
consumption
X
Inventory turns X
Finished goods ratio X
Integrated goods ratio X
Production loss ratio X
Storage and transportation
loss ratio
X
Other loss ratio X
Equipment load ratio X
Mean operating time
between failures
X
Mean time to failure X
Mean time to repair X
Corrective maintenance ratio X
Source: Usman, 2018.
The values achieved by the KPIs are very helpful
in the decision-making process, enabling the
identification of problems and the undertaking of
Determination of ISO 22400 Key Performance Indicators using Simulation Models: The Concept and Methodology
93
corrective or improvement actions. Proper use of
information from the KPI measurement should
contribute to more effective management of the
organisation's resources (Antczak, Gębczyńska,
2016).
3 RESEARCH METHODOLOGY
KPIs are used to focus on the expectations and needs
of users including the results of production
operations. The purpose of the ISO standards is to
enable the highest possible use of the KPI definition
in a wide variety of industrial sectors and regional
markets. According to ISO 22400, the following steps
are used to select and use KPIs in manufacturing
companies (ISO 22400-1:2014):
• identification of operations and elements of
operations assessed,
• setting targets to be achieved using performance
indicators,
• description of operational activities when
performance indicators are used to meet
expectations,
• definition of criteria for evaluation and
measurement of performance indicators,
• choice of performance indicators,
• evaluation of the results in relation to the
objectives of the performance indicators,
• execution of actions in order to achieve the
objectives set.
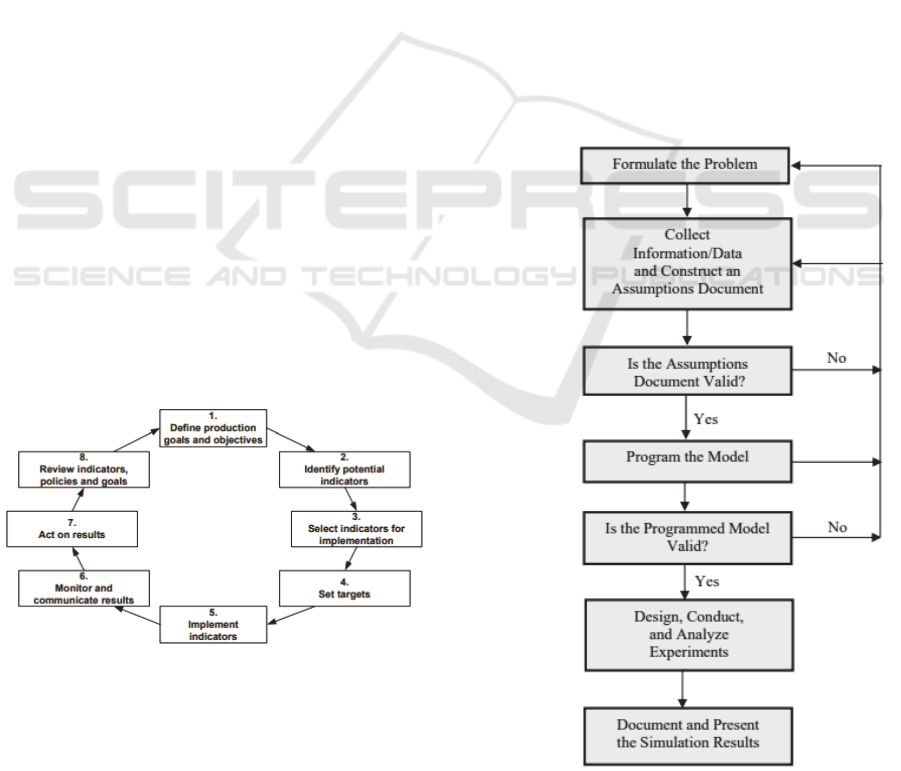
A similar approach (Figure 1) was presented by
Rakar, Zorzut and Jovan. They proposed an 8-step
model of KPI introduction in the form of a loop.
Figure 1: Closed-loop model for defining and measuring
production key performance indicators (Rakar, Zorzut,
Jovan, 2004).
The first step in identifying KPIs is to define
production targets that reflect the organisation's
mission. The next step is to identify potential
indicators showing performance and production
targets. The third step is to select the indicator to be
implemented, the next step is to select the objectives.
The fifth stage involves the implementation of
indicators, contains a set of data, their calculation,
evaluation and interpretation of results. This step is
the most labour-intensive and therefore requires the
participation of staff, especially middle management
of the company. The next step is related to monitoring
the results. In order to continuously improve the
processes, the results of the use of indicators should
be periodically evaluated. The seventh step consists
of actions based on results, which are considered a
critical step in the application of the indicator. The
last step is the review of indicators, principles and
objectives. This is an important step as it is assumed
to be the basis for setting new targets and indicators.
In this step, a possible elimination and selection of
new indicators is carried out.
Approach consists of using simulation models to
research. The creation of a simulation model of a
process is a multi-stage task (Law, 2008). Figure 2
presents the seven-step approach to conducting a
successful simulation study.
Figure 2: A seven-step approach for conducting
a successful simulation study (Law, 2008).
MODELSWARD 2020 - 8th International Conference on Model-Driven Engineering and Software Development
94
The simulation of production processes is a
technique used for solving problems occurring during
the manufacturing process. As a method, a computer
simulation is a system of research activities, i.e. a
structure of stage activities aimed at achieving a
research objective.
Modelling the production process involves the
creation of a virtual manufacturing process that
allows conducting a simulation and collecting
statistics. Statistics facilitate conducting reports and
comparing selected settings of the parameters that
characterise workstations. Computer models can be
freely improved, and further simulations can be
applied to various variants and settings anticipated by
the user (Kikolski, 2016).
Simulation studies are applied to and are used in
many scientific fields (Halicka, 2016). The
application of a simulation in production processes
constitutes a form of experimenting with a computer
model. Its objective is to provide an answer to the
question on how the production system will react to
various situations, according to arranged scenarios.
The application of simulation models allows for a
more effective selection of manufacturing strategies
by enterprises.
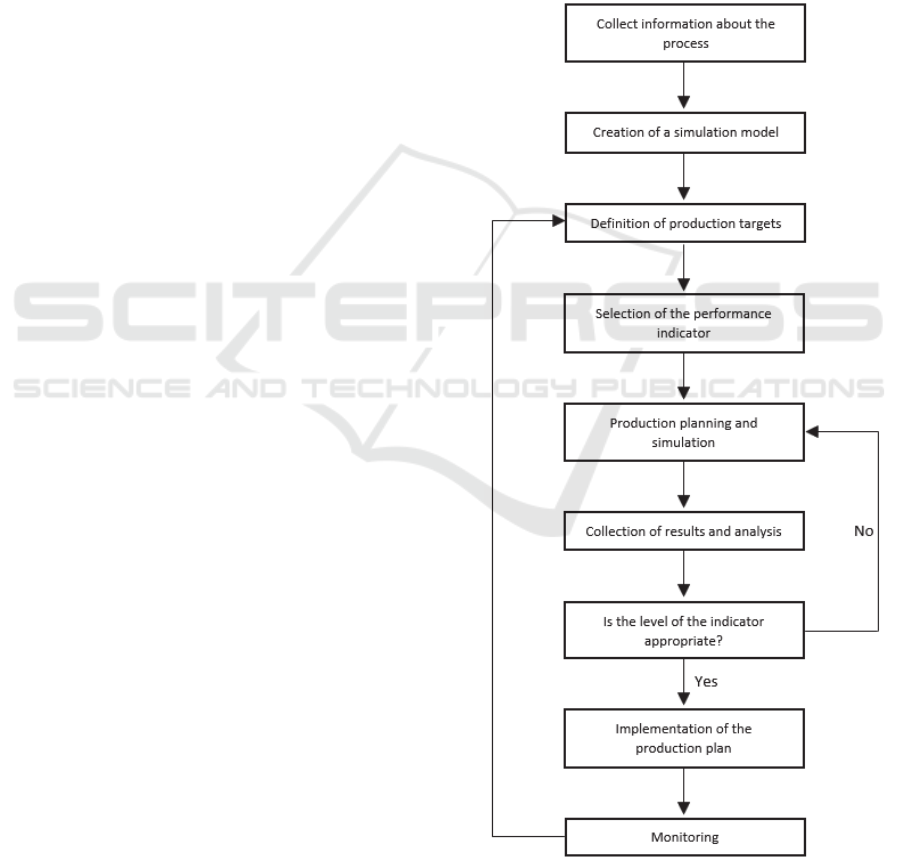
On the basis of studies on the creation of
simulation models and the determination of key
performance indicators, the author's own
methodology for the determination of KPIs with
using simulation models has been developed
(Figure 3).
The proposed methodology consists of nine steps.
The first stage is to collect information about the
process that is needed to create a simulation model -
its course, number of workstations, connections
between them and machine parameters.
The second stage is to create a virtual model of the
production process. This is one of the most important
stages, because errors in the project implementation
will cause incorrect results in the KPIs determination.
It is very important to develop a model at the
appropriate level of detail of the simulated model.
Many model designers, supported by powerful
simulation tools, tend to model everything regardless
of the project goals.
In the third stage, production targets are
formulated, to which the results of simulation variants
will refer.
The fourth step is to select a key performance
indicator that will be analysed. It should be noted that
it is possible to determine the selected indicator in a
created virtual production environment. If some
parameters are missing in the model, it becomes
impossible to determine which indicators use the
selected data (e.g. cost or energy consumption).
In the fifth stage, the results are collected and
analysed, which leads to the sixth stage - determining
whether the level of the chosen indicator is
satisfactory. If so, we move on to stage seven. If the
measurement of the indicator in the planned
production plan is too low, you should go back to
stage five and correct the production assumptions.
Stages seven and eight are the implementation of
the selected production plan and continuous
monitoring of performance, which may lead to further
production targets.
Figure 3: Proposal of methodology for the determination of
KPIs with using simulation models.
Determination of ISO 22400 Key Performance Indicators using Simulation Models: The Concept and Methodology
95
Simulation of performance indicators is part of the
original methodology for the facility layout design
methodology, which will consist of two sections: a part
supporting the design of a new layout of workstations
and a part focused on the reconstruction of the existing
layout of workstations. Regardless of the approach to
the problem with the production systems, the
measurement of production efficiency is a key element
of the manufacturing systems (Kikolski, Ko, 2018).
4 CASE STUDY
Knowledge of phenomena and processes is the goal of
many research programmes. Different methods are
used for this purpose, ranging from practical actions
involving observation to theoretical analyses, often
with the use of a mathematical apparatus. Nowadays,
computer simulation is a very important and effective
research method. Computer simulations are also
indicated as the most frequently chosen tools for
analysing the possibilities of process optimization in
production engineering (Kikolski, 2017). Building a
simulation model of a production process is a multi-
stage task. Modeling consists of creating a virtual
production process, which enables simulation and
collecting statistics. Statistics make it possible to
prepare reports and compare selected settings of
workstation parameters. Computer models can be
freely improved and subsequent simulations can be
performed for various variants and settings provided
by the user (Kikolski, 2016).
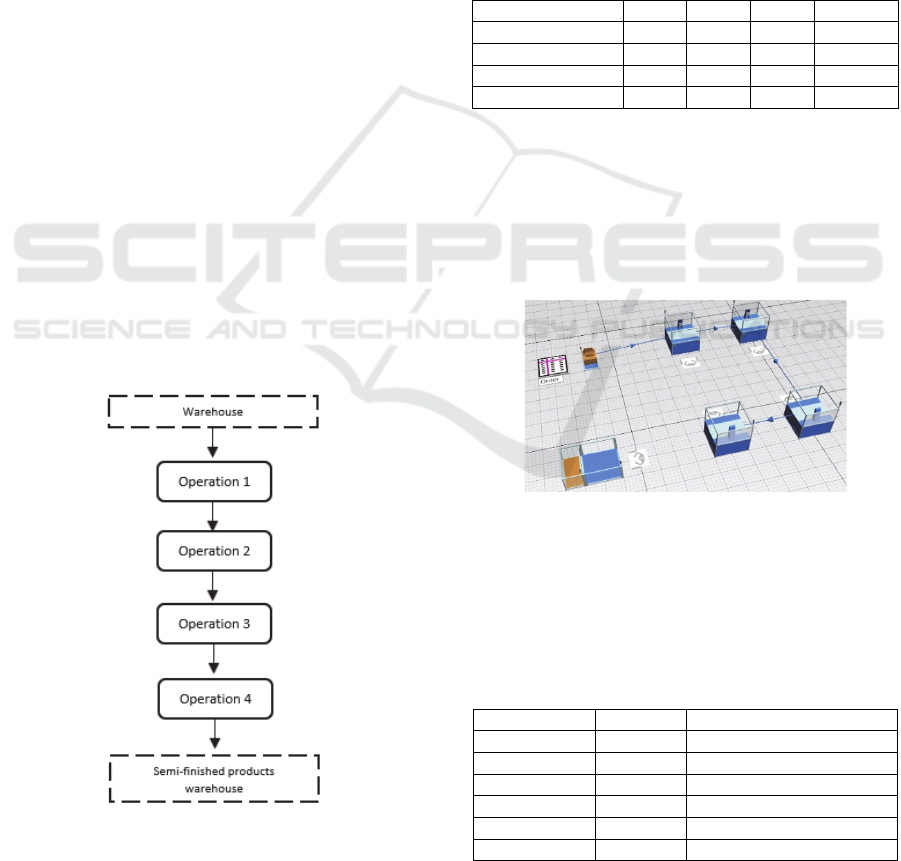
Figure 4: Schematic diagram of a analysed production
process.
The analysis of indicators refers to the production
of one of the components of the electrical installation
box. The production of a component consists of four
activities, after which it is transferred to the semi-
finished products warehouse. The diagram of the
process is shown in Figure 4.
The study was conducted on three different
product variants (A, B and C) in a specific number of
orders (11 pieces A, 4 pieces B and 7 pieces C), and
the analysis covered part of one shift - 3 hours and 15
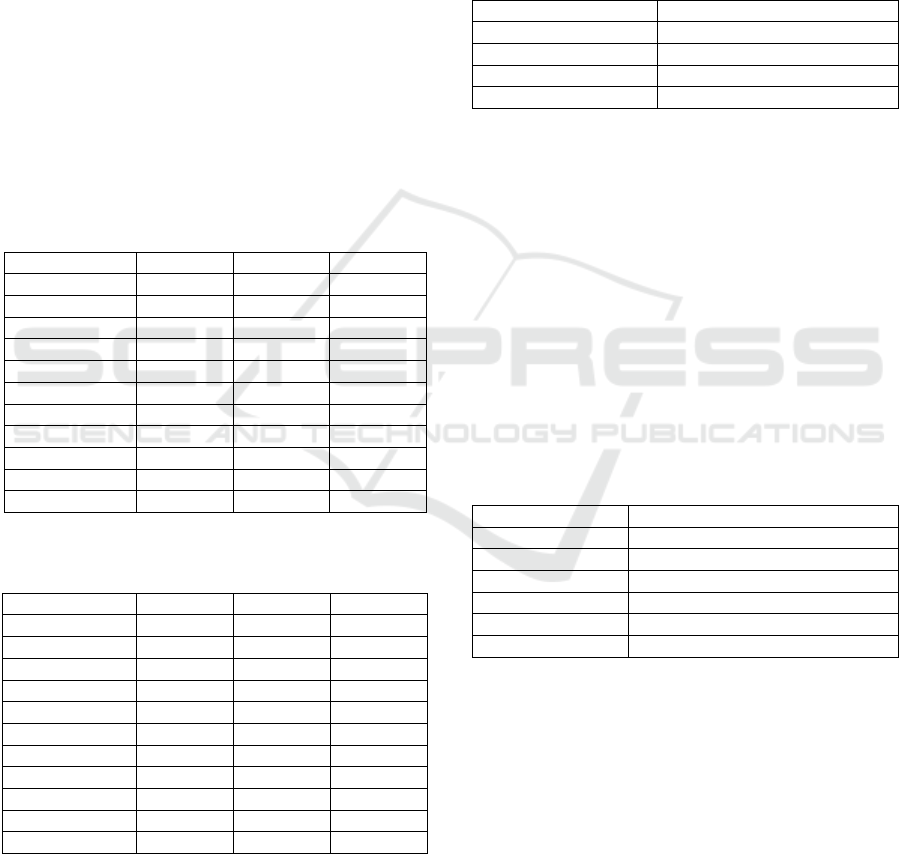
minutes. Table 2 presents unit processing times of
elements at all workstations and the set-up times
between orders. The process is handled by two
workers.
Table 2: Times of material processing.
A B C Set-up
O
p
eration 1 0:04 0:06 0:07 0:00
O
p
eration 2 0:20 0:24 0:20 6:00
O
p
eration 3 0:49 0:52 0:45 2:50
Operation 4 0:45 0:45 0:55 9:48
Source: own study.
The research was carried out using the Siemens
product - Tecnomatix Plant Simulation, which is one
of the tools available on the market for creating
simulation models. It combines technological fields,
production engineering and logistics. A simulation
model is shown in Figure 5.
Figure 5: Simulation model of the analysed process.
The simulation resulted in six different variants of
the production plan. The number of semi-finished
products produced in individual experiments is
presented in Table 3. The results of detailed indicators
are presented in subsequent points of the study.
Table 3: Times of material processing.
Sequence Semi-finished products
Simulation 1 ABC 34
Simulation 2 ACB 35
Simulation 3 BAC 37
Simulation 4 BCA 33
Simulation 5 CAB 40
Simulation 6 CBA 33
Source: own study.
MODELSWARD 2020 - 8th International Conference on Model-Driven Engineering and Software Development
96
The highest production efficiency (40 units) was
achieved in the fifth production plan (CAB
sequence), while the lowest production value (33
units) was achieved in scenarios 4 and 6 (BCA and
CBA).
Simulation studies were conducted for selected
indicators in each of the four groups: production,
maintenance, inventory and quality. The choice of
indicators consisted in identifying one indicator from
each group and testing it.
4.1 Production KPI - Worker
Efficiency
The analysed process is handled by two employees -
one responsible for material processing (operations 1-
3) and one responsible for the finishing of semi-
finished products (operation 4) and their transport to
the warehouse. The results of their performance are
presented in Table 4 and Table 5.
Table 4: Statistics on the workload of worker 1.
Sim 1 Sim 2 Sim 3
Working 25,20% 31,41% 29,06%
Setting-up 31,03% 25,34% 30,61%
Trans
p
ortin
g
0% 0% 0%
En-route to
j
ob 3,72% 3,76% 3,89%
Waiting 40,06% 39,49% 36,44%
Sim 4 Sim 5 Sim 6
Working 33,42% 29,96% 26,26%
Settin
g
-u
p
29% 30,90% 30,82%
Trans
p
ortin
g
0% 0% 0%
En-route to
j
ob 3,72% 4,19% 3,72%
Waiting 33,86% 34,95% 39,21%
Source: own study.
Table 5: Statistics on the workload of worker 2.
Sim 1 Sim 2 Sim 3
Workin
g
14,46% 15,02% 14,83%
Setting-up 28,92% 28,92% 28,92%
Transporting 1,16% 1,20% 1,26%
En-route to
j
ob 1,21% 1,24% 1,31%
Waitin
g
54,25% 53,63% 53,68%
Sim 4 Sim 5 Sim 6
Working 17,68 17,37% 13,89%
Setting-up 27,46 28,92% 30,92%
Transporting 1,13 1,37% 1,13%
En-route to
j
ob 1,21 1,41% 1,21%
Waitin
g
52,53% 50,94% 52,86%
Source: own study.
The simulation shows that worker 1 achieves the
best work performance in the simulation scenarios 4
and 5. Worker 2 achieves the best percentage of work
in the fifth scenario.
4.2 Maintenance KPI - Mean Time to
Repair
Parameters of the tested model concerning
Maintenance indicators do not allow for their random
generation - they were defined in the project
assumptions and are generated in a fixed form during
the simulation. The MTTR indicators are shown in
Table 6.
Table 6: Mean time to repair times in simulated model.
MTTR
(
in minutes
)
Operation 1 0:30
Operation 2 6:10
O
p
eration 3 1:10
O
p
eration 4 12:00
Source: own study.
Simulation software allows to determine the
constants or resulting from selected distributions (e.g.
Gamma) mean times to repair.
4.3 Inventory KPI - Inventory Turns
Inventory turns is specified as the ratio of the
throughput (TH) to average inventory. It is commonly
used to measure the efficiency of inventory, and
represents the average number of times the inventory
stock is replenished or turned over (ISO 22400-
2:2014). Inventory turns results are presented in
Table 7. Average inventory in this study is 39,3.
Table 7: First pass yield ratio.
Inventory turns
Simulation 1 0,865
Simulation 2 0,891
Simulation 3 0,941
Simulation 4 0,839
Simulation 5 1,018
Simulation 6 0,839
Source: own study.
The highest inventory turns indicator has been
achieved in Scenarios 3 and 5.
4.4 Quality KPI - First Pass Yield
First pass yield is a mathematical formula used to
measure quality and efficiency in production. It
shows in particular how many elements go through
the production process without any problems. The
indicator is presented in Table 8.
Determination of ISO 22400 Key Performance Indicators using Simulation Models: The Concept and Methodology
97
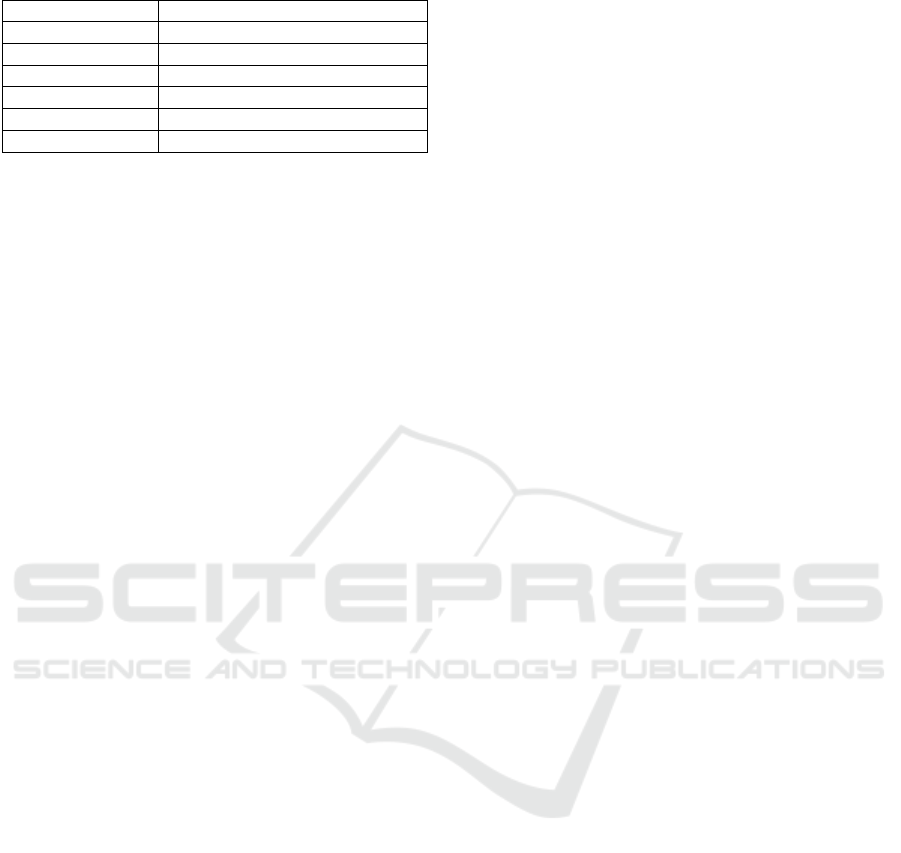
Table 8: First pass yield indicator ratio.
First
p
ass
y
iel
d
Simulation 1 89,5%
Simulation 2 89,7%
Simulation 3 92,5%
Simulation 4 86,8%
Simulation 5 93%
Simulation 6 89,2%
Source: own study.
In simulation 1 an FPY of 89,5%, for example,
tells that 89,5% of items are moving through the
system without any issues. 10,5% percent of items are
scraps or reworks, which can be a time and cost
burden on final production. The higher the FPY, the
more efficient your production processes. In this
study, the highest percentage of FPY can be observed
in the simulation 5 (CAB sequence) – 93%.
5 CONCLUSIONS
The article presents a proprietary methodology for
determining the level of key performance indicators
using simulation models.
The wide availability of simulation tools and
powerful computers creates appropriate conditions
for the extensive use of simulation methods in
industry. Simulation models are used to reduce the
risk of failure when introducing significant changes
to the existing generation systems. After the model is
generated, a simulation analysis is carried out to
determine the individual components of the process.
Siemens Plant Simulation software was used to
develop the models.
In order to obtain correct analysis results, it is
necessary to define the basic properties of the system
correctly. The collected information was used to build
virtual manufacturing processes and determine their
basic tasks. Simulation models were developed in
accordance with the adopted assumptions concerning,
among others, the size of production batches,
simulation times and performance of individual
operations, as well as the availability of workstations.
Out of several production scenarios, the highest
efficiency in all measurements was shown by the fifth
scenario with the CAB sequence.
The methodology will be still tested and possibly
extended in the course of further research. The next
field of research will be testing methodology in pull
production systems (Pull System).
ACKNOWLEDGEMENTS
The research was funded by Project PROM -
International scholarship exchange of PhD candidates
and academic staff" is financed from the European
Social Fund under the Operational Programme
Knowledge Education Development, non-
competitive project entitled International scholarship
exchange for PhD candidates and academic staff,
contract number POWR.03.03.00-00-PN13/18.
REFERENCES
Antczak, A., Gębczyńska, A., 2016. Production process
efficiency analysis with use of key performance
indicators (kpi) on the example of XYZ company.
Scientific Papers. Organizacja i Zarządzanie
/Politychnika Śląska, (92), 9-20.
Halicka, K., 2016. Innovative Classification of Methods of
The Future-Oriented Technology Analysis.
Technological and Economic Development of
Economy, 22(4), 574-597.
IEC 62264, 2002. Enterprise-control System Integration,
Part 1. Models and Terminology, Part 2: Model Object
Attributes.
ISO 22400-1:2014, 2014, Automation systems and
integration — Key Performance Indicators (KPIs) for
manufacturing operations management; Part 1:
Overview, concepts, and terminology. International
Organization for Standardization.
ISO 22400-2:2014, 2014. Automation systems and
integration – Key performance indicators (KPIs) for
manufacturing operations management – Part 2:
Definitions and descriptions of KPIs. International
Organization for Standardization.
Kibira, D., Brundage, M. P., Feng, S., Morris, K. C., 2018.
Procedure for selecting key performance indicators for
sustainable manufacturing. Journal of Manufacturing
Science and Engineering, 140(1), 011005.
Kikolski, M., 2016. Identification of production bottlenecks
with the use of Plant Simulation software. Ekonomia i
Zarzadzanie, 8(4), 103-112.
Kikolski, M., 2019. Sample measurement of the ISO 22400
standard key performance indicators with the use of
simulation models. In 2019 IEEE Technology &
Engineering Management Conference (TEMSCON)
(pp. 1-5). IEEE.
Kikolski, M., 2017. Study of production scenarios with the
use of simulation models. Procedia Engineering, 182,
321-328.
Kikolski, M., Ko, C. H., 2018. Facility layout design–
review of current research directions. Engineering
Management in Production and Services, 10(3), 70-79.
Law, A. M., 2008. How to build valid and credible
simulation models. Proceedings of the 40th Conference
on Winter Simulation, 39-47.
MODELSWARD 2020 - 8th International Conference on Model-Driven Engineering and Software Development
98

Rakar, A., Zorzut, S., Jovan, V., 2004. Assessment of
production performance by means of KPI. Proceedings
of the Control, 6-9.
Rydzewska-Włodarczyk, M., Sobieraj, M., 2015.
Measuring process efficiency with key performance
indicators. Scientific Papers of the University of
Szczecin, 864, 333-347.].
Usman, M., 2018. An Implementation of KPI-ML to a
Multi-Robot Line Simulator (Master's thesis).
Zwierzyński, P., Ahmad, H., 2018. Seru production as an
alternative to a traditional assembly line. Engineering
Management in Production and Services, 10(3), pp. 62-
69.
Determination of ISO 22400 Key Performance Indicators using Simulation Models: The Concept and Methodology
99
