
Research of Motion Artefacts in Eye Blood Filling Diagnostics by
Photoplethysmographic Methods
Y. S. Kadochkin
1
, P. V. Luzhnov
1a
and E. N. Iomdina
2
1
Bauman Moscow State Technical University, 5, 2-nd Baumanskaya St., Moscow, Russian Federation
2
Hemlholtz National Medical Research Center of Eye Diseases, 14/19, Sadovaya-Chernogryazskaya St.,
Moscow, Russian Federation
Keywords: Photoplethysmography, Blood Filling, Motion Artefacts, Eye.
Abstract: The analysis of the blood filling process is necessary to study the physiological characteristics of the blood
circulation of the eye in normal and pathological conditions. In this paper, we studied the possibility of
constructing a photoplethysmographic (PPG) diagnostic channel for assessing the hemodynamic
characteristics of an eye and an eyelid. The main objective of this paper is to study the possibility of using
PPG together with other diagnostic channels, as well as the study of motion artefacts when the PPG sensor is
installed on the upper eyelid. The research group consisted of 6 volunteers without ophthalmologic disease.
The red and infrared emission ranges for the PPG sensor were selected. Registration of PPG signals consisted
of the following: PPG measurement in red and infrared light in the presence of artefacts in the horizontal
plane, in the resting state, in the presence of artefacts in the vertical plane. It is shown that the infrared PPG
channel has a greater signal-to-noise ratio (SNR) for both vertical and horizontal motion artefacts of the eye.
As a result of this work, studies have shown that the infrared PPG signal is less affected by eye motion
artefacts than red PPG. Moreover, the recorded signals in the conditions of vertical eyes movements have a
lower SNR than in the conditions of horizontal eyes movements. The method of video PPG has shown better
value of SNR by the diagnostics in the eyelid.
1 INTRODUCTION
The analysis of the blood filling process in the eye is
necessary to compare diagnostic data obtained by
various methods. Ultrasound methods, laser Doppler
flowmetry, optical coherence tomography
angiography and others methods are used in ocular
blood flow research (Kurysheva, 2017). As a rule,
these methods do not allow to make a general
estimation of a blood flow status in eye vessels,
investigating blood circulation in the each vessel
separately. To quantify blood flow the transpalpebral
rheoophthalmography (TP ROG) method is used
(Luzhnov, 2015; Luzhnov, 2017). TP ROG allows to
investigate an eye hemodynamic in physiological
conditions. With TP ROG it is possible to test the
state of hemodynamics in the ciliary body, and,
integrally, in the anterior segment of the eye
(Luzhnov, 2017; Lazarenko, 1999) in case of myopia,
diabetic retinopathy, glaucoma and other
ophthalmologic diseases. Blood flow in the eyelid
a
https://orcid.org/0000-0003-1111-7063
renders the major factor on the measurements
accuracy for TP ROG (Shamaev, 2017; Shamaev,
2018). The TP ROG method, supplemented by an
analysis of the blood flow in the upper eyelid,
provides more accurate diagnostic data. The addition
of TP ROG data with photoplethysmography method
(PPG) in the eyelid is of great diagnostic significance.
It is necessary to notice that with the help TP ROG
and PPG research techniques it is possible to size up
blood supply on different depth that will allow to
estimate the blood flow contribution of blood vessels
of a certain rank and a location into ocular vascular
system as a whole. Essential advantages of non-
invasive methods, such as PPG and ROG, are also an
absence of contact with eye surface, small duration of
research (2-5 min), mobility and the low cost price of
the equipment.
The main task of this work was development of
PPG channel design, capable of working together
with TP ROG channel, and also researching of motion
artefacts in PPG channel at its use on an eyelid.
288
Kadochkin, Y., Luzhnov, P. and Iomdina, E.
Research of Motion Artefacts in Eye Blood Filling Diagnostics by Photoplethysmographic Methods.
DOI: 10.5220/0009175302880291
In Proceedings of the 13th International Joint Conference on Biomedical Engineering Systems and Technologies (BIOSTEC 2020) - Volume 1: BIODEVICES, pages 288-291
ISBN: 978-989-758-398-8; ISSN: 2184-4305
Copyright
c
2022 by SCITEPRESS – Science and Technology Publications, Lda. All rights reserved
2 MATERIALS AND METHODS
PPG technology is used in a wide range of medical
devices available for measuring blood oxygen
saturation, measuring blood pressure and cardiac
output, evaluating the autonomic function of the
heart, and detecting peripheral vascular disease
(Tamura, 2014; Allen, 2007; Liu, 2016). To
implement the PPG channel, only a few
optoelectronic components are required: a light
source for illuminating biological tissue and a
photodetector with a recording channel for measuring
intensity changes modulated by pulse waves.
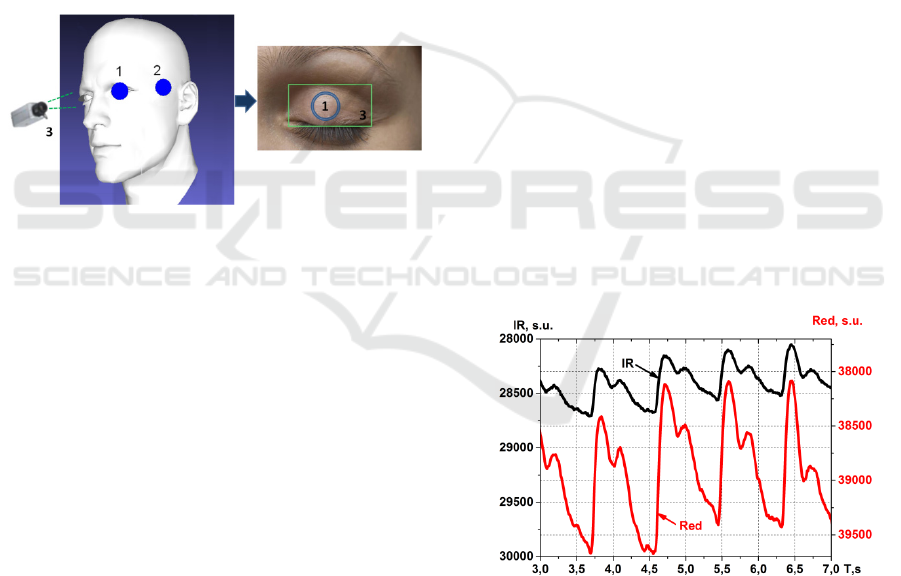
The PPG sensor layout on the patients face is
presented in the Fig.1. There are two possible
locations for ocular blood filling research: for PPG
signal registration from eyelid (1) and for registration
of PPG signal from temporal area (2) are shown.
Figure 1: Two possible locations of the PPG sensor: on the
eyelid (1) and on the temporal area (2), together with video
PPG area (3).
The integrated circuit MAX30100 was chosen as
basic element of PPG sensor. The full-functional
design of the sensory module is incarnated in the
chosen microcircuit for creation of portable
pulsoximetry systems with high demands to accuracy
of measurements. The minimum of additional
external components is required for integration into a
wearable full-function measuring system. Two light-
emitting diodes and the photodiode form a part of this
microcircuit, and also optical elements are built into
it. The electronic circuit of a signal processing
situated in a structure of the sensor is characterised by
low level of own noise. The PPG sensor has two light-
emitting diodes: red and infrared. Light radiated by
light-emitting diodes is close to the monochromatic.
Light radiated by the infrared diode is located in the
wave band with length from 870 nm to 900 nm and
with a peak wave length about 880 nm, and for the
red diode – from 650 nm to 670 nm with a peak wave
about 660 nm.
The measurement was carried out using the
developed model of the PPG sensor. The signals were
recorded with a sampling frequency of 100 Hz. The
currents supplying the LEDs were chosen so that the
amplitudes of the PPG pulse waves of the red and
infrared channels were equal. Studies for all subjects
were carried out at the same temperature of 23°C, in
order to exclude the influence of thermoregulation
mechanisms on the results.
The study group included 6 volunteers who did
not have cardiovascular and ophthalmological
disease. The average age of test persons is 25 years ±
2 years. Before starting the measurements, each
volunteer was informed about the objectives of the
research and was instructed on the measurement
procedure.
The scheme for conducting one registration was
as follows. The test person occupied a sitting position,
after which our PPG sensor was installed in the
position 1 (see the Fig.1). After resting for three
minutes, the registration of the PPG signal began. It
consisted of the following steps:
1) Measurement of PPG in red and infrared light in
the presence of horizontal plane movement artefacts.
2) Measurement of PPG in red and infrared light at
rest.
3) Measurement of PPG in red and infrared light in
the presence of vertical plane movement artefacts.
Each stage lasted 15 seconds and followed one
after another without pauses and stops. A typical view
of signal trends recorded using the developed sensor
is shown in the Fig.2. It is an example of PPG signal
with four seconds duration, recorded at rest, in units
of ADC samples.
Figure 2: The typical trends of the PPG signals from the
closed eyelid at rest.
In our study, motion artifacts were created as
follows. According to the research plan, the subject
changed the view direction with closed eyelids
throughout the entire time of the corresponding
measurement stage. For the case of horizontal
movements, it was a change in the view direction to
the right and left. For the case of vertical movements,
Research of Motion Artefacts in Eye Blood Filling Diagnostics by Photoplethysmographic Methods
289
it was a change in the direction of looking up and
down. At each of these stages (step 1 and step 3), the
test subject made three movements in one second. It
was corresponded to a frequency of motion artifacts
introduced into the recorded signal, equal to 3 Hz.
The frequency of the introduced artifacts was set for
the subjects by the sound signals of a computer
program simulating a metronome. The frequency of 3
Hz was chosen as the largest range of comfortable
movements for the subjects. Moreover, it was higher
than the heart rate (about 1 Hz at 60 beats per minute).
It allowed us to separate the pulse fluctuations in
blood flow and motion artifacts in the subsequent
digital processing of signals using band-pass filters.
The analysis of the received signals can be carried
out both in the time and in the frequency domain. In
the first case, the maximum signal amplitude is
estimated for one period of the pulse blood volume or
for the entire signal recording interval. Then it
becomes possible to compare the changes in the
amplitude of the signal at rest and with motion
artifacts.
For analysis in the frequency domain, it can be
possible to use digital filters to highlight the
frequency ranges of the useful signal (pulse blood
supply) and motion artifacts. Based on the spectral
characteristics of these ranges, the signal-to-noise
ratio (SNR) for each recorded signal can be
calculated.
We used eighth-order band-pass Chebyshev
filters for analysis of registered PPG signals. The first
filter was with a lower cut-off frequency of 0.1 Hz
and an upper cut-off frequency of 2.5 Hz for blood
flow pulsative waves. The second filter was with a
lower cut-off frequency of 2.5 Hz and an upper cut-
off frequency of 3.5 Hz for motion artefacts diapason.
The signal spectrum was obtained in the
MATLAB software environment. From each
obtained signal spectrum, the SNR was calculated.
SNR was calculated as the ratio of the signal for the
pulse wave range to the signal for the range of motion
artefacts. The power in each of the frequency bands
was calculated as the value of the sum of samples in
the interval with boundaries corresponding to the
values of the boundaries of the selected ranges. Then
the analysis and statistical processing of the results
was carried out.
In addition to the PPG method, a contactless video
PPG method was used in our research (Rubins, 2010;
Rubins, 2016). In this case, there is no contact with
both the surface of the eyelid and deeper lying tissues.
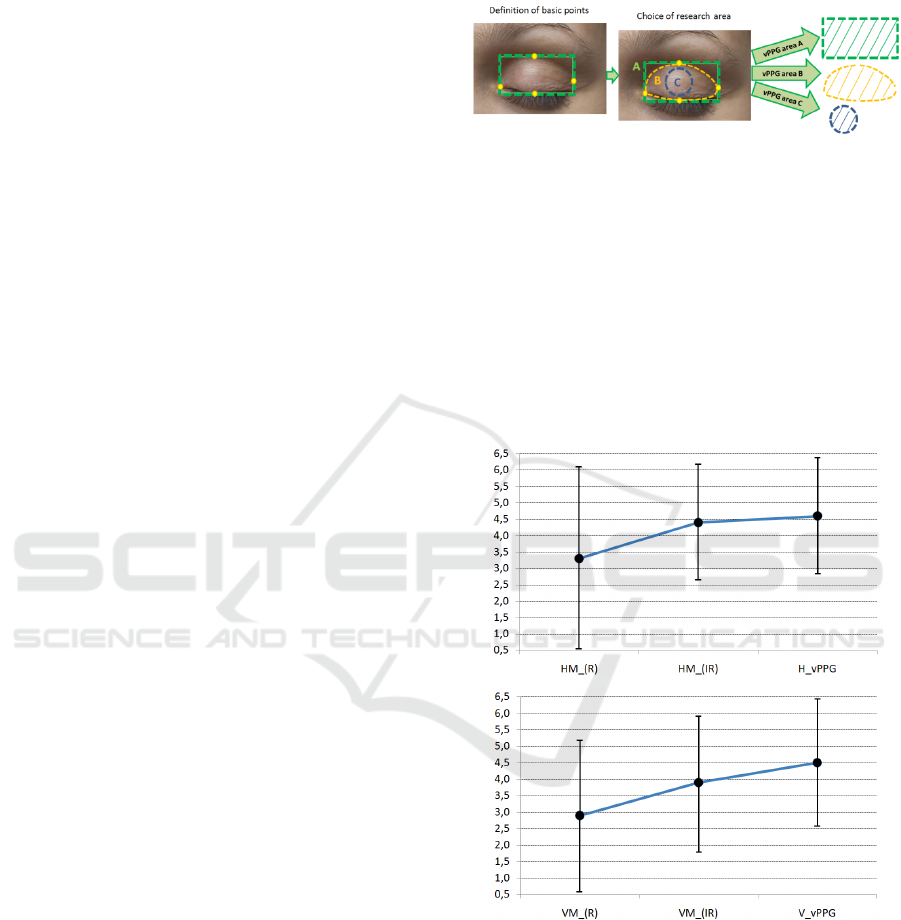
In our research, the rectangular area for analysis on
the image was highlighted along anatomical lines
defining the edges of the upper eyelid. A study area
selection diagram is given in Fig.3.
Figure 3: The study area selection diagram for video PPG
method in the upper eyelid.
In our study, the first area (see Fig.3) was chosen
to calculate the video PPG (vPPG) signal parameters.
3 RESULTS
As result, the following SNR ratios were obtained. To
simplify the visual comparison of the experimental
results, the Fig.4 shows the range of SNR values.
Figure 4: Diagram of the SNR range for the results of
measurements.
The span diagrams with HM_(IR) and HM_(R)
provide the results of SNR ratios for measuring the
PPG signal under horizontal oscillation conditions for
the infrared and red ranges, respectively. Span
diagrams VM_(IR) and VM_(R) - for PPG signals of
infrared and red ranges at vertical oscillation (see
Fig.4). The results of the study showed that the
infrared PPG signal is less affected by motion
BIODEVICES 2020 - 13th International Conference on Biomedical Electronics and Devices
290

artefacts than the red PPG signal. In this case, the
recorded signals in the conditions of eye vertical
oscillations have a lower SNR ratio than for signals
that were recorded under the conditions of eye
horizontal oscillations. This can be explained by a
change in the thickness of the eyelid layers in which
the PPG signal is recorded.
Even higher SNR ratios can be achieved using the
vPPG method. This method demonstrates the spectral
component of the signal, similar to the previous PPG
method. When the signal vPPG is decomposed into
components, it is characterized similarly to the signal
recorded from the eyelid skin surface.
4 CONCLUSIONS
As a result of the studies, it was shown that using the
proposed method, it is possible to carry out a
quantitative assessment of blood flow both in the
eyelid skin and in deeper tissues. This allows
supplementing the non-invasive diagnostic method
with a new research algorithm. In this case, the doctor
receives additional diagnostic information about the
blood flow both in the eyelid and in eye structures. It
also becomes possible to calculate blood flow
parameters in each structure of the study area, which
increases the diagnostic value of such studies.
The conducted researches confirm possibility of
using PPG sensor on the closed eyelid. Authors note
a possibility of simultaneous research TP ROG and
PPG signals for the control of individual eyelid
features and for the rising accuracy of ocular blood
filling determining during transpalpebral diagnostics
in the future.
CONFLICT OF INTEREST
The authors declare that they have no conflict of
interest. The paper was supported by a grant from
RFBR (No.18-08-01192).
REFERENCES
Allen, J., 2007. Photoplethysmography and its application
in clinical physiological measurement. Physiol. Meas.
28(3): R1–R39.
Kurysheva, N.I., Parshunina, O.A., Shatalova, E.O., et al.,
2017. Value of structural and hemodynamic parameters
for the early detection of primary open-angle glaucoma.
Curr. Eye Res. 42(3): 411–417.
Lazarenko, V.I., Kornilovsky, I.M., Ilenkov, S.S. et al.,
1999. Our method of functional rheography of eye.
Vestnik oftalmologii 115(4): 33–37.
Liu, J., Ping-Yen Yan, B., Wen-Xuan Dai, et al., 2016.
Multi-wavelength photoplethysmography method for
skin arterial pulse extraction. Biomedical optic express
7(10): 4326. DOI: 10.1364/BOE.7.004313
Luzhnov, P.V., Shamaev, D.M., Iomdina, E.N. et al., 2015.
Transpalpebral tetrapolar rheoophtalmography in the
assessment of parameters of the eye blood circulatory
system. Vestn Ross Akad Med Nauk 70(3): 372–377.
DOI: 10.15690/vramn.v70i3.1336
Luzhnov, P.V., Shamaev, D.M., Iomdina, E.N., et al., 2017.
Using quantitative parameters of ocular blood filling
with transpalpebral rheoophthalmography. IFMBE
Proceedings 65: 37–40. DOI:10.1007/978-981-10-
5122-7_10
Rubins, U., Erts, R., and Nikiforovs, V., 2010. The blood
perfusion mapping in the human skin by
photoplethysmography imaging. IFMBE Proceedings
29: 304–306.
Rubins, U., Spigulis, J., Miscuks, A., 2016.
Photoplethysmography imaging algorithm for
continuous monitoring of regional anesthesia. Proc. of
14th ACM/IEEE Symposium on Embedded Systems for
Real-Time Multimedia : 67-71.
Shamaev, D. M., Luzhnov, P. V., Iomdina, E. N., 2018.
Mathematical modeling of ocular pulse blood filling in
rheoophthalmography. IFMBE Proceedings 68(1):
495–498. DOI: 10.1007/978-981-10-9035-6_91
Shamaev, D.M., Luzhnov, P.V., Iomdina, E.N., 2017.
Modeling of ocular and eyelid pulse blood filling in
diagnosing using transpalpebral rheoophthalmography.
IFMBE Proceedings 65: 1000–1003. DOI:10.1007/9
78-981-10-5122-7_250
Tamura, T., Maeda, Y., Sekine, M., and Yoshida, M., 2014.
Wearable photoplethysmographic sensors – past and
present. Electronics 3(2): 282–302.
Research of Motion Artefacts in Eye Blood Filling Diagnostics by Photoplethysmographic Methods
291
