
Automatic Segmentation of Necrosis Zones after Radiofrequency
Ablation of Spinal Metastases
Johannes Steffen
1,†
, Georg Hille
1,†
, Mathias Becker
2
, Sylvia Saalfeld
1
and Klaus T
¨
onnies
1
1
Department of Simulation and Graphics, University of Magdeburg, Germany
2
Department of Neuroradiology, University Hospital of Magdeburg, Germany
†
both authors contributed equally to this manuscript
Keywords:
Medical Image Segmentation, Deep Learning, Radiofrequency Ablation, MRI.
Abstract:
In this work, we propose an automatic deep learning-based approach to segment necrotizing tissue (necrosis
zones) after radiofrequency ablations (RFA) of spinal metastases in follow-up Magnetic Resonance (MR)
images. While the manual segmentation of those necrosis zones is challenging and time consuming, it is
a crucial step to assess, whether a preceding therapy using RFA was successful and to what extent, i.e., to
quantitatively evaluate how much of the metastasis was necrotized throughout the therapy. Therefore, we
trained a U-Net like deep neural network on 26 clinical cases (and various augmentations of those), where
each case had an associated contrast enhanced T
1
-weighted as well as a T
2
-weighted MR sequence. We
evaluated the proposed approach on both sequences separately as well as in a combined setting and report
Dice coefficients, sensitivity-, and specificity rates for the automatic segmentations. A Dice coefficient of up
to 77.2 % indicates promising segmentation quality, if compared to related work and similar segmentation
tasks. To the best of our knowledge, this is the first work to tackle the problem of automatic segmentation
of necrosis zones in MR images and therefore lacks comparability with related works. However, our best
results are somewhat superior to semi-automatic approaches of liver metastases segmentation, which might be
considered a problem of similar complexity.
1 INTRODUCTION
The life expectancy has increased steadily over the
last decades, resulting in a lifetime gain, which, in ad-
dition to all its benefits, also holds risks. Age-related
diseases like cardiovascular diseases, as well as can-
cer and cancer induced malicious metastases occur
more and more frequently. Due to improved diagnos-
tic procedures and medical treatments, the survival
time of most malicious carcinomata has increased.
This medical success story unfortunately again has
a drawback, as the probability to develop metastases
raises. Bone metastases are the third most likely
and a vast majority are located in the spine (Harring-
ton, 1986; Wong et al., 1990). These spinal metas-
tases can evoke vigorous pain by fractures, bruises,
spinal cord and nerve root compressions or neurologic
deficits and therefore, detrimentally affect the quality
of life (Klimo and Schmidt, 2004). Besides, external-
beam radiation the method of choice are ablative ap-
proaches like radiofrequency ablation (RFA) (Rosen-
thal et al., 1998; Dupuy et al., 2010). The underly-
ing princible is based on tissue heating and necro-
tization by molecular firction due to high frequency
current phase changes at the tip of a minimally inva-
sive inserted applicator. Heat dissipation leads to a
growing necrotized zone around the needle tip, with
the purpose of covering as much of the metastasis as
possible. MR images are taken for both diagnostic
purposes and post-interventional follow-ups, due to
their high soft tissue contrast and spatial resolution as
well as the possibility to utilize contrast agents. To
assess the treatment outcome, i.e. the completeness
of metastasis ablation it is essential to evaluate the
congruence of both the ablation zone and the former
metastasis via distance and volume overlap measures.
Therefore, the segmentation of the necrosis zone is
among others a pivotal step towards an automatised,
quantitative and objective treatment outcome valida-
tion of RFAs of spinal metastases. Besides, such seg-
mentations could yield additional insights for a bet-
ter understanding in tumor reoccurrence and to fur-
ther improve ablation protocols and procedures. Cur-
rently, it is not part of the clinical routine, due to
the very time-consuming manually contouring done
slice-wise, which makes it hardly applicable or suit-
able. Furthermore, some specific aspects of this issue
make this a highly challenging and ambitious task,
e.g. hardly noticeable intensity differences between
necrosis and remaining metastasis, inflammation pro-
96
Steffen, J., Hille, G., Becker, M., Saalfeld, S. and Tönnies, K.
Automatic Segmentation of Necrosis Zones after Radiofrequency Ablation of Spinal Metastases.
DOI: 10.5220/0009174300960102
In Proceedings of the 9th International Conference on Pattern Recognition Applications and Methods (ICPRAM 2020), pages 96-102
ISBN: 978-989-758-397-1; ISSN: 2184-4313
Copyright
c
2022 by SCITEPRESS – Science and Technology Publications, Lda. All rights reserved
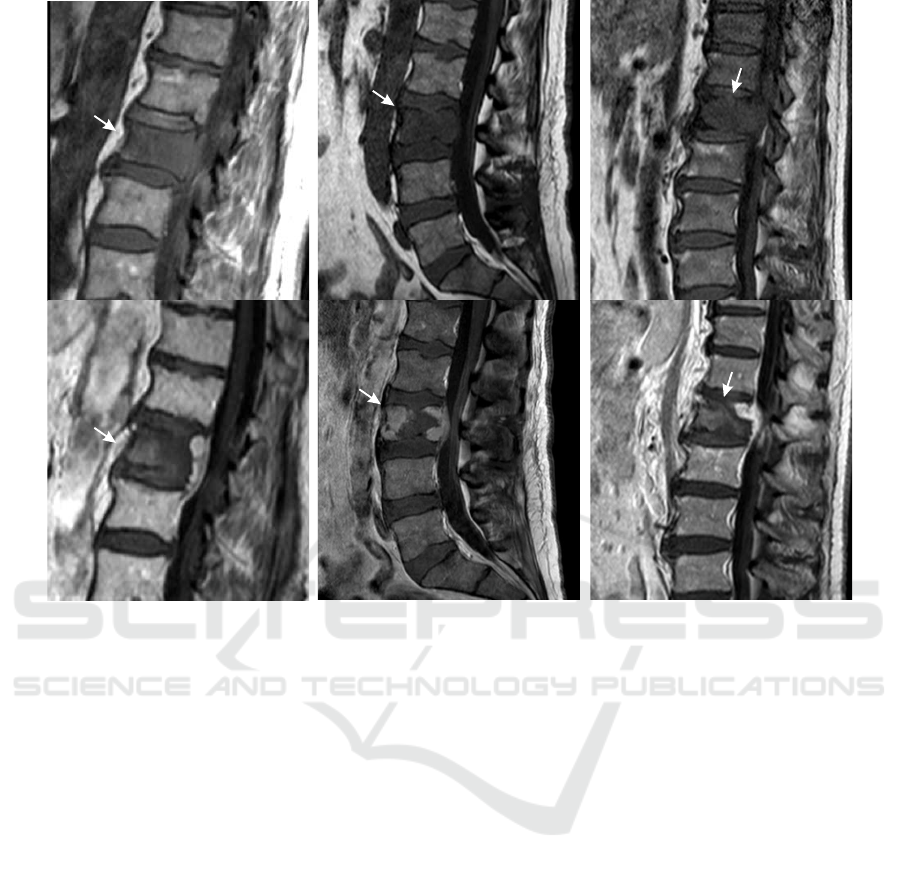
Figure 1: Original T
1
-weighted pre- (upper row) and contrast-enhanced T
1
-weighted post-interventional (lower row) MR
images of exemplary patient cases with spinal metastases and corresponding necrosis zones after RF ablations (arrows).
cesses caused by the coagulation, possible hematoma
as well as a high shape variability. The latter depends
on the former metastasis shape, tissue specific heat
dissipation, and adjacent anatomical structures (see
Fig. 1).
Currently, there are only few works regarding RF ab-
lation zone segmentation. To our best knowledge,
all published research papers focused on liver tumour
treatment in Computed Tomography (CT) imaging,
none of them dealt with spine RFA necrosis zones
or MR imaging. Therefore, the following state-of-
the-art analysis cannot be or only partially transferred
to ablation zone segmentation in spine MR imag-
ing. Passera et al. (Passera et al., 2013) proposed
a live-wire algorithm and Fuzzy C-Mean clustering
to segment ablation zones in post-interventional RFA
CT scans of the liver. The semi-automatic and user-
guided approach was applied as a 2D slice-wise seg-
mentation and took on average approx. 10 min for
a necrosis zone. Similar to the work by Passera et
al., McCreedy et al. (McCreedy et al., 2006) like-
wise presented a 2D live-wire based approach for CT
imaging, embedded in a RFA registration, segmenta-
tion, and fusion tool. They described the segmenta-
tion step merely superficial and did not present any
quantitative results. Weihusen et al. (Weihusen et al.,
2010) proposed a workflow oriented software support
for CT image guided RFA of focal liver malignancies.
As a treatment outcome validation tool, they also in-
cluded a semi-automatic necrosis zone segmentation,
based on a morphological region growing algorithm.
Again, no quantitative results were stated.
Another computer-aided analytic tool was devel-
oped by Bricault et al. (Bricault et al., 2006), which
focused on assessing local recurrences of liver metas-
tases after RFA treatment in CT. For this purpose, a
semi-automatic 3D segmentation approach based on
a watershed algorithm was implemented. On average,
the segmentation took approx. 4 min, but accuracy
results were not stated. A semi-automatic graph-cuts
based approach was proposed by Egger et al. (Egger
et al., 2015) to segment liver tumors in CT imaging.
They achieved accuracies of 77 % Dice on their 12 pa-
tient comprising dataset and had computational times
of only a few seconds. In conclusion, it remains un-
clear, why most of the above mentioned works did not
state any segmentation accuracy results whatsoever,
since the segmentation of the ablation zone is a cru-
cial step towards assessing the efficacy of RFA treat-
ment of metastases and tumours. Furthermore, the
Automatic Segmentation of Necrosis Zones after Radiofrequency Ablation of Spinal Metastases
97
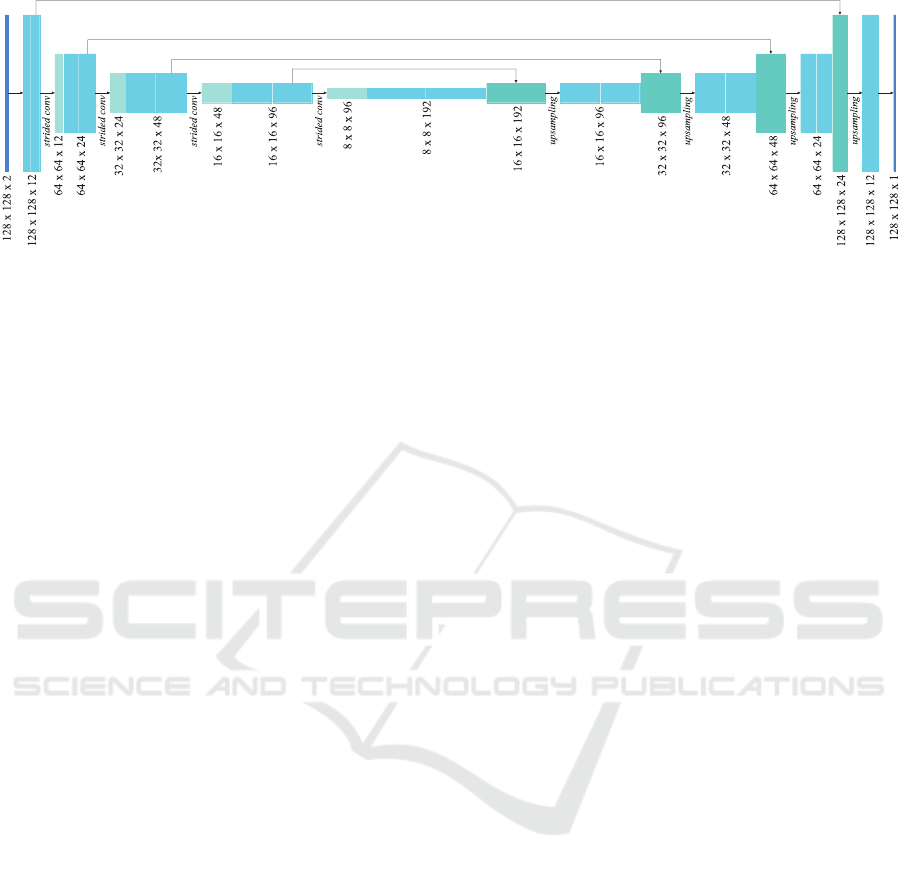
Figure 2: The U-Net structure used for multi-modal 2D image input, with convolutional layers including batch normalisation,
strided convolutions for downsampling and upsampling layers. The architecture for three-dimensional input is analogous to
the one shown above. A significant difference between the two variants is the number of trainable parameters, which is about
2.85 times higher in the 3D case.
previous studies focused only on semi-automatic ap-
proaches for post-interventional CT imaging of liver
tumor ablations. The main objective of this study was
to implement an automatic, deep-learning based seg-
mentation approach for follow-up MR scans of RFAs
of spinal metastases and to assess, which image in-
put w.r.t. dimension and MR sequence for a Convolu-
tional Neural Network (CNN) is most suitable.
2 MATERIALS AND METHOD
2.1 Image Data
We assembled a dataset of 26 follow-up MR images
of patients who underwent radiofrequency ablations
of spinal metastases. These images were acquired be-
tween 1 and 3 days after the intervention including,
among others, sagittal contrast-enhanced T
1
-weighted
and native T
2
-weighted MRI sequences. Both se-
quences were chosen, since they are most commonly
used for visual treatment outcome validation by neu-
roradiologists in this particular case. Due to multi-
ple MR scanners, the specific acquisition parameters,
e.g. magnetic field strength or repetition time, varied
within our dataset. The scan resolution within a slice
ranged between the individual cases from 0.45 mm
to 1.25 mm, the spacing between adjacent slices from
3.3 mm to 4.8 mm. The image volumes of each patient
case were pre-processed by a cubic interpolation be-
tween the original number of slices (between 15 and
25) to a fixed number of 64 to yield almost isotropic
spatial resolution and simplify any following process-
ing steps. An experienced neuroradiologists manu-
ally contoured each necrosis slice-wise, thus, the in-
put data could be applied as individual slices or as
patient-wise volumes to our networks.
2.2 Augmentation
Due to our relatively small amount of available data,
we extensively augmented each of the 26 original
MRI volumes using the following techniques:
• Gaussian Blur: The images were burred with a
Gaussian filter with σ in the range from 0 to 0.5.
• Gamma Transformation: Gamma transformations
with γ in the range from 0.5 to 2 were applied to
modify image intensities.
• Mirroring: Each patient volume was flipped in all
directions. We included vertical flips, i.e. cranio-
caudal, even though it may appear inappropriate,
it had proven to be advantageous for the final re-
sults due to the avoidance of fast overfitting.
• Scaling: The image volumes were scaled with
randomly chosen factors between 0.6 and 1.4.
• Rotation: Rotations were applied to the im-
age volumes in the range of ±30
◦
around the
transversal axis and between ±20
◦
around the
sagittal axis.
• Elastic Deformations: Random displacement
fields with subsequently Gaussian smoothing the
grid with a σ ranging between 0 and 0.3 were
used to elastically deform the image volumes (cf.
(Ronneberger et al., 2015)).
• Translation: Finally, each patient volume was
translated in a random cropping manner within a
range of ±20 voxels in sagittal and vertical direc-
tion w.r.t. the center of the necrosis m
c
and sub-
sequently cropped to patches of the fixed size of
128 × 128 × 64 voxels.
After the augmentation each image volume patch
was whitened by mean subtraction and a subsequent
division by the standard deviation. It was ensured
ICPRAM 2020 - 9th International Conference on Pattern Recognition Applications and Methods
98

that each patch contained at least fractions of necro-
tizised tissue. Since we used stratified 6-fold cross-
validation with 26 patient cases, we used a 21/5 (train-
ing/validation) split for 2 folds and 22/4 for the re-
maining four. Each patient volume within the train-
ing set was augmented 1800 times, yielding in to-
tal 37,800 volumetric respectively 2,419,200 cross-
section training samples for both 21/5-split folds
and 39,600 respectively 2,534,400 for the remaining
folds.
2.3 CNN Architecture
We used minimally modified U-Nets implemented in
Keras and Tensor f low, since the commonly used
U-Net architecture proposed by Ronneberger et al.
(Ronneberger et al., 2015) still represents the state-of-
the-art regarding various medical segmentation tasks
(Isensee et al., 2019) (see Fig. 2). The individual
networks differ in the processing of either 2D or 3D
data and the incorporation of either individual MR se-
quences or multimodal input. Therefore, we applied
2D patches of size 128 × 128 pixels or volumes of
size 128 ×128×64 voxels to our networks with either
one modality channel or two. The convolutional lay-
ers had a kernel size of 3×3 (×3) except the last one,
which applies a 1 × 1 (×1) kernel to reduce the di-
mensionality to the desired output size. A batch nor-
malization followed each convolutional layer. Strided
convolutions (stride of 2) were applied for down-
sampling the image patches. Simplified upsampling
layers replaced the commonly used up-convolutions,
since it have been found to be equally effective, while
being less computationally expensive (Isensee et al.,
2017). The activation funtion of every convolutional
layer was a Rectified Linear Unit (ReLU), except the
last one again, where a sigmoid function resulted in
values between 0 and 1 were. The above mentioned
multimodal image input was incorporated in the most
straightforward way, i.e. each MRI sequence was rep-
resented by an input channel. We decided to use a sin-
gle epoch, while the number of iterations was equal to
the number of available samples, since we did not al-
ter any training specific parameters. Furthermore, we
used Tversky Loss (TL) as proposed by Salehi et al.
(Salehi et al., 2017) as a loss function, which repre-
sents a modified form of the Tversky index (Tversky,
1977) and is defined as
T L(α, β) =
2
N
∑
i=1
(r
0i
p
0i
)
N
∑
i=1
(r
0i
p
0i
) + α
N
∑
i=1
(r
1i
p
0i
) + β
N
∑
i=1
(r
0i
p
1i
)
(1)
where p
0i
is the probability for a voxel i to be labeled
as necrosis zone and p
1i
as background. For a necro-
sis zone voxel r
0i
is 1 and for a background voxel r
0i
is 0, vice verse for r
1i
. α and β balance the penalities
for false positives and false negatives. Adam (Kingma
and Ba, 2014) was applied as an optimizer with a
learning rate of 0.001. Mini-batch size was 2 sam-
ples for volumetric and 32 for slice-wise input data.
Finally, to produce binary output images a threshold
of 0.5 was applied.
2.4 Experimental Design
We performed multiple experiments with variing net-
work configurations, i.e. individual or multimodal
image input as well as 2D and 3D images. The ba-
sic network architecture remained unchanged, in or-
der to largely exclude further influencing factors, e.g.
by varying layer numbers or kernel sizes. Our training
scheme consisted of stratified 6-fold cross-validation
over disjunct subsets of either five or four patients
per validation set. The results stated in the following
represent the average of all 6 cross-validation folds.
Since we did not base any training and design de-
cisions on intermediate validation results (no look-
ahead bias) and due to our limited dataset, we have
decided against a separate test set, as it would result
in too few samples for a promising training.
2.5 Evaluation
Expertly annotated necrosis zone segmentations were
produced using co-registered MR sequences of each
patient within a synchronized viewer. The network
described in Section 2.3 was applied to the image
data. To quantify our results, we used Dice simi-
larity coefficients to measure the percentage of vol-
ume overlap, as well as voxel-wise sensitivity (true
positive rate, TPR) and specificity (true negative rate,
TNR), since some of the related work used both as
quality measurements. The above mentioned are de-
fined as follows:
Dice =
2 |R
1
∩ P
1
|
|R
1
| + |P
1
|
, T PR =
|R
1
∩ P
1
|
|R
1
|
, T NR =
|R
0
∩ P
0
|
|R
0
|
(2)
with R
1
and P
1
as foreground voxels of reference
and prediction and analogously, R
0
and P
0
as the cor-
responding background voxels. However, sensitiv-
ity and specificity are not commonly used to eval-
uate medical image segmentations, since they are
highly sensitive to a segment’s size (Taha and Han-
bury, 2015). The given results were generated exclu-
sively on patient volumes, even if the segmentations
Automatic Segmentation of Necrosis Zones after Radiofrequency Ablation of Spinal Metastases
99

Table 1: Experimental results for each input configuration depending on the used modalities (contrast − enhanced T
1
-, T
2
-
weighted MRI sequences), as well as a slice-wise (2D) or volume (3D) processing.
2D 3D
ceT
1
T
2
[ceT
1
+ T
2
] ceT
1
T
2
[ceT
1
+ T
2
]
Dice [%]
mean 76.7 62.2 77.2 72.7 60.4 75.9
median 83.5 65.9 82.3 78.1 63.3 80.7
std 19.0 21.7 15.6 18.7 27.4 17.2
Sensitivity [%]
mean 81.4 69.2 81.6 77.7 63.1 77.8
median 84.5 76.9 86.4 86.2 71.1 82.6
std 17.1 20.3 15.4 21.5 26.5 19.6
Speci f icity [%]
mean 99.2 98.8 99.2 99.1 98.7 99.2
median 99.6 99.1 99.5 99.4 99.0 99.6
std 0.9 1.0 0.8 0.9 1.3 0.9
with 2D input were predicted slice-wise. Thus, the
2D predictions were merged patient-wise.
3 RESULTS AND DISCUSSION
Table 1 shows the results of our experiments. We
achieved Dice scores up to 77.2 ± 15.6 % and sen-
sitivity rates up to 86.4 ± 15.4 %, depending on the
applied MR sequences and input dimension. In this
study a segmentation approach for necrosis zones in
spine MR images was presented. With regards to clin-
ical applicability, the accuracy, automatization, and
computational time are of primary importance. Man-
ual segmentation procedures are time-consuming and
tedious due to their limitation to slice-by-slice pro-
cessing and require up to 10 min per necrosis zone.
That is one of the reasons, such segmentations are not
currently integrated into the clinical routine. There-
fore, an automatic and fast apporach can overcome
the limitations of manual procedures and play a deci-
sive role in improving treatment outcome validation
and ablation protocols. Our proposed method fulfills
these requirements. Since this is (to our best knowl-
edge) the first study to tackle necrosis zone segmen-
tation in spine MR images, it is difficult to compare
our results with related work. Furthermore, almost
all relevant works regarding necrosis zone segmenta-
tion did not state any quantitative results, except the
work of Egger et al. (Egger et al., 2015). Our best
results were on par with the results of their semi-
automatic approach (77.2 % vs. 77.0 %), but our
method did not require any user-interaction. Due to
the lack of directly related work, it might be interest-
ing to take works of automatic lesion segmentation
as a similar issue into consideration. Chmelik et al.
(Chmelik et al., 2018) adapted a CNN to vertebral
metastases segmentation in CT images. They stated
a voxel-wise sensitivity rate of 74 % for sclerotic and
71 % for lytic lesions as well as a specificity rate of
88 % (sclerotic) and 82 % (lytic). Hille et al. (Hille
et al., 2019) applied a CNN to segment spinal metas-
tases in T
1
- and T
2
-weighted diagnostic MR images
and achieved Dice scores up to 73.8 %. Although,
our results were superior to those of the mentioned
works, it is worth mentioning, that comparability is
only possible to a very limited extent. Besides the
different imaging method used by Chmelik et al., the
segmentation of spinal metastases represents a rather
more ambitious task due to the high appearance vari-
ability depending on metastatic origin and type (lytic,
sclerotic or mixed). Nonetheless, the segmentation of
necrosis zones in spine MR imaging is hampered by
similar difficulties, as there is a variety of anatomical
structures with high image contrasts, similar intensi-
ties, and textures in close proximity. Furthermore, the
necrosis zones are in some cases difficult to distin-
guish from remaining metastases and inflammation
processes or possible hematoma could overlap with
the necrosis zone (see Fig. 4, lower row).
With regards to the applied MR sequence, we
achieved the best results with either the contrast-
enhanced T
1
-weighted data alone or if it was part
of multimodal image input (see Fig. 3). This could
most likely be attributed to the predominantly high
image contrasts between necrosis and surrounding
bone structures, which are additionally enhanced by
the application of contrast agents. Multi-modal in-
put, i.e. combining contrast-enhanced T
1
-weighted
images with T
2
-weighted MR data showed only small
improvements regarding the mean accuracy and a
somewhat reduced standard deviation (see Tab. 1).
Applying solely T
2
-weighted images yielded worse
results, most likely due to the inferior image constrast
ICPRAM 2020 - 9th International Conference on Pattern Recognition Applications and Methods
100
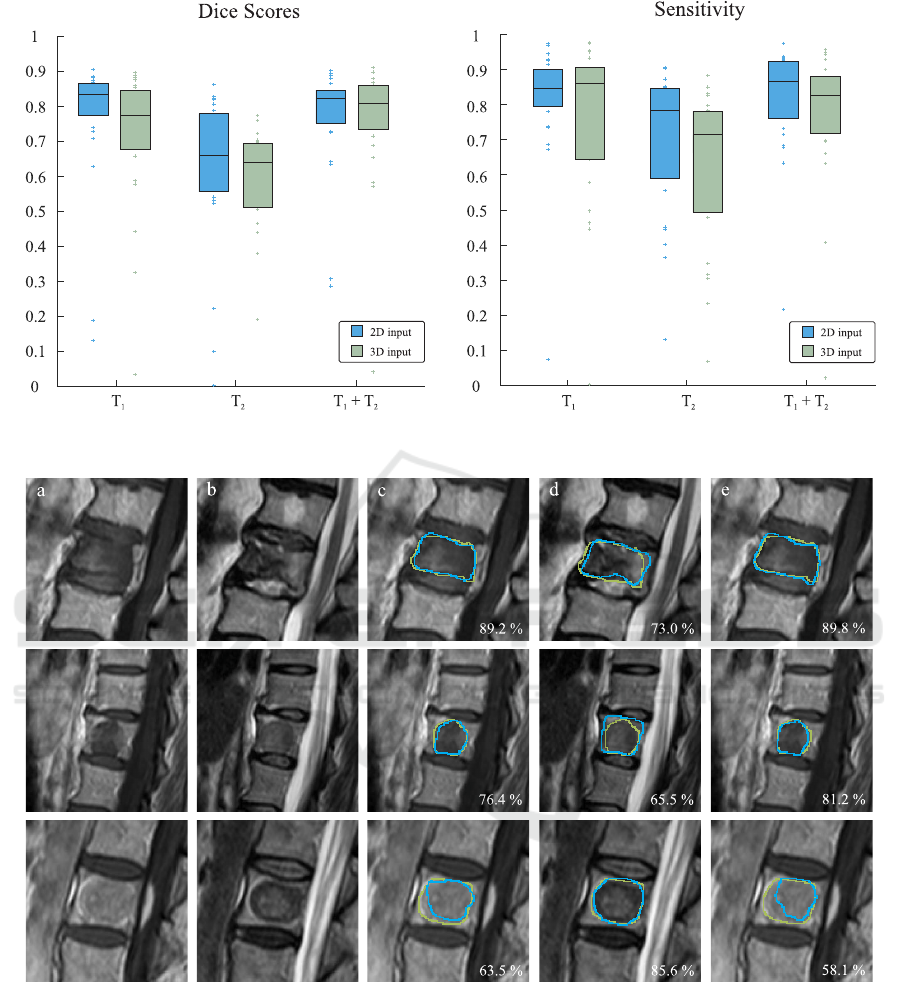
Figure 3: Dice scores and sensitivity rates depending on the imaging modality and input dimension. Box edges mark the 25th
and 75th percentiles, the central box line marks the median value.
Figure 4: Three exemplary patient cases, representing very high (upper row), average (middle row) and unsatisfactory (lower
row) segmentation accuracies produced with 3D image input. Corresponding Dice scores are stated in the lower right corners.
Green contours display the expertly annotated data as ground truth and blue contours represent our automatically produced
segmentations. From left to right: (a) original T
1
-weighted MRI sequence, (b) original T
2
-weighted MRI sequence, (c) result
with only T
1
-weighted image data, (d) result with only T
2
-weighted image data, (e) result with combined T
1
- and T
2
-weighted
image data.
between necrosis and surrounding tissues. Hence,
they rather support and improve robustness in combi-
nation with the contrast-enhanced T
1
-weighted input.
With respect to the input dimension, it was found that
on average 2D image input yielded higher scores than
volumetric image input, which could be attributed to
the higher number of trainable parameters (1,400,000
vs. 4,000,000) to be optimized and therefore, in-
creased network complexity.
Automatic Segmentation of Necrosis Zones after Radiofrequency Ablation of Spinal Metastases
101

4 CONCLUSION
Automatic necrosis zone segmentation in follow-up
MR scans after RF ablations of spinal metastases has
the potential to quantify and objectify the treatment
outcome validation. It provides important informa-
tion regarding the improvement of ablation proce-
dures and it may help understanding and predicting
possible tumor reoccurrence. We proposed a CNN-
based segmentation approach and examined the im-
pact of various input modalities and dimensions on
the segmentation accuracy. Our results were on par
with those of Egger et al. (Egger et al., 2015), which
were the only quantitative results available (77.2.0 %
vs 77 %), altough the latter focused on necrotized
liver lesions in CT imaging. Overall, our study in-
dicates promising results and constitutes a valuale ap-
proach towards this ambitious and challenging issue.
ACKNOWLEDGEMENTS
This work was supported by the German Ministry
of Education and Research (13GW0095A) within the
STIMULATE research campus.
REFERENCES
Bricault, I., Kikinis, R., Morrison, P. R., vansonnenberg, E.,
Tuncali, K., and Silverman, S. G. (2006). Liver metas-
tases: 3d shape–based analysis of ct scans for detec-
tion of local recurrence after radiofrequency ablation.
Radiology, 241(1):243–250.
Chmelik, J., Jakubicek, R., Walek, P., et al. (2018). Deep
convolutional neural network-based segmentation and
classification of difficult to define metastatic spinal le-
sions in 3d ct data. Medical image analysis, 49:76–88.
Dupuy, D. E., Liu, D., Hartfeil, D., et al. (2010). Per-
cutaneous radiofrequency ablation of painful osseous
metastases. Cancer, 116:989–997.
Egger, J., Busse, H., Brandmaier, P., Seider, D., Gawlitza,
M., Strocka, S., Voglreiter, P., Dokter, M., Hofmann,
M., Kainz, B., et al. (2015). Rfa-cut: semi-automatic
segmentation of radiofrequency ablation zones with
and without needles via optimal st-cuts. In 2015 37th
Annual International Conference of the IEEE Engi-
neering in Medicine and Biology Society (EMBC),
pages 2423–2429. IEEE.
Harrington, K. (1986). Metastatic disease of the spine.
JBJS, 68:1110–1115.
Hille, G., D
¨
unnwald, M., Becker, M., Steffen, J., Saalfeld,
S., and T
¨
onnies, K. (2019). Segmentation of vertebral
metastases in mri using an u-net like convolutional
neural network. In Bildverarbeitung f
¨
ur die Medizin
2019, pages 31–36. Springer.
Isensee, F., Kickingereder, P., Bonekamp, D., Bendszus,
M., Wick, W., Schlemmer, H.-P., and Maier-Hein, K.
(2017). Brain tumor segmentation using large recep-
tive field deep convolutional neural networks. In Proc.
of Bildverarbeitung f
¨
ur die Medizin 2017, pages 86–
91. Springer.
Isensee, F., Kickingereder, P., Wick, W., Bendszus, M., and
Maier-Hein, K. H. (2019). No new-net. In Brain-
lesion: Glioma, Multiple Sclerosis, Stroke and Trau-
matic Brain Injuries, pages 234–244. Springer.
Kingma, D. P. and Ba, J. (2014). Adam: A method for
stochastic optimization. arXiv:1412.6980.
Klimo, P. and Schmidt, M. H. (2004). Surgical management
of spinal metastases. The Oncologist, 9:188–196.
McCreedy, E. S., Cheng, R., Hemler, P. F., Viswanathan, A.,
Wood, B. J., and McAuliffe, M. J. (2006). Radio fre-
quency ablation registration, segmentation, and fusion
tool. IEEE Transactions on Information Technology in
Biomedicine, 10(3):490–496.
Passera, K., Selvaggi, S., Scaramuzza, D., Garbagnati, F.,
Vergnaghi, D., and Mainardi, L. (2013). Radiofre-
quency ablation of liver tumors: quantitative assess-
ment of tumor coverage through ct image processing.
BMC Medical Imaging, 13:3.
Ronneberger, O., Fischer, P., and Brox, T. (2015). U-net:
Convolutional networks for biomedical image seg-
mentation. In Proc. of MICCAI 2015, pages 234–241.
Springer.
Rosenthal, D. I., Hornicek, F. J., Wolfe, M. W., et al. (1998).
Percutaneous radiofrequency coagulation of osteoid
osteoma compared with operative treatment. J Bone
Joint Surg Am, 80:815–21.
Salehi, S. S. M., Erdogmus, D., and Gholipour, A. (2017).
Tversky loss function for image segmentation us-
ing 3d fully convolutional deep networks. In Ma-
chine Learning in Medical Imaging, pages 379–387.
Springer.
Taha, A. A. and Hanbury, A. (2015). Metrics for evaluating
3d medical image segmentation: analysis, selection,
and tool. BMC medical imaging, 15(1):29.
Tversky, A. (1977). Features of similarity. Psychological
review, 84(4):327.
Weihusen, A., Hinrichsen, L., Carus, T., Dammer, R.,
Rascher-Friesenhausen, R., Kr
¨
oger, T., Peitgen, H.-
O., and Preusser, T. (2010). Towards a verified
simulation model for radiofrequency ablations. In
International Conference on Information Processing
in Computer-Assisted Interventions, pages 179–189.
Springer.
Wong, D. A., Fornasier, V. L., and MacNab, I. (1990).
Spinal metastases: the obvious, the occult, and the im-
postors. Spine, 15(1):1–4.
ICPRAM 2020 - 9th International Conference on Pattern Recognition Applications and Methods
102
