
Assessment of Computational Cell Model Benefits for Optimization of
Microfluidic Devices
Al
ˇ
zbeta Bohinikov
´
a
1 a
, In
ˆ
es Maia
2,3 b
, Monika Smie
ˇ
skov
´
a
1 c
, Al
ˇ
zbeta Bug
´
a
ˇ
nov
´
a
1 d
,
Ana S. Moita
2 e
, Ivan Cimr
´
ak
1 f
and Rui A. Lima
3,4 g
1
Cell-in-Fluid - Biomedical Modeling and Computation Group, University of Zilina, Slovakia
2
IN+ Center for Innovation, Technology and Policy Research, Instituto Superior T
´
ecnico, Universidade de Lisboa,
Av. Rovisco Pais, 1049-001 Lisboa, Portugal
3
Metrics, Mechanical Engineering Department, University of Minho, Campus de Azur
´
em, 4800-058 Guimar
˜
aes, Portugal
4
CEFT, Faculdade de Engenharia da Universidade do Porto (FEUP), R. Dr. Roberto Frias, 4200-465 Porto, Portugal
Keywords:
Computational Cell Model, Microfluidic Devices, Cell Deformation.
Abstract:
This article describes the overview of the steps required to derive and validate a new model on cell behaviour
in microfluidic devices, from the experimental approach to the computational model. The paper identifies
the challenges of the biological side of the experiments and shows where computational power can be useful.
It also emphasizes the necessity for the collaboration between the experimental and computational research
groups. Computations can offer great insides into the mechanics of cells, however, interesting applications
mainly arise from combining nunerics with experiments. Well calibrated and verified model can be used to
improve the performance of a given microfluidic device by testing various geometries and thus lowering the
number of devices that need to be produced. Choosing several designs of microfluidic devices one tries to
demonstrate the wide range of possible uses of the microfluidic technology and how the computations can
enrich them.
1 INTRODUCTION
There is a rising necessity for interdisciplinary co-
operation in solving problems in microfluidics. Mi-
crofluidic devices have a broad spectrum of use, rang-
ing from devices for sorting cells based on their me-
chanical properties to devices designed to detect spe-
cific cells or even to study mechanical properties of
individual cells (Sajeesh and Sen, 2014). Especially,
the use for clinical purposes can have a great influ-
ence on the early diagnosis of metastatic cancer and
thus can help patients to get personalized treatment
(Zhang and Nagrath, 2013).
There is a variety of microfluidic devices based
a
https://orcid.org/0000-0001-8058-7929
b
https://orcid.org/0000-0001-7986-8934
c
https://orcid.org/0000-0002-3633-1798
d
https://orcid.org/0000-0001-6772-2970
e
https://orcid.org/0000-0001-9801-7617
f
https://orcid.org/0000-0002-0389-7891
g
https://orcid.org/0000-0003-3428-637X
on their intended use. When interested in measuring
the biophysical properties of single cells, most com-
mon are devices with narrow channels and obstacles,
where transition times and deformation coefficients
can be measured.
A microfluidic device consisting of a straight
channel with constriction (150×10×10µm) was used
in (Hou et al., 2009). The study aimed to deter-
mine differences between cancer line cells MCF-
10A (benign breast epithelial cell) and MCF-7 (non-
metastatic tumor breast cell). This work was the in-
spiration behind the production of the microfluidic
channels described in Section 3.3.
Other types of devices, such as ones used in
(Lima et al., 2008) and (Pinho et al., 2013), focused
on global properties of the dense blood suspensions.
There is large number of microfluidic devices being
developed for in vitro cancer diagnosis (Chen et al.,
2012).
The need to improve these devices is ever increas-
ing (Shields IV et al., 2015). This process is costly
and time consuming. Computational models of cells
280
Bohiniková, A., Maia, I., Smiešková, M., Bugá
ˇ
nová, A., Moita, A., Cimrák, I. and Lima, R.
Assessment of Computational Cell Model Benefits for Optimization of Microfluidic Devices.
DOI: 10.5220/0009173202800287
In Proceedings of the 13th International Joint Conference on Biomedical Engineering Systems and Technologies (BIOSTEC 2020) - Volume 1: BIODEVICES, pages 280-287
ISBN: 978-989-758-398-8; ISSN: 2184-4305
Copyright
c
2022 by SCITEPRESS – Science and Technology Publications, Lda. All rights reserved

and their flow in microfluidic devices can help im-
prove their design and save time by lowering the
amount of necessary lab experiments.
To help with this process, we started a collab-
oration between Cell-in-fluid Biomedical Modelling
& Computations Group (CifBMCG), the Laboratory
of Interfacial plus Microscale Phenomena from IN+,
Centre for Innovation, Technology and Policy Re-
search in Instituto Superior T
´
ecnico, Universisadede
de Lisboa and Metrics research center, from Univer-
sity of Minho. Here we present the main goals of the
research project behind this collaboration and some
initial results gathered.
1.1 ESPResSo and PyOIF
Simulation model used for this work is being devel-
oped by our research group at the University of Zilina.
All the computations are run on ESPResSo (Weik
et al., 2019) software with an open source license.
We developed the python module PyOIF
1
that allows
modelling of blood as a fluid with immersed elastic
objects, which represent blood cells. More informa-
tion can be found in (Cimr
´
ak et al., 2014).
There are two main parts of the model, namely the
model of the fluid and the model of the elastic object,
that are coupled by dissipative forces. More details
can be found in (Bu
ˇ
s
´
ık and Cimr
´
ak, 2017).
The fluid is modelled using the lattice-Boltzmann
method. The space, through which the fluid moves
is represented by a lattice of discrete points. With
this method, the points are fixed throughout the whole
simulation. During the simulation, fictitious fluid
particles move and encounter other particles, which
transfer information about their velocity and direc-
tion. Information about the number and speed of the
particles passing through each of the fixed lattices is
stored. In-depth description of this method can be
found in (Cimr
´
ak and Jan
ˇ
cigov
´
a, 2018).
1.2 Computational Model of Elastic Cell
The model of elastic cells is represented by an approx-
imation of the cell membrane surface. Five elastic
moduli are responsible for the elastic behaviour of the
cell. Next section provides a brief overview of these
parameters. More details are presented in (Cimr
´
ak
and Jan
ˇ
cigov
´
a, 2018).
The stretching modulus is responsible for the
rigidity of the cell. Once the cell membrane is
stretched, this modulus reacts and develops resistance
against the stretching force to achieve the original re-
laxed state of the cell. The edges of the triangles can
1
http://cellinfluid.fri.uniza.sk/resources-espresso/
be thought of as springs trying to stay in their original
relaxed length.
The bending parameter aims to maintain the shape
of the object by preservation of the angles. The trian-
gle mesh has a prescribed relaxed state and this mod-
ulus maintains the angles between neighboring trian-
gles.
Local area conservation parameter manages
preservation of individual triangle area. When the cell
deforms by pressing forces and the areas of the trian-
gles change, this parameter is responsible for apply-
ing forces to achieve the original area.
The three parameters described above are related
to local regulation of the cell shape. The follow-
ing two parameters will guarantee the conservation of
global properties such as the global cell surface and
the cell volume.
Global area conservation preserves constant sur-
face of the whole object. If the surface of the cell
is larger than desired, this parameter acts to decrease
this surface. On the opposite, if it is smaller, this pa-
rameter increases it. There is a control system for
the surface of the cell. When the relative changes are
too large (larger than 3%), the simulation stops with a
warning.
The global volume conservation parameter is sim-
ilar to the global area conservation parameter, but in-
stead of surface, it is responsible for global volume.
It maintains constant volume of the cell during the
simulation. Similarly as for the global area conser-
vation parameter, there is control system which stops
the simulation with a warning in case the cell volume
becomes larger than 3%.
The model of RBCs was calibrated using the
stretching experiment (Dao et al., 2003), where silica
beads were attached to the cell and afterwards the cell
was stretched with different forces and the change in
cells radial and axial size was measured. The model
was also validated with experimental data of RBC de-
forming in a flow (Koval
ˇ
c
´
ıkov
´
a, 2019).
When setting up simulations of real biological ex-
periments, the most important is to set the parame-
ters as closely as possible to the experimental environ-
ment. Apart from channel geometry and visco-elastic
properties of the fluid, which are set based on the ex-
periments, and elastic parameters of the cell that are
set based on the calibration, one must also consider
the flow of the fluid in the channel. This informa-
tion is quite challenging to obtain from the biological
experiments, especially in narrow channels, such as
the ones used in 3.3. This is because at low volumet-
ric rate, the suspension might not even pass trough
and at higher rates the flow may become too fast to
be captured for instance by an high-speed camera (it
Assessment of Computational Cell Model Benefits for Optimization of Microfluidic Devices
281

can be out of the range of camera capture capacities).
Running simulation with the volumetric flow rate of
was 2.5µL/s resulted in higher velocities than those
measured from the biological experiment. Thus we
established the simulation flow by comparing the cell
velocities.
2 BIOLOGICAL EXPERIMENTS
The biological experiments for this work were carried
out and recorded at Metrics research center in Univer-
sity of Minho, in cooperation with the Laboratory of
Interfacial plus Microscale Phenomena from IN+, in
University of Lisbon. Different types of microfluidic
channels were tested to present various typical cases
addressed in microfluidic technology. The details on
the properties and origins of cells used for these ex-
periments are outlined in Section 2.2.
2.1 Experimental Setup
The flow of the working fluid was analyzed with a
system constituted by an inverted microscope (IX71,
Olympus) and a high-speed camera (FASTCAM SA3,
Photron). The microfluidic devices were placed on
the stage of the inverted microscope and a syringe
pump (CetoniNEMESYS Syringe Pump) was used to
produce a constant flow rate.
Figure 1: Experimental setup.
2.2 Biological Material
The working fluid used in the experiments was a sus-
pension of human red blood cells (RBCs) in dex-
tran 40 (Dx40) with a hematocrit (Hedct) of 0.2
%. In brief, blood from healthy individuals was
obtained from Instituto Portugu
ˆ
es do Sangue e da
Transplantac¸
˜
ao (IPST). The RBCs were separated
from bulk blood by centrifugation (1500 rpm for 15
min) and then the plasma was removed by aspira-
tion. The RBCs were then washed with a physiolog-
ical saline solution and the process was repeated two
more times. Lastly, the RBCs were diluted with Dx40
to make up the required concentration.
2.3 Microfluidic Devices
In this study, four different types of channels are ad-
dressed. Spiral sorter chip and Pillar chip were ob-
tained from microfluidic ChipShop. The other two
chips were produced in Metrics research centre in the
University of Minho. The production process of the
latter two is described in Section 2.3.1. For each type
of microchannel, the potential use and how can the
computational model be used are outlined.
2.3.1 Production of Microfluidic Devices
The microchannels used in this work were produced
by a soft lithographic technique. Firstly, to fabricate
the master moulds, the geometries were drawn in Au-
toCAD to produce a high-resolution photomask. The
mould was then fabricated on a silicon wafer with an
ultrathick photoresist (SU-8 50; Kayaku MicroChem,
Japan). The polydimethylsiloxane (PDMS) prepoly-
mer was prepared by mixing a commercial prepoly-
mer and a curing agent (Silpot 184; Dow Corning,
USA) at a 10:1 weight ratio. The mixture was de-
gassed under vacuum and the PDMS was poured into
the SU-8 photo-resist master mould and cured in an
oven for about 2 h at 70
◦
C. After both master and
PDMS were cooled to room temperature, the PDMS
was peeled from the master. The input and output
ports are made using micro-pipette tips. Lastly, the
PDMS was washed with ethanol and spin-coated over
a clean glass slide. The microchannels were manu-
factured considering three different heights, namely
31µm, 25µm and 12µm. The geometry of the mi-
crochannel with the tallest height is presented in Fig-
ure 5.
3 MICROFLUIDIC DEVICES
DESIGNS AND POTENTIAL OF
COMPUTATIONAL CELL
MODEL
3.1 Spiral Sorter
One of the short term goals of the CifBMCG is to de-
sign and construct geometry for special spiral chan-
nels utilizing inertial effects for cell sorting. Such a
BIODEVICES 2020 - 13th International Conference on Biomedical Electronics and Devices
282

device can be used for ultra-fast cancer cells filtering
without labelling from blood (Warkiani et al., 2014).
The technique utilizes the natural Dean vortex
flows present in the continual flow inside curvilinear
microchannels along with inertial lifting forces that
concentrate larger cancer cells against the inner wall.
By using spirals and circular cross-section, unlike the
traditional rectangular cross-section, the position of
the Dean’s vortex core can be altered to achieve sepa-
ration. Smaller hematologic components are trapped
in Dean’s vortices slanted toward the outer walls of
the duct and finally removed at the outer outlet, while
larger cancer cells accumulate at the inner wall of the
channel and collect from the inner outlet.
The plan is to start with a single spiral micro-
channel with one input and two outputs. This arrange-
ment could successfully isolate two types of cells with
different mechanical properties. Simulations can be
used to suggest how to position the outputs in order to
achieve better purity in the filtering process. Running
biological experiments with healthy and sick RBCs
pushed trough the different channels in the microflu-
idic device in Figure 2 can be used to validate the
model in this novel geometry. Afterwards, the simu-
lations can be used to design improved devices which
then can be produced and tested. Next step could be
to use this device to sort cancer cells from the blood.
Figure 2: Spiral sorter chip.
3.2 Pillar Channels
There are many biological studies focusing on the
flows in different geometries that can be characterized
by the common property of having arrays of periodic
pillars.
Cell-in-fluid research group already carried out
simulation studies of channels inspired by such bi-
ological experiments (Nagrath et al., 2007), (Huang
et al., 2004), (Inglis et al., 2006), (Gleghorn et al.,
2010). However, the simulation results could only
be compared with data collected from the literature,
which did not include all the required information to
fully validate the numerical model.
Our previous studies concerned the trajectories
and rotation of the cells (Bachrat
´
y et al., 2017),
(Slav
´
ık et al., 2017) and (Koval
ˇ
c
´
ıkov
´
a et al., 2018).
Since computational power is somewhat limited, only
part of the microfluidic devices was simulated, with
periodic borders. This means that one can only ob-
tain local information on the behaviour of the cells
and then extrapolate conclusions for the overall be-
haviour. This was studied in (Chovanec et al., 2019).
In order to further develop our research in this area
a microfluidic chip with several channels with differ-
ent pillar geometries was now chosen (see Figure 3).
The flow in one of the channels of this microfluidic
chip was recorded using the high-speed camera (as
aforementioned), from which data can be obtained in
post-processing processes, according to the following
three steps process.
• Video Processing - Currently, there are various
software packages available that can be used for
tracking cell trajectories and obtaining informa-
tion about the cell deformations, such as ImageJ.
However, using these is either a manual or semi-
manual process. There are also limitations con-
cerning the shape of trajectories, as ImageJ can
only track straight trajectories, for example. One
of the goals is to automatize this step. First steps
towards achieving this goal have already been
taken, see (Kaj
´
anek and Cimr
´
ak, 2019).
• Simulations - We will simulate part of the device,
that can be seen on the recordings from the ex-
periment, see Figure 5. Comparing the cell trajec-
tories from simulations with the trajectories of ac-
tual cells will serve as validation of the model. Af-
terwards, it is possible to perform a computational
study with different geometries from the chip and
then carrying out reverse comparison where we
should confirm that the cell behaviour predicted
by our model is similar to that of the real cells.
With this double verification, we can further study
other possible geometries and further optimize the
model, for example, to achieve higher collision
rates with the pillars or introduce other types of
cells.
• Statistical Analysis - Using machine learning
techniques, specifically convolutional neural net-
works, we aim to predict cell behaviour within
large microfluidic devices. Simulations of whole
microfluidic devices require excess computational
power, which is limited. To overcome this, we
plan to use both the information obtained from
videos of biological experiments and data from
simulations in order to compare the results of
our techniques, building on the work started in
(Chovanec et al., 2019).
Assessment of Computational Cell Model Benefits for Optimization of Microfluidic Devices
283
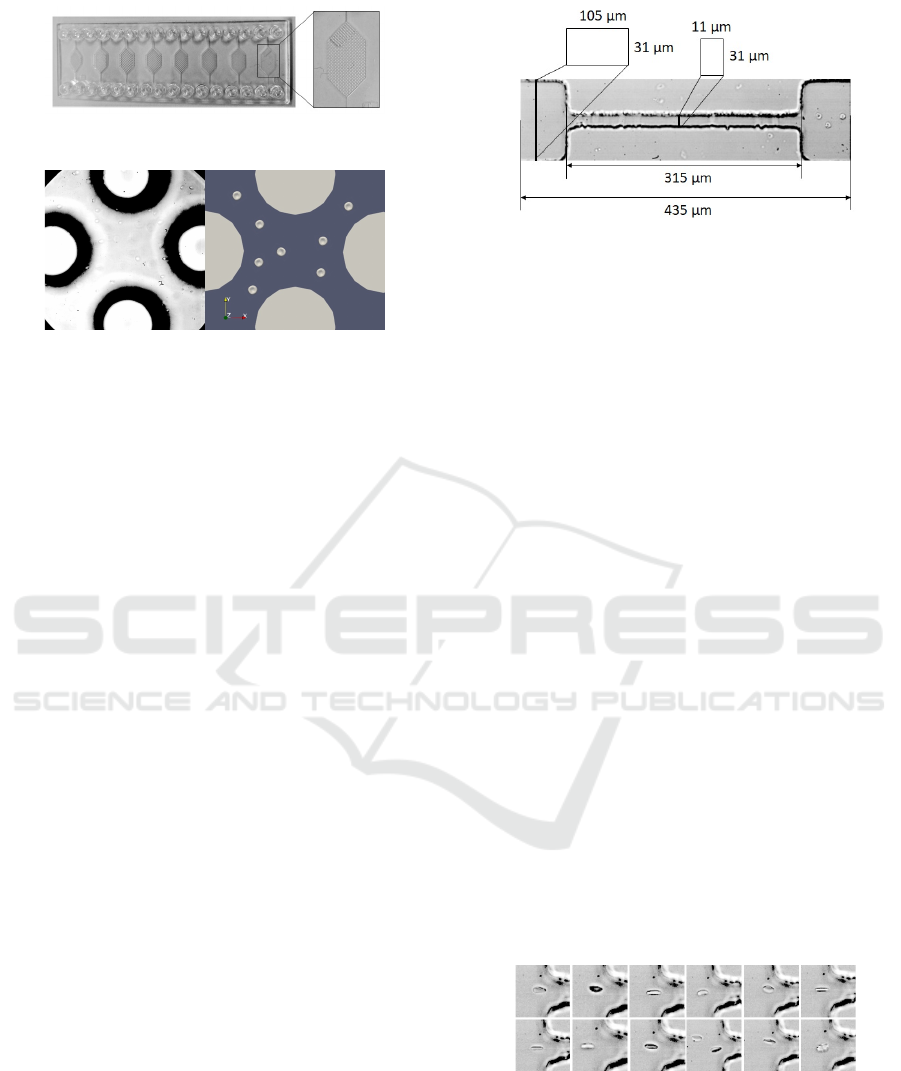
Figure 3: Pillar chip.
Figure 4: Capture from the video recording of the experi-
ment on the left side. Example of cell seeding in simulation
with the pillar geometry on the right.
3.3 Channels with Constriction
With these types of channels, the objective is to study
the deformation of individual cells. As a starting
point, we looked at the deformation of a healthy RBC.
Further experiments will be carried out, once there are
other types of cells available. Particular emphasis is
expected to be given to studies on the deformation of
cells with a nucleus. This could be then used to study
the flow of rare cells, such as the circulating tumour
cells, in the microfluidic devices and optimize their
geometry to achieve the desired properties.
Production of these devices is described in Section
2.3.1. The Metrics research centre in the University of
Minho already produced similar geometries in (Boas
et al., 2018). The objective now is to go smaller and
achieve the flow of cells in one layer which should
allow for a better focus of the video recordings.
Several videos were captured, however, there were
some challenges with the volumetric flow rate, as
mentioned in Section 2.1. We analyzed one of these
videos where the volumetric flow rate on the pump
was set to 2.5 µL/s. Once the simulations finish we
plan to compare the numerical and experimental re-
sults by looking at the time required for the cell to
pass through the channel and at the deformation in-
dex (DI). Figures 7 and 8 depict the partial results
gathered so far.
Furthermore, several sections were selected from
the channel and will be used to qualitatively compare
the shape of the cell deformation obtained from the
experiments and the numerical results.
Figure 5: Dimensions of the channel with constriction.
3.3.1 Data Processing
As aforementioned the quantitative data was extracted
from video recordings of the experiments, using Im-
ageJ (Schneider et al., 2012). For each cell, defor-
mation index, velocity, constriction time and average
velocity in constriction were measured. To obtain the
DI a boxing rectangle was created for each frame. DI
was computed as |x − y|/(x +y), where x is the width
and y is the length of the rectangle. There are other
options to determine the DI, but this was chosen due
to simplicity in terms of how easy it is to compare the
experimental data with the numerical results in this
case.
3.3.2 Comparison between Numerical and
Experimental Results
Due to the difficulties with the reliability of the volu-
metric flow rate, as already discussed in Section 2.1,
the flow velocity was evaluated instead and used to set
up the fluid flow in the simulation. The parameter of
fluid force density was set to 0.0003.
The position of the biological cells was analyzed
when entering the narrow part of the channel. From
16 cells detected in the video, 12 passed through the
whole length. 5 cells entered in the middle and 6 from
the top. Upon entering, most of the cells were rotated
vertically in the flow direction, see Figure 6.
Figure 6: All 12 cells at the entrance of the constriction.
Figure 7 depicts the difference between the cell
deformation when the cell is starting centred (the grey
cell) in the middle and when the cell is moved 5µm
to the left (the red cell). The simulation is still run-
ning and our results go up to one-third of the con-
striction. So we show the difference at the entrance
BIODEVICES 2020 - 13th International Conference on Biomedical Electronics and Devices
284
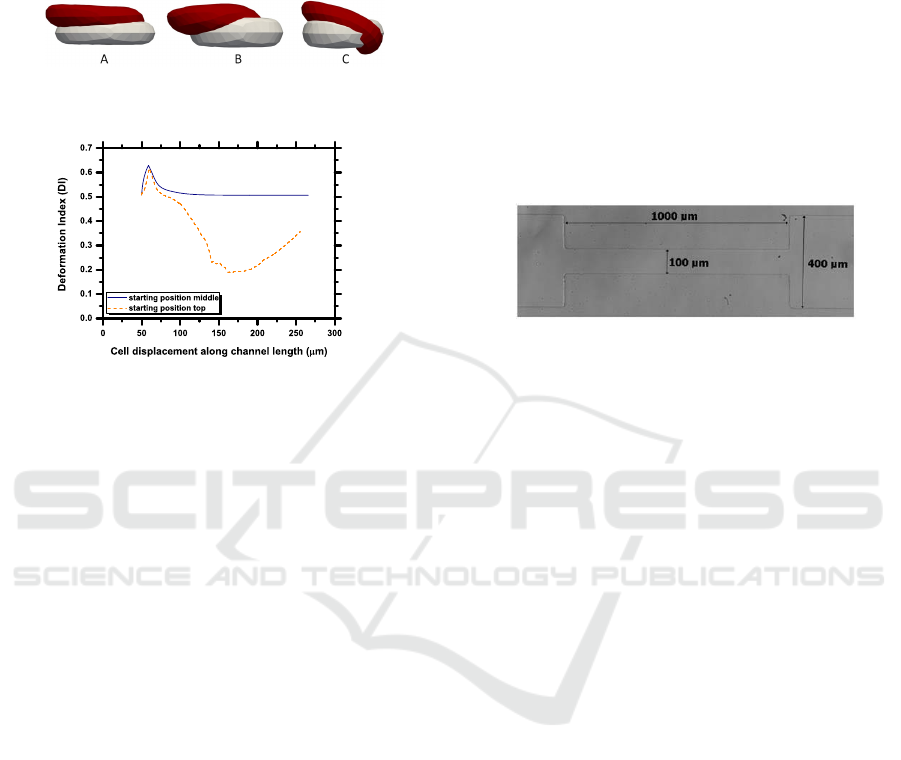
(Figure 7 A), then 20 µm (Figure 7 B) into the con-
striction and then in the middle (Figure 7 C). The dif-
ference in the DI changes, depending on the starting
point is depicted in Figure 8.
Figure 7: Deformation of cells with different starting posi-
tions.
Figure 8: DI of cells with different starting positions.
At the moment limited information could be ob-
tained from the simulations. To save time, the cells
with 10µm in size were positioned before the constric-
tion. We can compare the DI at the beginning of the
constriction (at position 66 µm from the beginning of
the channel). The average DI of biological cells is
0.65, while for the cell from the simulation, it is 0.58.
The difference can be explained by the fact that the
DI from simulation comes from one cell position at a
certain place and the experimental value is obtained
as an average of several cells.
3.4 Channels for Observing CFL
The cell-free layer (CFL) is a hemodynamic phe-
nomenon that contributes to the rheological proper-
ties of blood flowing in microvessels. Due to the
high shear stresses developed around the wall and the
parabolic velocity profile, deformable RBCs in nar-
rower vessels tend to migrate toward the centre of the
vessel. This results in the formation of two phases,
the central cell concentrated phase and the cell-free
liquid phase. To the contrary, white blood cells and
platelets that are more rigid than RBCs, as well as
more infected RBCs, are localized closer to CFL.
Several factors, such as cell deformability, hema-
tocrit, blood flow rate and vascular geometry, affect
the thickness of the resulting CFL. The computational
study performed in (Smie
ˇ
skov
´
a and Bachrat
´
a, 2019),
simulated blood flow in a straight channel with dif-
ferent hematocrit values ranging from 5 to 15% with
cells of different stiffness. When examining the im-
pact of the geometry, it is possible to use the mi-
crochannels with narrower parts. Section 3.4.1 dis-
cusses several challenges we encountered with these
in-silico experiments.
New microfluidic chips are now being produced
at Metrics in the University of Minho, with different
geometries. Our goal is to gather data from these de-
vices at different levels of flow and hematocrits and
access more detailed information in order to improve
our model for these types of more dense flows. For
now, we obtained data from channel design shown in
Figure 9.
Figure 9: Dimensions of channels for observing CFL. The
height of the channel is 30µm.
3.4.1 Simulating Dense Blood Suspensions -
Challenges
Simulations of real biological experiments require the
use of large-scale computations. It is necessary to
choose the degree of simulation complexity based
on biological phenomena. One way to simplify the
model is to reduce the discretization of the cell mem-
brane. This has a more pronounced effect at higher
hematocrits.
The advantage of PyOIF is the possibility to sim-
ulate periodic properties of the flow in all three di-
rections. Application of periodic boundary condi-
tions is advantageous for microchannels with a peri-
odic obstacle field (Bu
ˇ
s
´
ık et al., 2016) or direct mi-
crochannels without obstacles (Qi and Shaqfeh, 2017;
Smie
ˇ
skov
´
a and Bachrat
´
a, 2019).
A different situation occurs in the case of chan-
nels with complex segmented geometry. In (Pinho
et al., 2013), a continuous microfluidic device for par-
tial red blood cell (RBC) extraction and subsequent
measurement of RBC deformability was presented.
First part of this device, a constriction with different
heights (25%, 50% and 75% of the channel height)
was placed and the effect of the constriction on the
CFL thickness and the effectiveness of the subsequent
separation were examined.
Simulating this part of the microfluidic device
with the original dimensions (2500×100×51 / 300×
25(50,75) × 51 / 100 × 100 × 51) and with a hemat-
ocrit of about 9% would represent a seeding of 12900
to 13700 cells. A possible solution to this type of
Assessment of Computational Cell Model Benefits for Optimization of Microfluidic Devices
285
problem is to divide the entire simulated channel into
two consecutive simulations. The first simulation box
would have a cuboid shape and would represent a
straight part of the channel before the constriction.
When the steady-state CFL thickness is reached, the
actual cell positions and forces acting on all compu-
tational nodes would be stored. This data would be
an input to the second simulation box containing the
constriction, providing an approximation of the hy-
drodynamic properties. The open question remains,
i.e. the effect of such an approximation on the results,
as well as the reduction of computational power or
efficiency of such an approach.
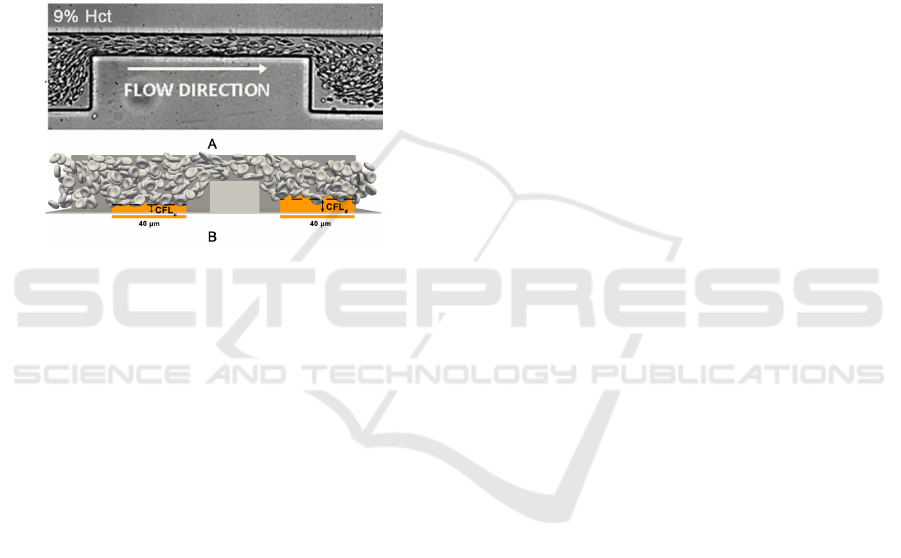
Figure 10: Comparison of the screenshot (A) from a biolog-
ical experiment (Pinho et al., 2013) and (B) a computational
model to investigate the effect of CFL enhancement after in-
sertion of the contraction region into a direct microchannel.
4 CONCLUSIONS
The work presented here addresses a strategy com-
bining an experimental and a numerical approach
to develop microfluidic devices focusing diagnos-
tics based on cell deformation and fluid flow be-
haviour. Microfluidic devices can get blocked with ei-
ther cells, micro-particles or even some material from
the microfluidic channel itself. Saving the data from
recorded video takes time, and it is not certain to ob-
tain the desired data at proper conditions. Experimen-
tal data is therefore of paramount importance to de-
vise and validate a numerical model, but all the afore-
mentioned issues limit the number of experiments that
can be performed. Here is where computational tools
can provide help. Before even starting an experiment
there is a possibility to run several experimental set
up scenarios and based on the analyses of those, it is
easier to establish the plan of experiments to perform.
An important part of the development of the compu-
tational model is the calibration and verification of its
functionality. This process is required for different
types of cells used in the biological experiments, such
as cell RBC, various types of CTC and many others.
For these purposes more simple designs of microflu-
idic channels can be used as proposed in our paper. It
is important to know all the essential parameters of a
given biological experiment. When conducting fluid
flow simulations, it is essential to know the flow in-
formation (Slav
´
ık et al., 2017), fluid density and vis-
cosity, channel shape and size.
This work presents several types of microfluidic
devices and gives a brief overview of most of the steps
necessary to gather data from biological experiments
and how to set up simulations using the open-source
software Espresso with extension PyOIF. The main
focus is towards the development of new microfluidic
devices allowing the study of cell deformation and
deepen the knowledge on this topic, for future use in
alternative diagnostics. Partial results of a simulation
are shown and compared with experimental data ob-
tained for the channels with narrow constriction. This
procedure shows the usefulness of the calibrated RBC
model for healthy RBC. Finally, we outline the possi-
ble applications of the simulation tool for optimizing
designs of some of these devices.
ACKNOWLEDGEMENTS
This work was supported by the Slovak Research
and Development Agency (contract number APVV-
15-0751) and by the Ministry of Education, Science,
Research and Sport of the Slovak Republic (contract
No. VEGA 1/0643/17). Authors are also grateful
to Fundac¸
˜
ao para a Ci
ˆ
encia e Tecnologia (FCT) for
partially financing the research under the framework
of project UTAP-EXPL/CTE/0064/2017 and project
n
o
030171 financed by LISBOA-01-0145-FEDER-
030171 / PTDC/EME-SIS/30171/2017 which also
provided a fellowship. Finally authors also grate-
ful to FCT for the IF 2015 recruitment program (IF
00810-2015) and exploratory project associated with
this contract.
REFERENCES
Bachrat
´
y, H., Koval
ˇ
c
´
ıkov
´
a, K., Bachrat
´
a, K., and Slav
´
ık, M.
(2017). Methods of exploring the red blood cells ro-
tation during the simulations in devices with periodic
topology. In 2017 International Conference on Infor-
mation and Digital Technologies (IDT), pages 36–46.
IEEE.
Boas, L., Faustino, V., Lima, R., Miranda, J., Minas, G.,
Fernandes, C., and Catarino, S. (2018). Assessment
of the deformability and velocity of healthy and ar-
tificially impaired red blood cells in narrow poly-
BIODEVICES 2020 - 13th International Conference on Biomedical Electronics and Devices
286

dimethylsiloxane (pdms) microchannels. Microma-
chines, 9(8):384.
Bu
ˇ
s
´
ık, M. and Cimr
´
ak, I. (2017). The calibration of fluid-
object interaction in immersed boundary method. In
EPJ Web of Conferences, volume 143, page 02013.
EDP Sciences.
Bu
ˇ
s
´
ık, M., Jan
ˇ
cigov
´
a, I., T
´
othov
´
a, R., and Cimr
´
ak, I.
(2016). Simulation study of rare cell trajectories and
capture rate in periodic obstacle arrays. Journal of
Computational Science, 17:370–376.
Chen, J., Li, J., and Sun, Y. (2012). Microfluidic approaches
for cancer cell detection, characterization, and separa-
tion. Lab on a Chip, 12(10):1753–1767.
Chovanec, M., Bachrat
´
y, H., Jasen
ˇ
c
´
akov
´
a, K., and
Bachrat
´
a, K. (2019). Convolutional neural networks
for red blood cell trajectory prediction in simulation
of blood flow. In International Work-Conference on
Bioinformatics and Biomedical Engineering, pages
284–296. Springer.
Cimr
´
ak, I., Gusenbauer, M., and Jan
ˇ
cigov
´
a, I. (2014).
An espresso implementation of elastic objects im-
mersed in a fluid. Computer Physics Communications,
185(3):900–907.
Cimr
´
ak, I. and Jan
ˇ
cigov
´
a, I. (2018). Computational Blood
Cell Mechanics: Road Towards Models and Biomedi-
cal Applications. CRC Press.
Dao, M., Lim, C. T., and Suresh, S. (2003). Mechanics of
the human red blood cell deformed by optical tweez-
ers. Journal of the Mechanics and Physics of Solids,
51(11-12):2259–2280.
Gleghorn, J. P., Pratt, E. D., Denning, D., Liu, H., Bander,
N. H., Tagawa, S. T., Nanus, D. M., Giannakakou,
P. A., and Kirby, B. J. (2010). Capture of circulat-
ing tumor cells from whole blood of prostate cancer
patients using geometrically enhanced differential im-
munocapture (gedi) and a prostate-specific antibody.
Lab on a chip, 10(1):27–29.
Hou, H. W., Li, Q., Lee, G., Kumar, A., Ong, C., and Lim,
C. T. (2009). Deformability study of breast cancer
cells using microfluidics. Biomedical microdevices,
11(3):557–564.
Huang, L. R., Cox, E. C., Austin, R. H., and Sturm,
J. C. (2004). Continuous particle separation
through deterministic lateral displacement. Science,
304(5673):987–990.
Inglis, D. W., Davis, J. A., Austin, R. H., and Sturm,
J. C. (2006). Critical particle size for fractionation
by deterministic lateral displacement. Lab on a Chip,
6(5):655–658.
Kaj
´
anek, F. and Cimr
´
ak, I. (2019). Evaluation of detec-
tion of red blood cells using convolutional neural net-
works. In 2019 International Conference on Informa-
tion and Digital Technologies (IDT), pages 198–202.
IEEE.
Koval
ˇ
c
´
ıkov
´
a, K. (2019). Discretization of simulation
elements–feasibility limits and accuracy of results. In
2019 Proceedings of MIST Conference on Mathemat-
ics in Science and Technologies (2019, In press).
Koval
ˇ
c
´
ıkov
´
a, K., Slav
´
ık, M., Bachrat
´
a, K., Bachrat
´
y, H.,
and Bohinikov
´
a, A. (2018). Volumetric flow rate in
simulations of microfluidic devices. In EPJ Web of
Conferences, volume 180, page 02046. EDP Sciences.
Lima, R., Ishikawa, T., Imai, Y., Takeda, M., Wada, S., and
Yamaguchi, T. (2008). Radial dispersion of red blood
cells in blood flowing through glass capillaries: the
role of hematocrit and geometry. Journal of biome-
chanics, 41(10):2188–2196.
Nagrath, S., Sequist, L. V., Maheswaran, S., Bell, D. W., Ir-
imia, D., Ulkus, L., Smith, M. R., Kwak, E. L., Digu-
marthy, S., Muzikansky, A., et al. (2007). Isolation
of rare circulating tumour cells in cancer patients by
microchip technology. Nature, 450(7173):1235.
Pinho, D., Yaginuma, T., and Lima, R. (2013). A microflu-
idic device for partial cell separation and deformabil-
ity assessment. BioChip Journal, 7(4):367–374.
Qi, Q. M. and Shaqfeh, E. S. (2017). Theory to predict
particle migration and margination in the pressure-
driven channel flow of blood. Physical Review Fluids,
2(9):093102.
Sajeesh, P. and Sen, A. K. (2014). Particle separation and
sorting in microfluidic devices: a review. Microflu-
idics and nanofluidics, 17(1):1–52.
Schneider, C. A., Rasband, W. S., and Eliceiri, K. W.
(2012). Nih image to imagej: 25 years of image anal-
ysis. Nature methods, 9(7):671.
Shields IV, C. W., Reyes, C. D., and L
´
opez, G. P. (2015).
Microfluidic cell sorting: a review of the advances in
the separation of cells from debulking to rare cell iso-
lation. Lab on a Chip, 15(5):1230–1249.
Slav
´
ık, M., Bachrat
´
a, K., Bachrat
´
y, H., and Koval
ˇ
c
´
ıkov
´
a,
K. (2017). The sensitivity of the statistical charac-
teristics to the selected parameters of the simulation
model in the red blood cell flow simulations. In 2017
International Conference on Information and Digital
Technologies (IDT), pages 344–349. IEEE.
Smie
ˇ
skov
´
a, M. and Bachrat
´
a, K. (2019). Validation of bulk
properties of red blood cells in simulations. In 2019
International Conference on Information and Digital
Technologies (IDT), pages 417–423. IEEE.
Warkiani, M. E., Guan, G., Luan, K. B., Lee, W. C., Bhagat,
A. A. S., Chaudhuri, P. K., Tan, D. S.-W., Lim, W. T.,
Lee, S. C., Chen, P. C., et al. (2014). Slanted spiral
microfluidics for the ultra-fast, label-free isolation of
circulating tumor cells. Lab on a Chip, 14(1):128–
137.
Weik, F., Weeber, R., Szuttor, K., Breitsprecher, K.,
de Graaf, J., Kuron, M., Landsgesell, J., Menke, H.,
Sean, D., and Holm, C. (2019). Espresso 4.0 – an
extensible software package for simulating soft mat-
ter systems. The European Physical Journal Special
Topics, 227(14):1789–1816.
Zhang, Z. and Nagrath, S. (2013). Microfluidics and can-
cer: are we there yet? Biomedical microdevices,
15(4):595–609.
Assessment of Computational Cell Model Benefits for Optimization of Microfluidic Devices
287
