
Automatic Classification of Cervical Cell Patches based on
Non-geometric Characteristics
Douglas Wender A. Isidoro
1
, Cl
´
audia M. Carneiro
2
, Mariana T. Resende
2
, F
´
atima N. S. Medeiros
3
,
Daniela M. Ushizima
4
and Andrea G. Campos Bianchi
1
1
Computer Department, Universidade Federal de Ouro Preto, Ouro Preto, Brazil
2
Clinical Analysis Department, Universidade Federal de Ouro Preto, Ouro Preto, Brazil
3
Teleinformatics Engineering Department, Universidade Federal do Cear
´
a, Cear
´
a, Brazil
4
Lawrence Berkeley National Laboratory, Universidade de Berkeley, Calif
´
ornia, U.S.A.
Keywords:
Pattern Recognition, Texture Features, Cervical Cell, Classification, Pap Smear.
Abstract:
This work presents a proposal for an efficient classification of cervical cells based on non-geometric char-
acteristics extracted from nuclear regions of interested. This approach is based on the hypothesis that the
nuclei store much of the information about the lesions in addition to their areas being more visible even with
a high level of celular overlap, a common fact in the Pap smears images. Classification systems were used in
two and three classes for a set of real images of the cervix from a supervised learning method. The results
demonstrate high classification performance and high efficiency for applicability in realistic environments,
both computational and biological.
1 INTRODUCTION
With approximately 530,000 new cases per year
worldwide, cervical cancer is the third most frequent
tumor among the female population, behind breast
and colorectal cancer. It is responsible for 265,000
deaths per year, being the fourth most frequent cause
of cancer death in women (World Health Organiza-
tion, 2018). However, this neoplasm has a slow devel-
opment, which increases the chance of cure when the
precursor lesions are identified early by cytopatholog-
ical examination.
The most eminent screening test for the detection
of cervical cancer in its early stages is Pap smears,
introduced by George Papanicolaou. Its polarization
was due to its low cost and easy access in develop-
ing countries, as well as its great capacity for dif-
ferentiating the types of lesions found, which is ex-
tremely important for the correct diagnosis. Although
this technique is widely used, it presents significant
false negative, false positive and unsatisfactory re-
sults, with causes attributed to different stages of the
process. Therefore, in Brazil, it is recommended that
cytopathology laboratories implement a quality mon-
itoring with the objective of improving the perfor-
mance of the results obtained in this exam.
Based on this objective, new technologies such as
cytology in liquid basis, molecular biology and the
semi-automation of the reading of the cytopathologi-
cal examination have been implemented in the health
market. The benefits of liquid cytology do not jus-
tify its high cost, which makes it inaccessible to large
laboratories, including those that serve the Unified
Health System in Brazil (SUS). Efficient diagnosis
from molecular biology is only really effective when
jointly used in with the cytopathological examination.
Thus, conventional cytology is the technique chosen
to perform the Pap test, not excluding the need for as-
sociation with other strategies to improve the quality
of cervical cancer screening.
The cytopathological interpretation is performed
by qualified specialists and is based on the visual
recognition, in optical microscope, of the alterations
of the nucleus, cytoplasm, and other celular informa-
tion present in the smears. These changes are still as-
sociated with clinical opinions. After the application
of this screening technique, enlarged images contain-
ing the cellular characteristics are obtained by means
of a photocopy of the Pap smears. However, due to
the high complexity of the fields analyzed microscop-
ically and consequently of the images obtained, this
process is configured as slow, exhaustive and error-
prone.
In images containing cells overlap and clusters,
Isidoro, D., Carneiro, C., Resende, M., Medeiros, F., Ushizima, D. and Bianchi, A.
Automatic Classification of Cervical Cell Patches based on Non-geometric Characteristics.
DOI: 10.5220/0009172208450852
In Proceedings of the 15th International Joint Conference on Computer Vision, Imaging and Computer Graphics Theory and Applications (VISIGRAPP 2020) - Volume 5: VISAPP, pages
845-852
ISBN: 978-989-758-402-2; ISSN: 2184-4321
Copyright
c
2022 by SCITEPRESS – Science and Technology Publications, Lda. All rights reserved
845

Figure 1: Isolated (A) and overlapping cells (B) present on
Pap smears. Note that the area of the cytoplasm is clearly
visible in A while in B the exact edges of the cytoplasm
areas are ambiguous.
detection of the cytoplasmic boundary is a difficult
problem as exemplified in Figure 1 and to date there
are no efficient methods capable of performing this
automatically. However, the detection and segmenta-
tion of nuclei in images containing certain degree of
cells overlap and clusters have been successfully ad-
dressed by several studies (Plissiti et al., 2011; Plis-
siti et al., 2011; Sobrevilla et al., 2010). The re-
sults, which mostly use images from the cytopatho-
logical examination of the liquid-based cytology, in-
dicate that the nuclear characteristics may be suffi-
cient to differentiate lesions present in cervical im-
ages. Regarding classification of lesions, some au-
thors also good results with nuclei but using isolated
cells (Lorenzo-Ginori et al., 2013).
Based on the above, it is noted that the measures
adopted to guarantee the quality of the cytological ex-
amination are still insufficient. Therefore, based on
the viability provided by the use of computational
methods to improve this process, it is evident the need
to investigate technological strategies that seek to im-
prove health services in the scenario of screening for
this neoplasm. In this sense, the aim of this work is to
perform the classification of real Pap smears images
by extracting non-geometric features present in cell
nuclei, excluding the use of segmentation techniques
or neural networks. The idea is to generate something
similar to the screening done by the pathologist on
the slides, i.e., to evaluate parts of an image and to
identify regions with lesions without the cellular indi-
vidualization. From this, we intend to investigate the
stiffness necessary for the proposed system to provide
efficient aid for diagnosis in a biological and medici-
nal environment.
This paper is organized as follows, Section 2
presents literature based on cervical cell classifica-
tion. Section 3 details the used methodology describ-
ing all its steps. The results are discussed in Section 4.
The conclusions are exposed in Section 5. And then,
the further works are introduced in Section 6.
2 RELATED WORKS
The literature presents some techniques for the classi-
fication of cervical cellular microscopy images. The
most widely used public image base among them is
Herlev, which contains 917 Pap Smears images and is
provided by the University Hospital of Herlev, Den-
mark (Jantzen et al., 2005). Its data set consists of 7
classes of cervical cytology images with single cell,
being: superficial squamous, squamous intermediate,
columnar, moderate dysplasia, moderate dysplasia,
severe dysplasia and carcinoma in situ. Some works
that are based on this collection of images are men-
tioned below:
Mariarputham and Stephen (2015) presents a cell
classification system, based on texture information
extracted from the nucleus and cytoplasm, using neu-
ral networks and supervised learning methods. It is
emphasized that there is no unique set of characteris-
tics capable of providing efficient diagnostics for any
and all classes of a proposed classification system. In
addition, SVM algorithm is presented as an efficient
solution for classification.
Lakshmi and Krishnaveni (2014) describes a
method for automated extraction of multiple charac-
teristics of nuclei and cytoplasms, using a paramet-
ric probability density function associated with Maxi-
mization Expectation algorithm and clustering. Their
results confirm the efficiency of the proposed system
to differentiate lesions between low grade (LSIL) and
high grade (HSIL).
Singh et al. (2015) proposes a classification tech-
nique using Random Forest. For this, it considers
the texture characteristics of the nucleus and cyto-
plasm, investigates the efficiency of these character-
istics for the recognition of normal and altered cells
and presents metrics to measure the efficiency of the
system.
Walker et al. (1994) despite using his own
database, presents preliminary results for the classifi-
cation of cell nuclei using textural features of the Gray
Level Co-Occurrence Matrix (GLCM) and linear dis-
criminant analysis to reduce the dimensionality of the
characteristics extracted. His studies demonstrate that
the texture characteristics extracted from GLCM pro-
vide efficient means for discriminating normal and al-
tered cervical cells.
All the previously mentioned works use the ex-
traction of texture characteristics associated with the
extraction of geometric characteristics and a pre-
processing that contains cellular segmentation. In a
different way, Plissiti and Nikou (2012) presents a
framework for efficient classification of cervical cells
into normal and altered categories based exclusively
VISAPP 2020 - 15th International Conference on Computer Vision Theory and Applications
846

on the extraction of texture characteristics from the
core area. Non-supervised classifiers and non-linear
clustering techniques are used, as well as genetic al-
gorithms for resource selection. Also examined is
the efficiency of nonlinear dimensionality reduction
schemes to produce an accurate representation of the
multiple cell characteristics. This provides results
that allow to analyze the efficiency of systems based
on the exclusive extraction of characteristics coming
from the nuclei when compared to the systems that
use extraction of characteristics of the complete cell.
In the state of the art, there are methods that em-
ploy Deep Learning, as in Arajo et al. (2019). This
paper presents a computational tool for cytological
analysis using Deep Learning (CNN) techniques for
cell segmentation in conventional Pap smears im-
ages containing a high degree of cell overlap. Its
results demonstrate high efficiency for the proposed
approach, as well as robustness for the presence and
interference of neutrophils, noises and other artifacts
very common in Pap smears that compromise auto-
mated classification. Despite the effectiveness, tech-
niques that use Deep Learning and neural networks,
present some dysfunctions: they need a large num-
ber of images for training; present high computational
cost; and, mainly, do not allow the identification of the
attributes used and their respective amounts. Some-
thing that makes it impossible to correlate the com-
putational technique with the biological context and
thus leads us to seek alternative solutions, as well as
the system presented here.
Differently from the techniques mentioned above,
our proposal uses a database of real cervical cytology
images with multiple cells obtained from pap smears
images. In addition, the segmentation and extraction
of geometric characteristics are not used, in order to
allow the classification of images where it is not pos-
sible to identify cytoplasmic and nuclear boundaries.
3 METHODOLOGY
This section describes the stages of development of
this article. Section 3.1 specifies the image database
used. Section 3.2 describes the pre-processing step to
which the images are submitted. Section 3.3 presents
the textural features extracted from the previously se-
lected set of images. Section 3.4 introduces the super-
vised learning method used for classification, as well
as describing the system of class division chosen for
this system. Finally, Section 3.5 describes the process
of analyzing the results obtained on the basis of sta-
tistical metrics. The proposed system architecture is
represented in Figure 2.
Figure 2: Architecture of the proposed system.
3.1 Database
All images used were obtained from the the Brazil-
ian Health System (Arajo et al., 2019). This database
consists of 11473 cellular nuclei obtained from 400
1392x1040 images. All of them are scanned from the
use of an optical microscope associated with a 40x
magnification camera and individually represent seg-
ments of the slides that may have different numbers
and cell types. This private database is a product of a
multidisciplinary team of researchers in computer sci-
ence and biology who provides a collection of real im-
ages of human cervical cytology smears representing
a range of different cervical cell lesions interpreted by
independent cytopathologists, which are listed below:
1. Normal cells;
2. Atypical squamous cells of undetermined signifi-
cance (ASC-US);
3. Atypical squamous cells, cannot exclude a high-
grade lesion (ASC-H);
4. Low-grade squamous intraepithelial lesion
(LSIL);
5. High-grade squamous intraepithelial lesion
(HSIL);
6. Scamous cell carcinoma (SCC);
3.2 Pre-processing and Training
Database
As mentioned, since we do not use nuclei or cyto-
plasm segmentation, all parts of the image are used
for the training and construction of the classification
model. In this preprocessing step the database images
are cut out in 50x50 pixels throughout their size, as
exemplified in Figure 3.
These cuts are made in an orderly manner from
left to right and top to bottom. However, it is arbi-
trary in relation to the exact position of the cells and
Automatic Classification of Cervical Cell Patches based on Non-geometric Characteristics
847
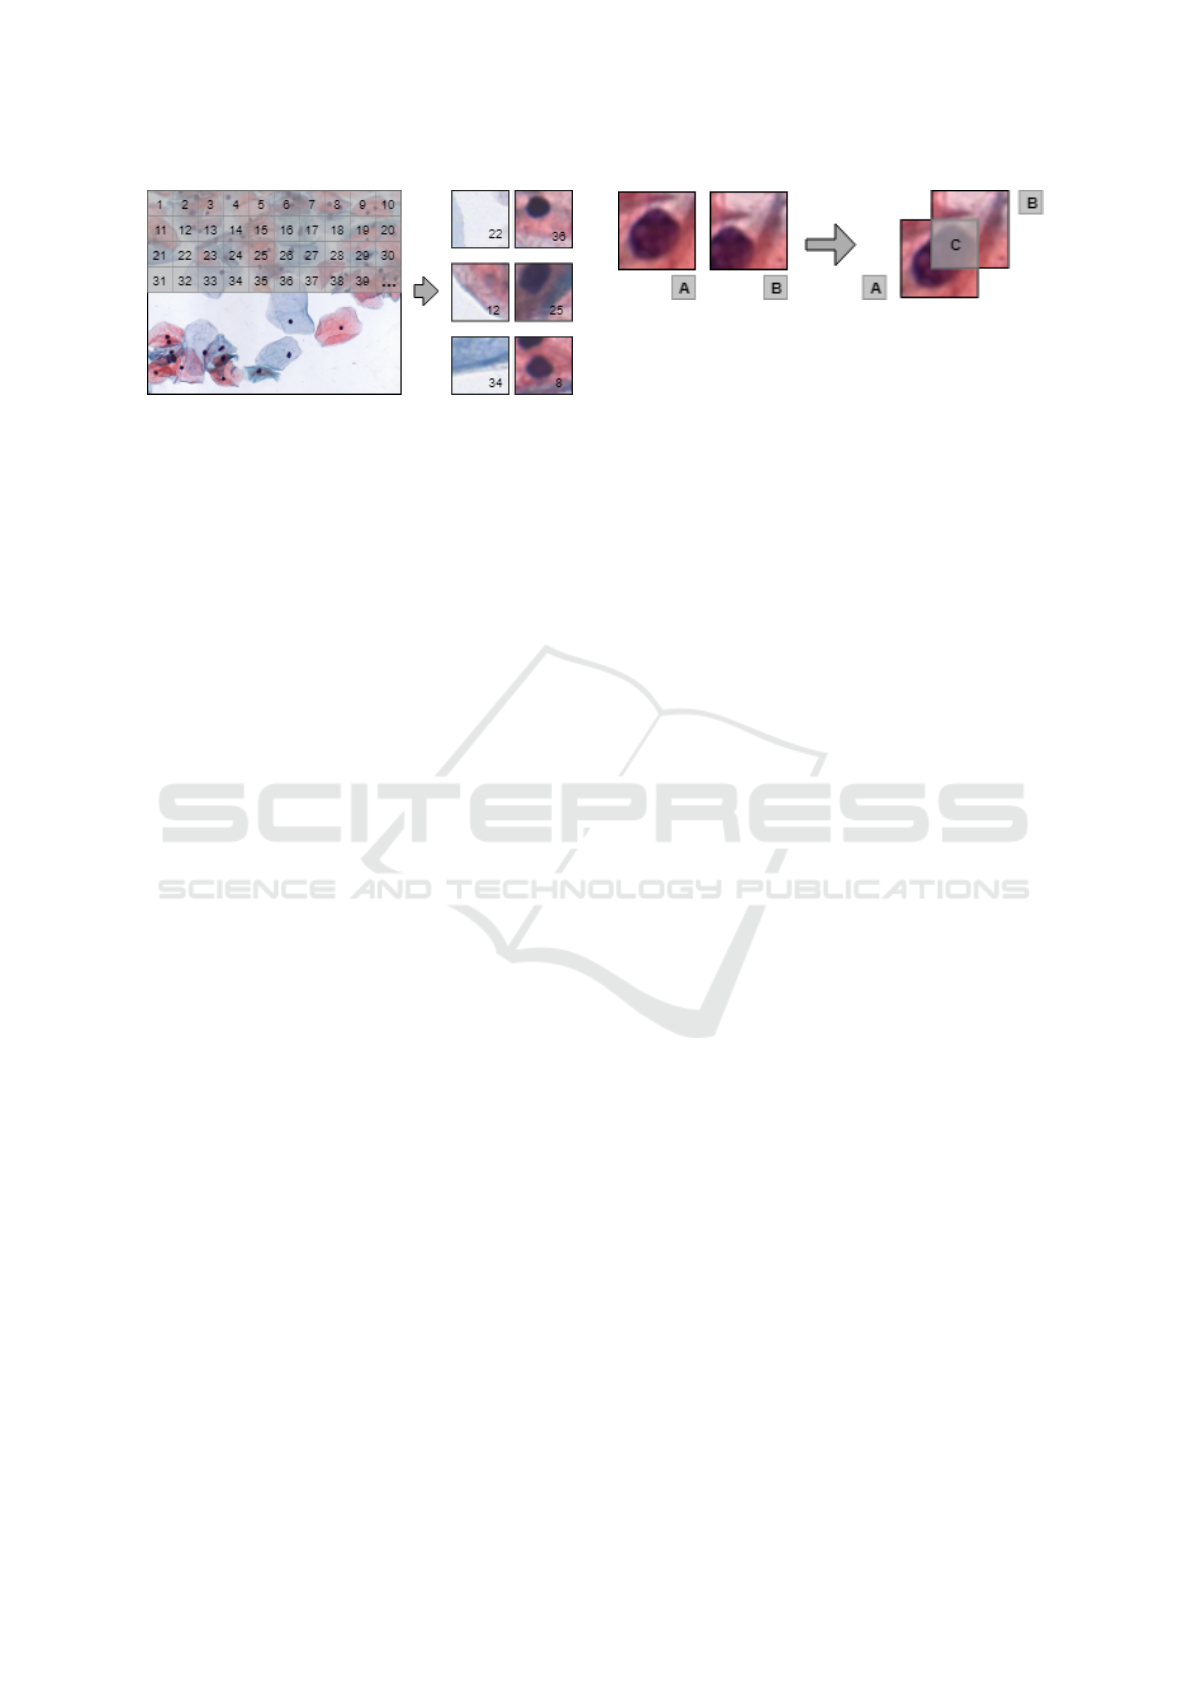
Figure 3: Example of preprocessing step. The numbering
represented in this image is unrealistic only for demonstra-
tion purposes, as well as the size of the cutouts.
nuclei, as illustrated in Figure 3. The definition of
the information for the training is very important be-
cause they accurately compose the set of information
regarding each lesion and lead to a good accuracy in
the result. Accordingly, the pre-processing step re-
sults in reduced-size images which:
• They comprise sufficient nuclear information to
be encompassed by any of the classes of lesions
described below;
• They comprise insufficient nuclear fragments to
be considered within some class of lesions and are
thus categorized as noises;
• They comprise cell overlaps and are only enclosed
within injury classes if they include at least 60%
of the nuclear information of any of the cells in-
volved;
• They do not comprise any nuclear information
and therefore are also included in the noise cat-
egory;
To verify if there is enough information in a clip-
ping to match one of the nuclear classes of the clas-
sification system, the data provided by the database
is used in the training step regarding the location of
the nuclei within the images. Based on the positions
of the nuclei, a comparison is made between cut-outs
made from the central positions of all nuclei present in
the image and the arbitrary cut-off performed by the
pre-processing at that time, as illustrated by Figure 4.
In addition, this cut-out around the central position
(x, y) of an image core is used as input to the train-
ing and testing step, along with the arbitrary cut-offs
obtained, in order to allow the classifier to also learn
how to categorize cores as a whole.
As a consequence, the overlap value of these im-
ages is obtained, which, if having a value equal to
zero, is indicated as position cutouts that do not cor-
respond to image cores. If a value greater than zero is
detected, the juxtaposition of the cutouts is detected
and in the specific case of having a value greater than
or equal to 60% of the area of the cut, it is determined
Figure 4: Example of a comparison between cuts, where:
(A) represents the cut form a core central position; (B) rep-
resents the cut being performed by a preprocessing at that
instant (C) represents the intersection between two cuts,
which, in this case, have higher or equal value to 60% of
their individual areas.
that it has enough information to be framed as a cell
nucleus region and is identified as one of the classes
of lesions, different from the noises.
The proposed trimming creates a new unit delim-
ited in the region near the cellular nucleus, with less
information, alternatively for the segmentation that is
not used. The size of this cut was empirically de-
fined from a series of tests and parameter adjustments
where the best results were presented by the images in
the dimension chosen here. All cutouts obtained from
pre-processing are used as input to the sorting step. It
should be noted that the classification step does not
use this information regarding the position of the nu-
cleus, but rather a comparison between the attributes
of a region of the image with those used in the train-
ing.
3.3 Feature Extraction
From the study presented in Section 2, a subset of
characteristics with a high discriminative capacity to
be extracted from the set of cutouts defined as training
was defined. All selected features refer to information
related to the texture of the images and do not undergo
segmentation preprocessing to be obtained due to the
research objective. Are they:
• Average Intensity;
• Maximum Intensity Value;
• Minimum Intensity Value;
• Local Binary Patern (LBP);
• Histogram of Oriented Gradients (HOG);
• Gray-Level Co-Occurrence Matrix (GLCM);
• 7 Hu Moments;
• Haralick’s Texture Features (Haralick, 1979):
– Angular Second Moment (Energy);
– Contrast;
– Correlation;
– Variance;
– Entropy;
VISAPP 2020 - 15th International Conference on Computer Vision Theory and Applications
848

– Maximal Correlation Coefficient;
– Inverse Difference Moment (Homogeneity);
– Sum Average, Sum Variance and Sum Entropy;
– Difference Variance and Difference Entropy;
– Information Measure of Correlation I and II.
3.4 Classification and Testing
The manual classification of the entire dataset of the
base used was done by specialists of the area and was
used as terrestrial truth. For the classification pro-
posed here, two and three classes systems were used,
shown in Figure 5 and described as follows:
• 2Class: In this system, the lesions are grouped
into two classes. In the first class only normal
cells and in the second lesions ASC-US, ASC-H,
LSIL, HSIL and SCC, forming the class of altered
cells. The classification using this system aims to
classify images only from the presence or absence
of lesion.
• 3Class: In this system, the lesions are grouped
into three classes. In the first class, there are only
normal cells. In the second, there are the lesions
of light severity ASC-US and LSIL. And finally,
in the third class, there are the lesions of high
ASC-H, HSIL and SCC. Throughout the remain-
der of this document, the second class is referred
to as mild injuries and the third class is referred
to as serious injuries. This proposal aims to clas-
sify images based on the diagnosis and treatment
given to the patients detected with these groups of
lesions. Where: patients without lesion (normal
class) after receiving two negative results of the
examination, only need to repeat it after 3 years;
Patients with light-class lesions need follow-up
and should repeat the exam within 6 months or
1 year; patients with severe class injuries require
special care and must perform colposcopy and/or
biopsy.
Figure 5: Classification system used.
In both systems a further class is included that
includes cutouts that do not have relevant classifica-
tion information, such as blade bottoms or other non-
nuclear elements. The purpose of this class is to allow
the classifier to learn to ignore information that is not
important for cell sorting. This class will be referred
to as noises in the remainder of this document.
For the classification was used the algorithm Sup-
port Vector Machine (Bishop, 2006). This method of
supervised learning is a formally discriminative clas-
sifier that identifies and constructs a model with a
class separation hyper plane. It receives as input a set
of data and predicts, for each given input, which of the
possible classes the input is part of, making it a non-
probabilistic linear classifier. In the training stage, all
the image cutouts defined in Section 3.2 were used. In
addition, K-Fold cross validation is applied to ensure
the generality and impartiality of the results obtained,
using K=10%.
3.5 Evaluation
For the evaluation of the results and classification per-
formance, some metrics were extracted. First, for the
calculation of statistical measures, the number of true
positives (TP), which refer to altered nuclei correctly
classified as altered, true negatives (TN), which re-
fer to normal nuclei correctly classified as normal,
false positives (FP), which refer to normal nuclei erro-
neously classified as altered and false negatives (FN),
which refer to altered nuclei erroneously classified as
normal. The statistical measures are described below:
3.5.1 Precision
Is the percentage of data that is correctly classified
for the class to which it truly belongs, i.e. normal as
a normal class or altered as altered class in the 2-class
problem. In the 3-class problem, it is applied directly
to the correctly classified data in the normal classes,
mild lesions and severe lesions. Precision is defined
as:
Precision =
T P + T N
T P + FN + T N + FP
(1)
3.5.2 Sensitivity
Is the percentage of changed data that is correctly
classified as changed (true positive). The sensitivity
is defined as:
Sensitivity =
T P
T P + FN
(2)
The sensitivity calculation in the 2-class problem
is simple. However, in the 3-class problem, we need
to regroup ASC-US, LSIL, ASC-H, HSIL and SCC to
form a single class of altered cells. After that, the sen-
sitivity calculation is the same as in the 2-class prob-
lem.
Automatic Classification of Cervical Cell Patches based on Non-geometric Characteristics
849

3.5.3 Specificity
Is the percentage of normal data that is correctly clas-
sified as normal (true negative). Specificity is defined
as:
Speci f icity =
T N
T N + FP
(3)
Similar to the Sensitivity calculation, the compu-
tation of Specifi- city in the 2-class problem is sim-
ple, whereas ASC-US, LSIL, ASC-H, HSIL and SCC
need to be regrouped as a class of altered cells in the
3-class problem.
3.5.4 F1 Score
Is a relationship between precision and sensitivity to
provide a single, balanced measurement for the sys-
tem. The F1 Score is defined as:
F1 = 2 ∗
Precision ∗ Sensitivity
Precision + Sensitivity
(4)
4 RESULTS AND DISCUSSION
The classification was made from texture character-
istics extracted from images obtained from the Pap
smears examination. Different combinations of char-
acteristics were experienced from the use of Principal
Component Analysis (PCA) as a dimensionality re-
duction technique. The best results were presented
using all the characteristics described in Section 3.3.
The step-by-step procedure of the system pro-
posed here is shown in Figure 2. As discussed in Sec-
tion 3.4, two distinct classification experiments are
proposed, one with two classes (2Class), investigat-
ing the presence or not of image damage, and another
with three classes (3Class), allowing differentiation
not only between the presence or absence of lesions,
but also between mild or severe lesions.
The performance of several classification algo-
rithms was analyzed and compared. The most ef-
ficient method for separating the data set was the
SVM with accuracy of 89.7% for the classification in
two classes and 85.1% for the classification in three
classes. Other results obtained are presented in Table
1 and Table 2. It is important to note that, in order
to calculate these metrics, the information about the
noise class was disregarded, that is, any values ob-
tained from the confusion matrix involving the noise
class were not accounted for.
In order to provide effective aid in the detection
of lesions in images obtained from Pap smears, the
effectiveness of the results obtained was investigated
Table 1: Results for 2 Class patches classification.
Metrics Values
Precision 0.897
Recall 0.917
Specificity 0.883
F1 Score 0.907
Table 2: Results for 3 Class patches classification.
Metrics Values
Precision 0.851
Recall 0.954
Specificity 0.778
F1 Score 0.899
in both computational and biological bias. According
to the experts who performed the manual classifica-
tion of the database, as the objective of the system is
to provide a classification tool or preliminary rank-
ing of the images obtained in the slides, not exclud-
ing the function of the cytopathologist at the end of
the structure to make the diagnosis official in the sce-
nario of a possible presence of injury, but rather pro-
viding support for decision-making, emphasizing that
the main problem that must be tackled within the pro-
posed structure are the false negative classifications,
i.e. do not find lesions that actually exist.
In these situations, the diagnosis of an injury is
not detected, causing the patient to create a false tran-
quility and remain at risk of developing the cancer.
The experts also explain that false positive diagnoses
are not essential problems in the context of the real
application of this system, because these images will
be analyzed by the cytopathologist for final diagno-
sis, and if the blade indicated with lesions does not
actually have them, the diagnosis will be given as nor-
mal and the patient will receive the correct diagnosis.
However, in false negative diagnoses, the blade that
contains lesions and is classified as normal is not des-
ignated for evaluation in the second instance by the
cytopathologist and in this way the system could lead
to incorrect diagnoses.
From this, several experiments were performed
and the performance of the classification technique
was measured by varying the defined parameters in
order to obtain the greatest possible decrease of the
amount of false negatives reached by the system. The
obtained results are satisfactory for the context of the
application in real environment, being: 1.87% of false
negatives in the system of 3 classes and 3.41% in the
system of 2 classes. It is also worth mentioning that,
throughout the development of this article, the used
techniques were chosen in order to reduce as much as
possible the computational cost of the proposed struc-
ture. This is due to the fact that, from a single Papan-
VISAPP 2020 - 15th International Conference on Computer Vision Theory and Applications
850

icolaou slide, are obtained between 10 to 15 thousand
images with a 40x magnification and, as in a realis-
tic environment there is too many of these slides for
analysis, in order that the structure here proposed has
functional applicability in this environment, the clas-
sification of an image must happen quickly. Making
elementary techniques stand out in relation to robust
techniques.
5 CONCLUSION
Precisely classifying cell nuclei in real images of Pap
smear is a necessary condition to provide more ac-
curate and reliable diagnostics. Since in this type
of image the information about nuclear and cytoplas-
mic boundaries is complex and computationally in-
feasible, this paper presents a structure for the clas-
sification of real cervical cytology images from the
extraction of non-geometric textural features without
the use of learning from neural networks or from seg-
mentation algorithms.
The proposed structure has realistic application to
help in the diagnosis and screening of cervical cancer.
A supervised learning classifier, SVM, was used for
classification and system performance was measured
with actual cervical cytology images, created from the
Pap smear, provided by a private searchable imaging
database.
The results obtained by our experiments indicate
the optimum performance of the proposed system in
the process of categorization of lesions present in Pap
smears images, presenting high precision and low
false negative index. This implies that the efficient
characterization of an actual cervical cytology image
is feasible only with the use of non-geometric extrac-
tion features.
In the medical and biological context, the pro-
posed structure serves as a preliminary Pap smears
classifier that determines the likelihood of lesions in
an image and signals them to be analyzed by a cy-
topathologist when necessary and provide a definitive
diagnosis of more practical, efficient and with quality
assurance. In addition, correlating biology and com-
putation, pertinent conclusions can be inferred regard-
ing the rigidity or flexibility required for a system to
have effective applicability in real environments.
6 FUTURE WORKS
As future works we intend to investigate the efficiency
of the proposed system when applied in a larger num-
ber of real images not cataloged and to construct a
system that allows the return of these regions to the
analysis of the cytopathologist. Another important
factor to be examined are the sets of descriptors, per-
forming a more systematic investigation for the in-
clusion of information that allows the increase of the
precision of the method.
ACKNOWLEDGEMENTS
The authors thanks Conselho Nacional de De-
senvolvimento Cient
´
ıfico e Tecnol
´
ogico (PIBITI-
CNPq), Universidade Federal de Ouro Preto (UFOP),
Fundac¸
˜
ao de Amparo
`
a Pesquisa do Estado de Mi-
nas Gerais (PPSUS-FAPEMIG/APQ-03740-17), the
Moore-Sloan Foundation, and Office of Science,
of the U.S. Department of Energy under Contract
No. DE-AC02-05CH11231 for also supporting this
research. Any opinion, findings, and conclusions or
recommendations expressed in this material are those
of the authors and do not necessarily reflect the views
of the Department of Energy or the University of Cal-
ifornia.
REFERENCES
Arajo, F. H., Silva, R. R., Ushizima, D. M., Rezende, M. T.,
Carneiro, C. M., Bianchi, A. G. C., and Medeiros,
F. N. (2019). Deep learning for cell image segmen-
tation and ranking. Computerized Medical Imaging
and Graphics, 72:13 – 21.
Bishop, C. M. (2006). Pattern Recognition and Ma-
chine Learning (Information Science and Statistics).
Springer-Verlag, Berlin, Heidelberg.
Haralick, R. M. (1979). Statistical and structural approaches
to texture. Proceedings of the IEEE, 67(5):786–804.
Jantzen, J., Norup, J., Dounias, G., and Bjerregaard, B.
(2005). Pap-smear benchmark data for pattern clas-
sification. Nature Inspired Smart Information Systems
(NiSIS).
Lakshmi, G. K. and Krishnaveni, K. (2014). Multiple fea-
ture extraction from cervical cytology images by gaus-
sian mixture model. In 2014 World Congress on Com-
puting and Communication Technologies, pages 309–
311.
Lorenzo-Ginori, J. V., Curbelo-Jardines, W., L
´
opez-
Cabrera, J. D., and Huergo-Su
´
arez, S. B. (2013). Cer-
vical cell classification using features related to mor-
phometry and texture of nuclei. In Ruiz-Shulcloper,
J. and Sanniti di Baja, G., editors, Progress in Pat-
tern Recognition, Image Analysis, Computer Vision,
and Applications, pages 222–229, Berlin, Heidelberg.
Springer Berlin Heidelberg.
Mariarputham, E. J. and Stephen, A. (2015). Nominated
texture based cervical cancer classification. In Com-
putational and Mathematical Methods in Medicine.
Automatic Classification of Cervical Cell Patches based on Non-geometric Characteristics
851

Plissiti, M. E. and Nikou, C. (2012). Cervical cell clas-
sification based exclusively on nucleus features. In
Campilho, A. and Kamel, M., editors, Image Analysis
and Recognition, pages 483–490, Berlin, Heidelberg.
Springer Berlin Heidelberg.
Plissiti, M. E., Nikou, C., and Charchanti, A. (2011). Au-
tomated detection of cell nuclei in pap smear im-
ages using morphological reconstruction and cluster-
ing. IEEE Transactions on Information Technology in
Biomedicine, 15(2):233–241.
Plissiti, M. E., Nikou, C., and Charchanti, A. (2011). Com-
bining shape, texture and intensity features for cell nu-
clei extraction in pap smear images. Pattern Recogni-
tion Letters, 32(6):838 – 853.
Singh, D., Verma, A., Aneja, M., and Singh, B. (2015). Cer-
vical cell classification using random forests. Interna-
tional Conference on Medical Physics and Biomedical
Engineering.
Sobrevilla, P., Montseny, E., Vaschetto, F., and Lerma, E.
(2010). Fuzzy-based analysis of microscopic color
cervical pap smear images: Nuclei detection. Interna-
tional Journal of Computational Intelligence and Ap-
plications, 9:187–206.
Walker, R. F., Jackway, P., Lovell, B., and Longstaff, I. D.
(1994). Classification of cervical cell nuclei using
morphological segmentation and textural feature ex-
traction. In Proceedings of ANZIIS ’94 - Australian
New Zealnd Intelligent Information Systems Confer-
ence, pages 297–301.
World Health Organization (2018). Global cancer statistics.
http://gco.iarc.fr/. Last checked on Oct 23, 2018.
VISAPP 2020 - 15th International Conference on Computer Vision Theory and Applications
852
