
Compact Early Vision Signal Analyzers in Neuromorphic Technology
Valentina Baruzzi
1
, Giacomo Indiveri
2 a
and Silvio P. Sabatini
1 b
1
Department of Informatics, Bioengineering, Robotics and Systems Engineering, University of Genoa, Genoa, Italy
2
Institute of Neuroinformatics, University of Z
¨
urich and ETH Z
¨
urich, Z
¨
urich, Switzerland
Keywords:
Early Vision, Gabor Filters, Receptive Fields, Neuromorphic Engineering, Event-based Sensors, Bioinspired
Vision, Harmonic Representations.
Abstract:
Reproducing the dynamics of biological neural systems using mixed signal analog/digital neuromorphic cir-
cuits makes these systems ideal platforms to implement low-power bio-inspired devices for a wide range of
application domains. Despite these principled assets, neuromorphic system design has to cope with the limited
resources presently available on hardware. Here, different spiking networks were designed, tested in simula-
tion, and implemented on the neuromorphic processor DYNAP-SE, to obtain silicon neurons that are tuned to
visual stimuli oriented at specific angles and with specific spatial frequencies, provided by the event camera
DVS. Recurrent clustered inhibition was successfully tested on spiking neural networks, both in simulation
and on the DYNAP-SE board, to obtain neurons with highly structured Gabor-like receptive fields (RFs);
these neurons are characterized by tuning curves that are sharper or at least comparable to the ones obtained
using equivalent feed-forward schemes, but require a significantly lower number of synapses. The resulting
harmonic signal description provided by the proposed neuromorphic circuit could be potentially used for a
complete characterization of the 2D local structure of the visual signal in terms of phase relationships from all
the available oriented channels.
1 INTRODUCTION
The goal of early vision is to extract as much in-
formation as possible about the structural properties
of the visual signal. Such a process must be ef-
ficient, providing reliable features of high informa-
tive content in short time, in order not to compro-
mise the efficacy of subsequent processing stages, and
without being, at the same time, an unbearable bot-
tleneck. Recent asynchronous event-driven cameras
combined with brain-inspired spiking neuromorphic
processors can be a solution. They, indeed, constitute
reconfigurable systems of silicon neurons that operate
on mixed (analog/digital) signal to achieve sophisti-
cated real-time visual processing. Due to the imple-
mentation limit for connectivity patterns between sili-
con neurons, vision front-ends typically restrict them-
selves to be image edge and moving object detectors.
Sometimes, neurons operate exclusively on temporal
contrast events, disregarding the spatial contrast, that
is the local spatial structure of the visual signal, ob-
tained by integrating visual events over spatial neigh-
a
https://orcid.org/0000-0002-7109-1689
b
https://orcid.org/0000-0002-0557-7306
borhoods (e.g., (Osswald et al., 2017)). Sometimes,
they implement simple (e.g., binary) feature match-
ing, by composing local receptors outputs through re-
ceptive fields (RFs) with minimal and simple weight-
ing profiles (e.g., (M
¨
uggler et al., 2017) ). Specific
matched operators extract informative (symbolic) el-
ements of an image, such as points and lines, but in-
escapably discard part of the signal. A more sophis-
ticated visual signal analysis would require highly
structured RFs, e.g., with 2D wavelet-like profiles
to extract local amplitude, phase, and orientation in-
formation in a given frequency sub-band (cf. linear
visual cortical cell responses, see e.g. (Jones and
Palmer, 1987)). In general, for many image process-
ing tasks, it is commonly used to represent an image
by oriented spatial-frequency channels in which some
properties of the image are better represented than in
image space. The spatio-temporal properties of the
resulting harmonic components have been proved to
be critically important for extracting primary early vi-
sion information. Indeed, in general, as evidenced
in several studies (e.g., see (Fleet and Jepson, 1993)
(Ogale and Aloimonos, 2007) (Sabatini et al., 2010)),
by using harmonic patterns for matching instead of
530
Baruzzi, V., Indiver i, G. and Sabatini, S.
Compact Early Vision Signal Analyzers in Neuromorphic Technology.
DOI: 10.5220/0009171205300537
In Proceedings of the 15th International Joint Conference on Computer Vision, Imaging and Computer Graphics Theory and Applications (VISIGRAPP 2020) - Volume 4: VISAPP, pages
530-537
ISBN: 978-989-758-402-2; ISSN: 2184-4321
Copyright
c
2022 by SCITEPRESS – Science and Technology Publications, Lda. All rights reserved

image luminance measures, the resulting perception
is more reliable (i.e., stable), denser and immune to
lighting conditions.
Since a direct implementation of such wavelet RFs
on neuromorphic hardware is hampered by the lim-
ited wiring capability between silicon neurons, de-
signing and validating efficient architectural solutions
to obtain compact visual signal analyzers with min-
imal resource consumption becomes a key issue. In
this paper, we propose an economic way to imple-
ment spike-based early-vision detectors of oriented
features in given spatial frequency bandwidths that
mimic the known properties of Gabor-like simple
cells RFs in the primary visual cortex (V1) (Jones
and Palmer, 1987). In particular, we developed a re-
current neural network architecture based on a model
of the retinocortical visual pathway to obtain neurons
highly tuned to oriented visual stimuli along a spe-
cific direction and with a specific spatial frequency,
with Gabor-like RFs. The computation performed by
the biological retina is emulated by an asynchronous
event-driven Dynamic Vision Sensor (DVS) (Licht-
steiner et al., 2008), which only indicates luminance
temporal changes in the image impinging on the pho-
todiode array. Its output feeds a neuromorphic pro-
cessor (DYNAP-SE) (Moradi et al., 2018) with re-
configurable silicon neurons that comprises adaptive
integrate-and fire neurons and dynamic synapses. We
show how the network implemented on this device
gives rise to neurons tuned to specific orientations
and spatial frequencies, independent of the temporal
frequency of the visual stimulus. Compared to al-
ternative feed-forward schemes, the model proposed
produces highly structured RFs of any phase symme-
try with a limited number of synaptic connections,
thus optimizing hardware resources. We validate the
model and approach with experimental results using
both synthetic and natural images.
2 MATERIALS AND METHODS
The system setup (see Fig. 1), consists of a DVS,
representing the retinal stage, whose output is fed to
a DYNAP-SE board, representing the cortical stage.
The sensor is composed of pixels that respond asyn-
chronously to relative changes in light intensity, gen-
erating a stream of ‘events’ that constitute its out-
put. Each event encodes the timestamp at which it
occurred, the position of the pixel that detects it, and
its polarity (ON and OFF for positive and negative
intensity changes, respectively). Sensor activity is
reproduced by a population of spiking ‘virtual neu-
rons’, implemented digitally by a FPGA module on
the DYNAP-SE board, which acts as spike genera-
tor for the physical silicon neurons on the chip. One
of the chips on the DYNAP-SE board is programmed
so to have a specific configuration of synaptic con-
nections, described in the following, that gives rise to
silicon neurons with well-structured Gabor-like RFs.
These neurons are thus tuned on a specific orienta-
tion and spatial frequency, reproducing the computa-
tion carried out by simple cells in the primary visual
cortex. The ‘membrane voltage’ of selected silicon
neurons can be observed using an oscilloscope and the
spiking activity of the entire chip can be monitored in
real time on a computer through the CTXCTL Primer
interface (aiCTX, 2018).
2.1 Network Scheme
In order to obtain neurons with Gabor-like RFs that
act as early vision feature extractors, while deal-
ing with the limited number of synaptic connec-
tions available on the chip, we adopted the recurrent
clustered inhibition approach, described in (Sabatini,
1996). Ideally, the network is thus composed of a first
population of neurons representing the retinal stage
(’retina layer’) and a second population representing
the cortical stage (’V1 layer’). Each neuron of the
V1 layer receives excitatory afference from a group
of neurons in an elongated region on the retina layer
(feed-forward kernel) and inhibitory afference from
two groups of neurons of the same layer (recurrent
or feed-back kernel), in regions that are displaced
orthogonally to the major axis of the feed-forward
kernel (see left side of Fig. 1). For both feed-
forward and recurrent contributions we adopt Gaus-
sian weighting profiles. Each neuron with such a
connectivity scheme will have an induced RF with a
spatial profile described by a two-dimensional Gabor
function, as a result of the combination of the feed-
forward excitatory and the recurrent inhibitory con-
tributions.
2.2 Simulated Network
To test the efficacy of the recurrent clustered inhibi-
tion approach for the the spiking neuron implementa-
tion, the network was first simulated by using Brian2
(Stimberg et al., 2019) and its toolbox teili (Milde
et al., 2018). This simulator for spiking neural net-
works implements the model of the physical silicon
neurons on the DYNAP-SE board. The simulated net-
work has the structure described above, and discrete
nature.
The use of sinusoidal gratings as visual input allowed
us to extract the spatial frequency and orientation tun-
Compact Early Vision Signal Analyzers in Neuromorphic Technology
531
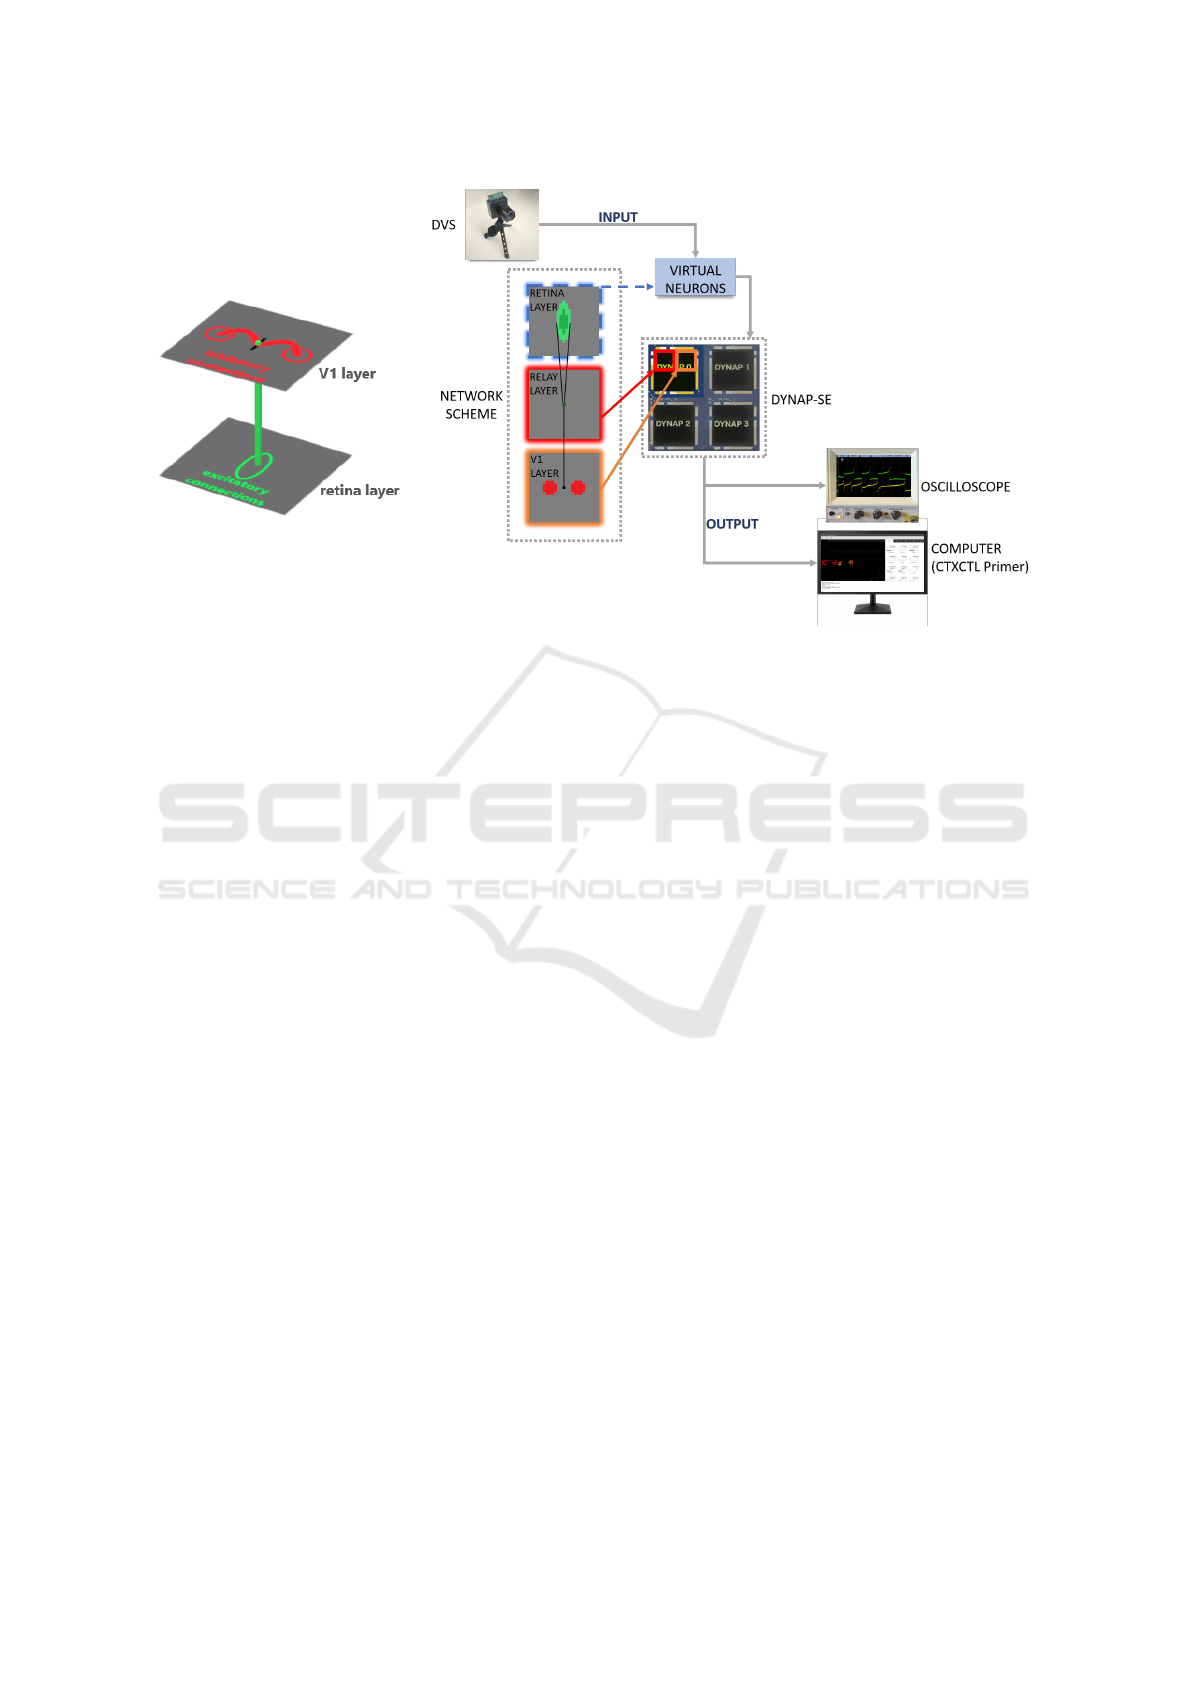
Figure 1: General structure of the network and connectivity scheme. (Left) The target neuron, indicated as a black bar on the
V1 layer, receives feed-forward excitation from neurons of the retina layer within an elongated region, and recurrent inhibition
from V1 neurons located in two circular clusters displaced symmetrically along the orientation selectivity bias provided by
feed-forward afferent connections. The direction of the bar indicates the orientation to which the neuron will be eventually
sensitive according to such connectivity scheme. The same pattern of connections is repeated for every neuron of the V1
layer. (Right) The overall system setup detailing how the model network has been physically mapped on the DYNAP-SE
board. The DVS output is reproduced by a population of spiking ‘virtual neurons’ that acts as spike generator for the physical
silicon neurons on the DYNAP-SE chips. The board can be connected to an oscilloscope, to observe the ‘membrane voltage’
of selected silicon neurons, and to a computer, through the CTXCTL Primer interface, to monitor the spiking activity of the
four chips in real time. For more details see text.
ing curves of the neurons of interest in the V1 layer,
offering a way to verify the efficacy of the recurrent
clustered inhibition in molding the neurons’ tuning on
specific values of these features. Moreover, the sim-
ulation process allowed us to verify the assumption
of linearity of the network’s behaviour and to tune
the significant parameters of the connectivity scheme,
i.e. distance between the recurrent Gaussian clusters,
size of the clusters and strength of the inhibition to
obtain the narrowest tuning curves. For the sake of
simplicity, the size of the feed-forward kernel and the
strength of the excitation are kept constant.
This process leads to RFs for the neurons of the V1
layer that can be considered feature extractors for ori-
entation and spatial frequency. The preferred orienta-
tion selectivity can be controlled by rotating the con-
nectivity scheme, while the peak spatial frequency
can be varied by scaling the displacement of the in-
hibitory kernels with respect to their size. However,
due to the network structure through which they were
created, they all have an even symmetry, i.e. they
all exhibit the same (zero) phase. To overcome this
limitation and obtain feature extractors with arbitrary
phase values, we adopted a method similar to the
one described in (Raffo et al., 1998). Considering
the one-dimensional projections of the spatial pro-
files of the RFs, obtained as the Fourier transform
of their spatial frequency tuning curves, they can be
summed in a convenient way to obtain a profile with
the desired phase value. In particular, we considered
3 neurons of the V1 layer, the central one in posi-
tion n and the lateral ones at the positions n − k and
n + k, where k is chosen to be approximately the dis-
tance d, in terms of neuron index, between a target
neuron of the V1 layer and the centers of the Gaus-
sian clusters from which it receives recursive inhibi-
tion. This way, the maximum of the spatial profiles of
the RFs of the lateral neurons will lay in correspon-
dence with the minima of the spatial profile of the RF
of the central neuron. By weighting the sum of the
three profiles with α = − sinψ− 0.5· cos ψ, β = cos ψ,
γ = sinψ − 0.5 · cos ψ we can obtain a spatial profile
with any desired phase value (ψ).
2.3 Network Implementation on the
DYNAP-SE Board
Based on the results obtained through simulations, we
implemented the network on the DYNAP-SE board.
It is worth noting that, to overcome the restrictions
VISAPP 2020 - 15th International Conference on Computer Vision Theory and Applications
532
posed by the chip, the network structure had to be
modified. In particular, since every neuron can have
at most 64 afferent connections, it was necessary an
extra layer of neurons, the relay layer, between the
retina layer and the V1 layer, to increase the number
of available synapses. The relay layer receives ex-
citation from the feed-forward kernels on the retina
layer and projects one-to-one connections to the V1
layer, where the inhibitory recursion is then applied.
The weights were adjusted so that that the network
with this new structure behaves in an equivalent way
to the simulated one. Moreover, each chip is di-
vided into four cores, and all the neurons belong-
ing to a core share the same biases, including the
synaptic weights of the afferent connections. Also,
only two types of excitatory synapses and one type
of inhibitory synapses were available for each neu-
ron. Due to these constraints, the weights of the con-
nections that form the kernels could not be assigned
by sampling Gaussian functions. Instead, we adopted
a constant value for the weights of the recurrent in-
hibitory connections, and two values for feed-forward
excitatory connections (higher at the center and lower
at the periphery of the kernel).
The DYNAP-SE board was interfaced with the com-
puter through the software CTXCTL Primer, which
provides a Python console that can be used to send
commands to define the connectivity of the silicon
neurons, to set biases to specific values, to send in-
puts to the neurons, and to record their activity.
2.4 Visual Stimuli Dataset
We choose as input sinusoidal gratings, widely used
in the literature to investigate the response of cells
in the primary visual cortex. Gratings with different
orientations and spatial frequencies allow us to ob-
tain the tuning curves that characterize a neuron’s be-
havior. Specifically, the open source platform for be-
havioral science experiments PsychoPy (Peirce et al.,
2019), was used to generate moving sinusoidal grat-
ings with specific orientation, measured in degrees,
spatial frequency, measured in cycles/deg, and tem-
poral frequency, measured in Hertz. The moving grat-
ings were displayed on a screen and recorded by the
DVS. jAER (Delbruck, 2007), an open-source Java-
based framework, was used to set the camera biases
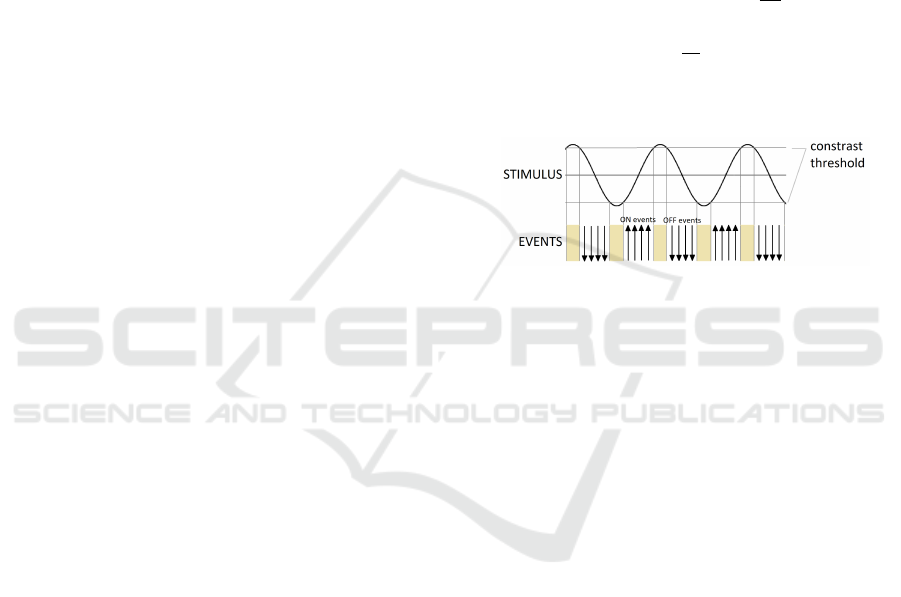
and record the data. Figure 2 shows how the sinu-
soidal grating is perceived by the DVS sensor. Since
the DVS is sensitive to local contrast changes, bands
of ON and OFF events are generated where the si-
nusoidal profile is steep enough. Conversely, where
the profile is almost flat, contrast differences are too
small to be detected by the sensor and no events are
generated, resulting in bands without events, which
are wider or narrower according to the contrast sensi-
tivity threshold. The spatial frequency information is
preserved anyway, encoded in the period of the bands
of events, not in their width; it is worth noting that the
phase is shifted by 90
◦
.
For a given distance D between the display and the
DVS, the angular and the linear field of views of the
sensor, AFOV and LFOV, respectively, can be ex-
pressed as a function of the focal length f of the lens
and the size W of the pixel array:
AFOV = 2 arctan
W
2 f
LFOV =
W
f
D
For the DVS128, W is 128 pixels × 40 µm/pixel =
5.12 mm.
Figure 2: How the sinusoidal grating is converted in events
by the DVS. Upward arrows represent ON events and down-
ward arrows represent OFF events. Beige stripes are regions
without events.
3 RESULTS
3.1 Linearity Test and Feature Tuning
Characterization
First, we tested the linearity assumption. If the net-
work behaves in a linear way, the firing rate of the
neuron of interest should be modulated by the same
temporal frequency of the grating used as input. Fig-
ure 3 shows that this condition is fulfilled for a wide
range of temporal and spatial frequencies of the stim-
ulus, both when the inhibitory recursion is turned off
and when it is applied.
The simulations showed that recurrent clustered in-
hibition does indeed elicit the tuning of the neurons
in the V1 layer on specific values of orientation and
spatial frequency. The best results, i.e., the narrowest
tuning curves, are obtained when the size of the re-
current inhibitory clusters and their distance from the
target neuron are both comparable to the width of the
feed-forward excitatory kernel.
Moreover, using recurrent clustered inhibition gives
rise to well-structured Gabor-like RFs with a substan-
tially lower number of synaptic connections than that
Compact Early Vision Signal Analyzers in Neuromorphic Technology
533
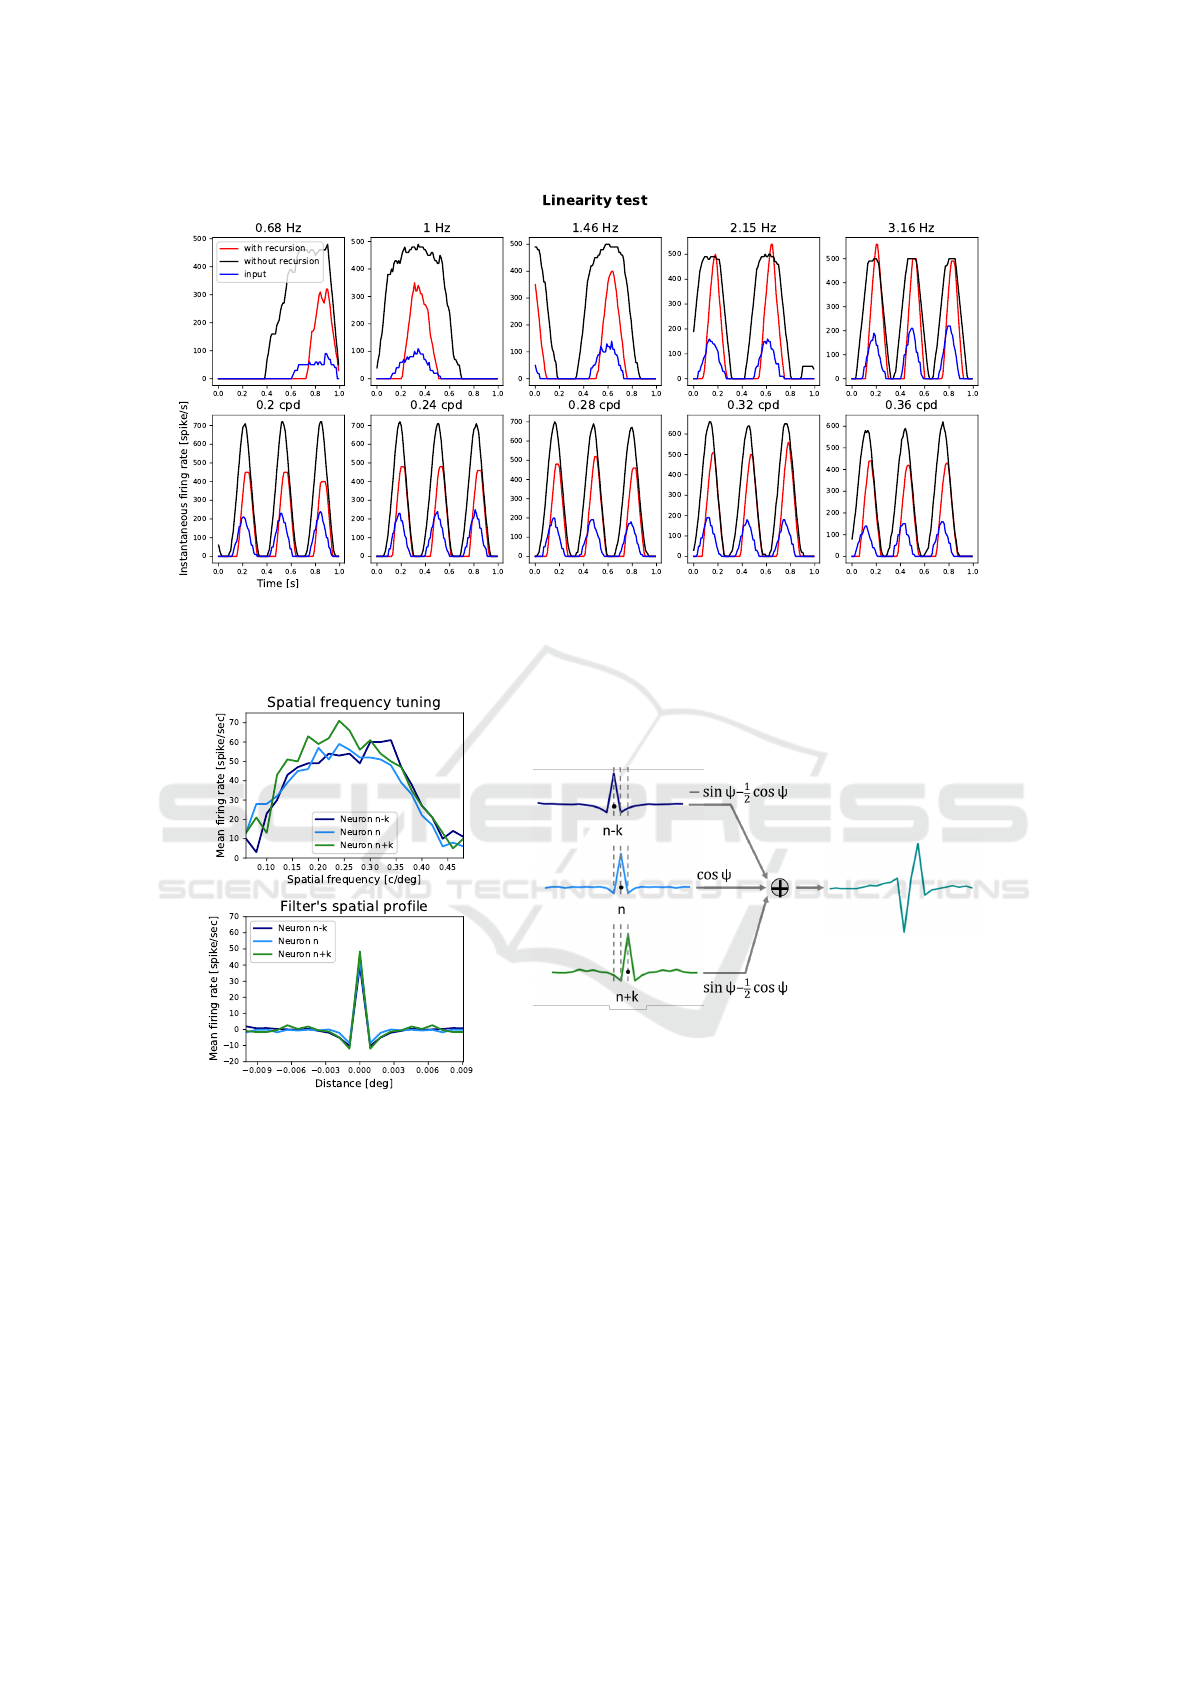
Figure 3: Instantaneous firing rate oscillations during 1s simulation. Black and red curves refer to the central neuron of V1
layer and the blue curve to four sample corresponding afferent neurons of the retina layer. In the first row the response to
moving gratings with spatial frequency of 0.26 c/deg and temporal frequencies that vary as indicated; in the second row the
response to moving gratings with temporal frequency of 3.16 Hz and spatial frequencies that are indicated.
Figure 4: (Left) The spatial frequency tuning curves and their Fourier transforms for three sample neurons of the V1 layer
(central neuron and two nearby neurons at distance d from it). The input grating used to obtain the curves had a temporal
frequency of 3.16 Hz. (Right) The weighted sum of the spatial profiles to obtain a filter with an arbitrary phase value. The
value of k can be chosen as being approximately equal to d.
required when using an exclusively feed-forward ap-
proach. To put this claim in numbers, we can con-
sider a network in which both the feed-forward ker-
nel and the recurrent clusters are 5 neurons wide. In
this case, each neuron of the V1 layer receives 101
afferences. We can compare this result with equiva-
lent networks in which the spatial profile of a V1 neu-
ron’s RF is obtained through exclusively feed-forward
excitatory and inhibitory connections from the retina
layer, defined by sampling a Gabor function whose
central lobe is 5 neurons wide. To obtain RFs with
3 and 5 subregions, 127 and 241 afferences to each
neuron of the V1 layer are required, respectively. Be-
sides, the orientation tuning curves of such neurons
are comparable to the ones of the neurons of the recur-
rent network and the spatial frequency tuning curves
are slightly worse.
VISAPP 2020 - 15th International Conference on Computer Vision Theory and Applications
534
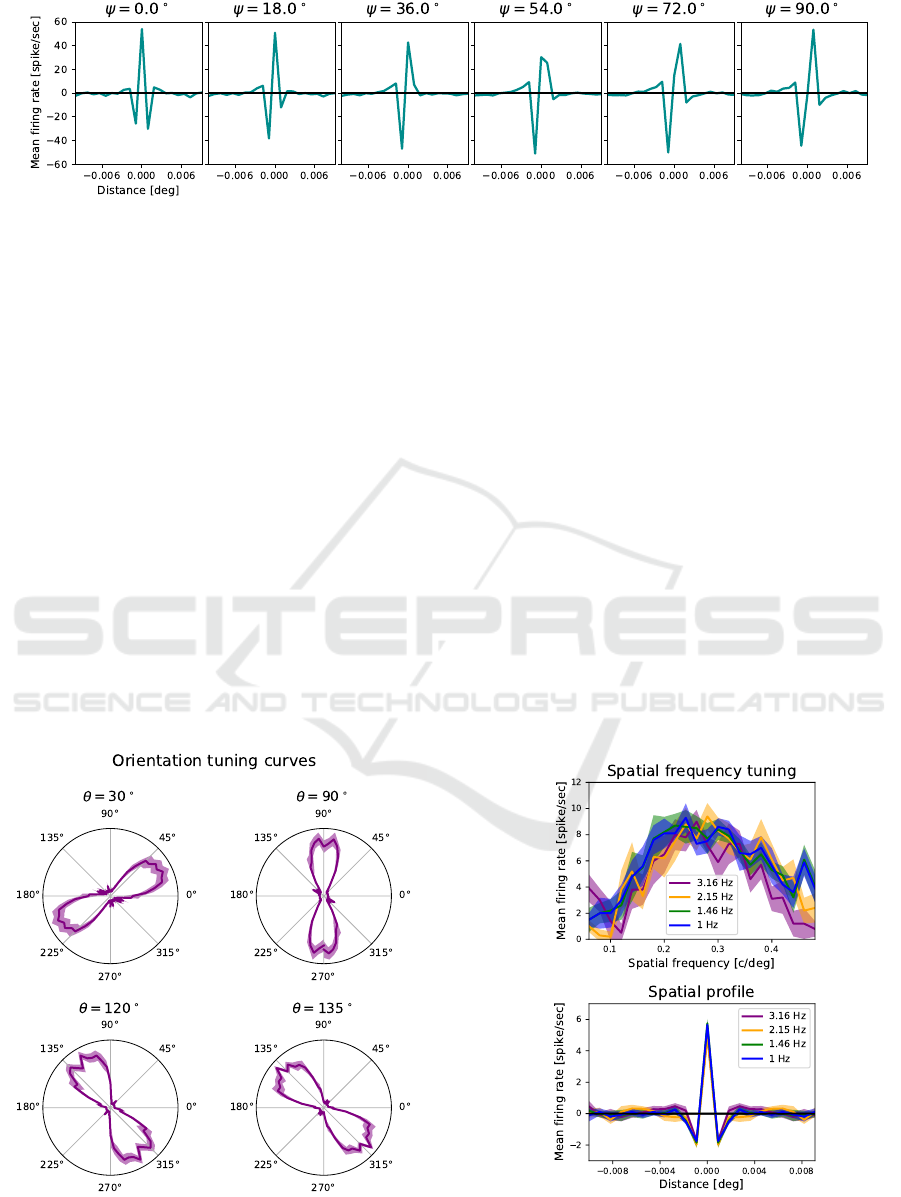
Figure 5: Filters with different phase values resulting from the weighted sum of responses of nearby neurons.
3.2 Spatial Profiles with Arbitrary
Phase Values
As explained before, by linear weighting of neighbor-
ing RFs we can obtain higher-order RF profiles of any
phase. For the sake of clarity, results are shown for
the central 1D cross section of a neuron’s RF. The
left side Fig. 4 shows the spatial frequency tuning
curves and their Fourier transforms for three sample
neurons, placed in central region of the V1 layer. We
observe that the neurons are tuned to a specific spatial
frequency value, and that the filters’ spatial profiles
present a central positive lobe and two negative side-
bands, resembling a Gabor function with even sym-
metry.
The right side of Fig. 4 shows how the weighted sum
of the three RFs yields a resulting profile with a dif-
ferent phase value. Figure 5 showcases a series of re-
sulting spatial profiles obtained with this approach for
phase values ranging from 0
◦
(corresponding to even
symmetry) to 90
◦
(corresponding to odd symmetry).
Figure 6: Examples of orientation tuning curves for differ-
ent values of θ. The input grating had a temporal frequency
of 3.16 Hz.
3.3 Functional Validation
The resulting bank of linear filters can be used as a
minimal and controllable set of operators for extract-
ing early vision features, directly from the spiking
video stream provided by the DVS. Indeed, the spa-
tial structure of the Gabor-like profiles allows us to
aggregate ON and OFF temporal events according to
local oriented band-pass spatial frequency channels,
which are frequently used as front-ends of artificial
vision systems (Dollr et al., 2014) (Luan et al., 2018).
Although several tricks should be considered to effi-
ciently implement a full multichannel representation,
a flavour of the functionality of the proposed network
is presented, for a single scale and four orientation
channels. Figure 8 shows the results for a snapshot
of a DVS recording featuring a moving hand; the pan-
els show the activity of the DVS, the activity of the
retina layer that reproduces ON events as spikes and
the activity of the V1 layer for 4 different values of θ.
Brighter tones indicate higher firing rates. Only the
neurons of the V1 layer whose orientation sensitivity
Figure 7: Spatial frequency tuning curves and their Fourier
transforms for different temporal frequencies of the input
grating.
Compact Early Vision Signal Analyzers in Neuromorphic Technology
535
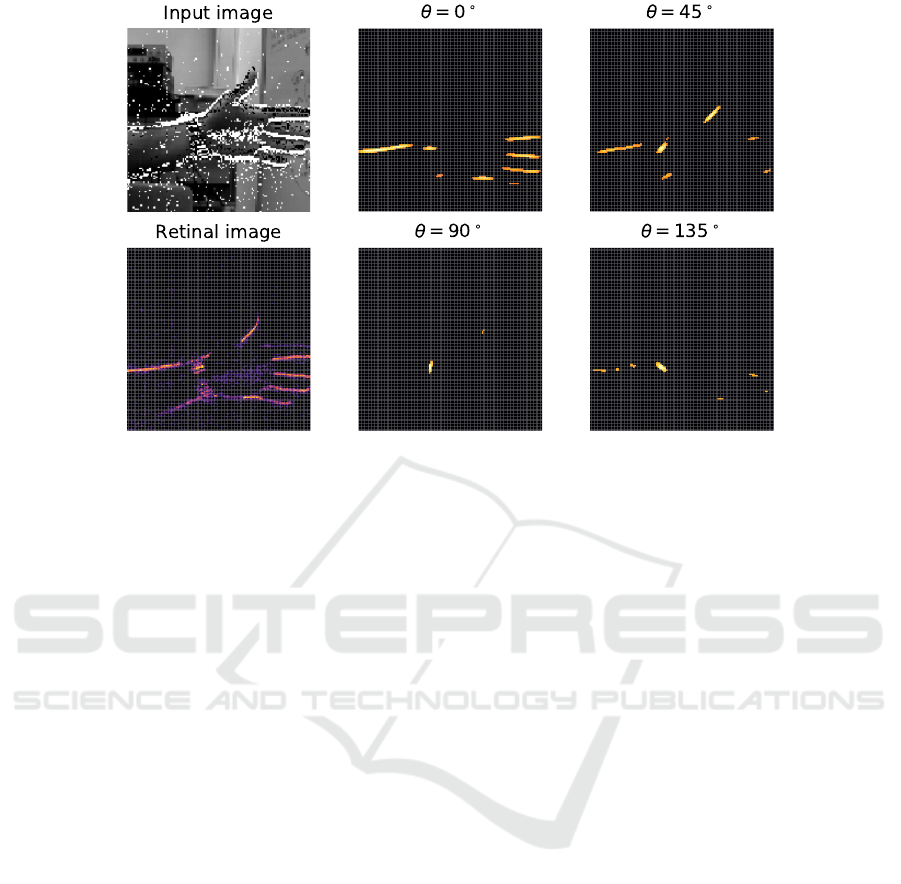
Figure 8: A snapshot of the activity of the DVS, the retina layer and the V1 layer with different preferred orientations for a
real scene. The stream of events generated by the DVS is shown in the input image: ’ON’ and ’OFF’ events are represented
as white and black squares overlaid to the corresponding scene acquired with a regular frame-based camera. Brighter tones
indicate higher firing rates. For the sake of simplicity in the visualization, only the neurons of the V1 layer whose firing
rates were over a certain threshold were represented. Cropped DVS240 recording from DVSFLOW16 dataset (Rueckauer and
Delbruck, 2016).
matches the dominant orientation present in the image
show a high firing rate.
3.4 Network Implementation on Chip
The DYNAP-SE board was programmed to imple-
ment the modified network structure we described
previously. We used one of the 4 chips on the
board, composed of 4 cores with 256 silicon neurons
each. The chip is fabricated using a standard 0.18
um CMOS technology and the neurons and synapses
biophysical behaviors are mimicked through parallel
analog circuits (rather than time-multiplexed digital
ones) which operate in sub-threshold regime to min-
imize the dynamic power consumption and to repro-
duce biologically plausible temporal dynamics. The
computation is asynchronous and the memory ele-
ments (such as capacitors, CAM, and SRAM cells)
are distributed across the computing modules, mak-
ing the chip non Von Neumann. Despite the limita-
tions posed by the hardware, the results in terms of
tuning curves were comparable to the ones obtained
in simulation. Since the behaviour of neurons and
synapses on the DYNAP-SE board is not determinis-
tic due to transistor mismatches, the curves were me-
diated over 10 sessions. Figure 6 shows the polar rep-
resentation of the orientation tuning curves for four
selected values of orientation. The spatial frequency
tuning curves and their Fourier transforms are shown
in Fig. 7; different colors refer to different temporal
frequencies of the gratings used as visual stimuli. It is
worth noting that faster gratings elicit more events on
the DVS and thus higher firing rate of the neurons on
the retina layer, which then project to the relay layer
and finally to the V1 layer. Nevertheless, the curves
obtained for different temporal frequencies overlay:
this is evidence of the fact that the emergence of ON
and OFF subregions in the RF induced by recurrent
inhibition successfully normalizes the firing rate in in-
put.
4 CONCLUSIONS
Neuromorphic systems are a promising alternative
to conventional von Neumann architectures in terms
of power efficiency, computational flexibility, and
robustness. Reproducing the dynamics of biologi-
cal neurons, they represent ideal platforms to im-
plement low-power bio-inspired devices. Here, we
proposed an efficient way to implement spiked-based
early-vision feature detectors on neuromorphic hard-
ware. We took inspiration from the organization of
the retinocortical pathway to obtain silicon neurons
with Gabor-like RFs that are tuned to oriented visual
stimuli with specific spatial frequency bandwidths. To
achieve that goal while keeping the number of synap-
tic connections low, we successfully used recurrent
VISAPP 2020 - 15th International Conference on Computer Vision Theory and Applications
536

clustered inhibition, proving its efficacy in the con-
text of discrete spiking neural networks. We also ver-
ified that the linearity assumption holds despite the
high non-linearity of spiking neurons. Additionally,
we showed how it is possible to combine such fea-
ture detectors to generate filters with arbitrary phase
values, effectively implementing a full harmonic rep-
resentation of the image signal. The harmonic sig-
nal description provided by the proposed neuromor-
phic circuit could be potentially used for a complete
characterization of the 2D local structure of the vi-
sual signal in terms of the phase relationships from all
the available oriented channels. This would pave the
way to the implementation of complex bio-inspired
networks for more demanding on-line visual tasks on
neuromorphic hardware.
ACKNOWLEDGEMENTS
This project has received funding from the European
Research Council under the Grant Agreement No.
724295 (NeuroAgents).
REFERENCES
aiCTX (2018). https://ai-ctx.gitlab.io/ctxctl/primer.html.
Last checked on Nov 20, 2019.
Delbruck (2007). https://github.com/SensorsINI/jaer. Last
checked on Nov 20, 2019.
Dollr, P., Appel, R., Belongie, S., and Perona, P. (2014).
Fast feature pyramids for object detection. IEEE
Transactions on Pattern Analysis and Machine Intel-
ligence, 36(8):1532–1545.
Fleet, D. and Jepson, A. (1993). Stability of phase infor-
mation. IEEE Transactions on Pattern Analysis and
Machine Intelligence, 15(12):1253–1268.
Jones, J. P. and Palmer, L. A. (1987). An evaluation of the
two-dimensional Gabor filter model of simple recep-
tive fields in cat striate cortex. Journal of neurophysi-
ology, 58(6):1233–1258.
Lichtsteiner, P., Posch, C., and Delbruck, T. (2008). A
128x128 120 db 15us latency asynchronous tempo-
ral contrast vision sensor. IEEE journal of solid-state
circuits, 43(2):566–576.
Luan, S., Chen, C., Zhang, B., Han, J., and Liu, J. (2018).
Gabor convolutional networks. IEEE Transactions on
Image Processing, 27(9):4357–4366.
Milde, M., Renner, A., Krause, R., Whatley, A. M., Soli-
nas, S., Zendrikov, D., Risi, N., Rasetto, M., Burelo,
K., and Leite, V. R. C. (2018). teili: A toolbox for
building and testing neural algorithms and computa-
tional primitives using spiking neurons. Unreleased
software, INI, University of Zurich and ETH Zurich.
Moradi, S., Qiao, N., Stefanini, F., and Indiveri, G. (2018).
A scalable multicore architecture with heterogeneous
memory structures for dynamic neuromorphic asyn-
chronous processors (DYNAPs). IEEE transactions
on biomedical circuits and systems, 12(1):106–122.
M
¨
uggler, E., Bartolozzi, C., and Scaramuzza, D. (2017).
Fast event-based corner detection. In Proceedings of
the British Machine Vis. Conf. (BMVC), pages 1–11.
Ogale, A. and Aloimonos, Y. (2007). A roadmap to the inte-
gration of early visual modules. International Journal
of Computer Vision, 72:9–25.
Osswald, M., Ieng, S., Benosman, R., and Indiveri, G.
(2017). A spiking neural network model of 3d percep-
tion for event-based neuromorphic stereo vision sys-
tems. Scientific Report, 7:40703.
Peirce, J., Gray, J. R., Simpson, S., MacAskill, M.,
H
¨
ochenberger, R., Sogo, H., Kastman, E., and Lin-
deløv, J. K. (2019). PsychoPy2: Experiments in
behavior made easy. Behavior Research Methods,
51(1):195–203.
Raffo, L., Sabatini, S. P., Bo, G. M., and Bisio, G. M.
(1998). Analog VLSI circuits as physical structures
for perception in early visual tasks. IEEE Transac-
tions on Neural Networks, 9(6):1483–1494.
Rueckauer, B. and Delbruck, T. (2016). Evaluation of event-
based algorithms for optical flow with ground-truth
from inertial measurement sensor. Frontiers in neu-
roscience, 10:176.
Sabatini, S. P. (1996). Recurrent inhibition and clus-
tered connectivity as a basis for Gabor-like receptive
fields in the visual cortex. Biological cybernetics,
74(3):189–202.
Sabatini, S. P., Gastaldi, G., Solari, F., Pauwels, K., Hulle,
M. M. V., Diaz, J., Ros, E., Pugeault, N., and Krger,
N. (2010). A compact harmonic code for early vision
based on anisotropic frequency channels. Computer
Vision and Image Understanding, 114(6):681 – 699.
Stimberg, M., Brette, R., and Goodman, D. (2019). Brian
2: an intuitive and efficient neural simulator. BioRxiv,
page 595710.
Compact Early Vision Signal Analyzers in Neuromorphic Technology
537
