
Multi-level Distributed Intrusion Detection System for an IoT based
Smart Home Environment
Simone Facchini
1
, Giacomo Giorgi
2
, Andrea Saracino
2
and Gianluca Dini
1
1
Dipartimento di Ingegneria dell’Informazione, University of Pisa, Italy
2
Istituto di Informatica e Telematica, Consiglio Nazionale delle Ricerche, Pisa, Italy
Keywords:
Smart Home Environment, Intrusion Detection System, Machine Learning, Distributed Systems.
Abstract:
This paper proposes a novel multi-level Distributed Intrusion Detection System in a Smart Home environment.
The proposed approach aims to detect unexpected behaviors of a network component by exploiting the collab-
oration between the different IoT devices. The problem has been addressed by implementing an architecture
based on a distributed hash table (DHT) that allows sharing network and system information between nodes.
A distributed Intrusion Detection System, located in each node of the network, represents the core component
to detect malicious behavior. The proposed Intrusion Detection system implements a binary classifier, based
on a machine learning mechanism, which analyzes, in a novel way, the aggregation of features extracted from
data coming from kernel, network and DHT level. In this work we present our idea with some preliminary
experiments performed in order to compare different classifiers results on this kind of data with respect to a
specific malicious behavior.
1 INTRODUCTION
The proliferation of smart devices and the introduc-
tion of the Internet of Things (IoT) paradigm have
played a significant role in the creation of smart envi-
ronments. According to the research report from the
IoT analyst firm Berg Insight
1
, the number of smart
homes in Europe and North America reached 64 mil-
lion in 2018 and they estimate that more than 60.3
million homes in North America will be smart by
2023 (41% of all homes in the region). A Smart home
environment automatizes the entire home. Therefore
it provides services to everyday activities for better
quality living, such as sophisticated control of en-
ergy, higher security against break-ins, innovations
in home entertainment, health monitoring, and inde-
pendent/assisted living arrangements. Smart devices
can include appliances like refrigerators, washing ma-
chines, dryers, heating and air conditioning units,
lighting service, and surveillance cameras. The in-
creased deployment of such smart devices has led to
an increase in potential security risks. Hackers’ in-
terest is strongly dependent on the diffusion of the
technology they are going to break, clearly because
1
http://www.berginsight.com/ReportPDF/ProductSheet/
bi-sh5-ps.pdf
if a vulnerability is found on a widespread device,
the opportunity to exploit it is more significant, and
so is the reward. Therefore together with the growth
of diffusion, the need of security for Smart Homes is
quickly increasing. On the other hand, most of the
smart home devices have just a few (if any) security
features, and only one security hole in one device can
lead to the compromise of the entire network, despite
reasonable security measures. Moreover, these smart
devices are rarely updated, even if the producer makes
available patches for a known vulnerability. Since the
interconnected devices have a direct impact on the
user’s lives, there is a need for a well-defined security
threat classification and a proper security infrastruc-
ture with new systems and protocols that can enforce
privacy, data integrity, and availability in IoT. The pa-
per introduces a Distributed Intrusion Detection Sys-
tem for Smart Homes capable of detecting unexpected
behaviors of a component by exploiting the collab-
oration between the different IoT devices, either to
fix it or, in the worst case, to exclude the compro-
mised node from the network. The essential compo-
nent of this IDS will be a machine learning classifier
that makes use of multi-level data collected from the
system to detect as fast as possible every anomaly in
the behavior of a node. The main contributions of the
work presented in this paper are: (i) the implemen-
Facchini, S., Giorgi, G., Saracino, A. and Dini, G.
Multi-level Distributed Intrusion Detection System for an IoT based Smart Home Environment.
DOI: 10.5220/0009170807050712
In Proceedings of the 6th International Conference on Information Systems Security and Privacy (ICISSP 2020), pages 705-712
ISBN: 978-989-758-399-5; ISSN: 2184-4356
Copyright
c
2022 by SCITEPRESS – Science and Technology Publications, Lda. All rights reserved
705

tation of a distributed IoT environment, (ii) data col-
lection and features extraction of anomalous and nor-
mal system behavior, (iii) preliminary experiments on
a multi-level IDS exploiting machine learning tech-
niques. The paper is organized as follows. In Section
2 is presented the literature works related to the In-
trusion Detection System in IoT. Section 3 provides
a description of the smart home scenario and the at-
tacking model proposed. Section 4 describes the over-
all system architecture, detailing each component. In
Section 5 listed in Table 3 the implementation details.
Section 6 provides the preliminary results obtained.
Finally in Section 7 the concluding remark and the
possible future work are discussed.
2 RELATED WORK
Several approaches for the Intrusion Detection Sys-
tems in IoT ecosystem have been proposed in litera-
ture. As reported in (Scarfone and Mell, 2012), bas-
ing on the method applied to detect the intrusion, the
IDSs can be classified respectively in misuse-based
or anomaly-based. Misuse-based techniques are de-
signed to detect known attacks by using signatures
of those attacks. (da Silva et al., 2005) proposed a
distributed IDS on a Wireless Sensor Network based
on a defined number of rules. (Oh et al., 2014) pro-
posed a distributed signature-based lightweight IDS,
defining an algorithm to match attack signatures and
packet payloads. If any system or network activ-
ity matches with stored patterns/signatures, then an
alert will be triggered. The main disadvantage of the
misuse-based IDS is the request of frequent manual
updates of the database with rules and signatures. The
growth of computational intelligence has brought ma-
jor advantages in developing anomaly-based IDS. Its
aim is to model the normal system behavior, identi-
fying anomalies as deviations from learned behavior.
The idea of (Gupta et al., 2013) is to apply Compu-
tational Intelligence algorithms to build normal be-
haviour profiles for network devices. For each dif-
ferent IP address assigned to a device, there would be
a distinct normal behaviour profile. In (Mirsky et al.,
2018) is proposed an online network IDS based on au-
toencoder trained in an unsupervised way. In (Buczak
and Guven, 2016) the authors collect different data
mining and machine learning techniques adopted for
cyber security intrusion detection. Although the ma-
jority of IDSs in IoT are focused on the network
flow analysis, other works proposed host-based IDS
based on system analysis. (Mudgerikar et al., 2019)
presents an host-based anomaly detection system for
IoT devices in which collecting system-level informa-
tion, like running process parameters and their system
calls, in an autonomous, efficient, and scalable man-
ner, detects anomalous behaviors. To the best of our
knowledge, there are no works that combine network
data sources and system-level information to detect
intrusion in IoT ecosystem.
3 CASE STUDY
Our scenario consists in a common Smart Home en-
vironment composed by two basic kind of devices:
smart devices and what we call ”not-so-smart” de-
vices. The first ones are all the devices that run
an almost complete Operating System (e.g. Android
Things) that basically allows the user to install third-
party programs and components and have not very
limited resources like computing power and battery.
The so-called not-so-smart devices instead are those
that run a very simple operating system and only
pre-installed and/or proprietary software, allowing the
user just to use predefined applications. This distinc-
tion is needed because the idea is to implement an ar-
chitecture in which smart devices store and maintain
data and communication between them, and each one
of them is responsible for a certain number of not-so-
smart devices, which instead communicate only with
the corresponding smart device.
3.1 Threat Model
In our scenario we consider that one of the smart de-
vices in the system could be compromised. Compro-
mised means that has been subjected to an intrusion
so could have, for example, a malware installed, or an
attacker could have gained access to a remote com-
mand interface through which he can execute com-
mands on the device. An intrusion can impact on dif-
ferent security properties such as confidentiality, in
case the attacker’s objective is to steal private infor-
mation; moreover the attacker could perform a Denial
of Service (DoS) attack on other nodes of the sys-
tem, affecting system availability; another possibility
is that the attacker affects data integrity, sending to the
other nodes false information.
4 METHODOLOGY
In this section the overall system architecture is pre-
sented. After a system overview, we describe the main
components.
ICISSP 2020 - 6th International Conference on Information Systems Security and Privacy
706

4.1 System Overview
Our architecture is composed by a certain number of
smart devices like Smart TV, Smart Speakers (e.g.
Google Home, Amazon Echo), Smart Fridge and so
on. Every smart device is responsible for a certain
number of not-so-smart devices like, for example,
temperature sensors spread all over the house used
by smart heating system. Smart devices are intercon-
nected through a common home network, communi-
cate and share application data on a Distributed Hash
Table (DHT) and are forced to put periodically data
related to their behavior. Time is ideally divided into
slots of pre-defined and constant duration: at the end
of each slot every node puts on the DHT data that
itself collected which summarize its behavior. Each
smart node contains an Intrusion Detection System
agent which examines the behavior of the other nodes
analyzing it on three different levels: kernel, network
and DHT. A reputation system is integrated in the dis-
tributed network. When a node detects a suspicious
activity, it collaborates to assign to the responsible
node a low reputation level and eventually starts a
procedure to exclude the compromised node from the
network. Figure 1 shows the overall architecture.
4.2 Distributed Architecture
The proposed smart home architecture adopts a peer-
to-peer (P2P) approach that exploits a Distributed
Hash Table (DHT) indexing scheme to organize the
smart home network nodes. DHT provides a lookup
service similar to a hash table. Pairs of (key, value) are
stored locally on a certain number of nodes and any
participating node can efficiently retrieve the value as-
sociated with a given key without the need to know
the node on which it is actually stored. Keys are
unique identifiers which map to particular values,
which in turn can be anything from addresses to doc-
uments, to arbitrary data (Stoica et al., 2001). Ex-
ploiting a P2P network, the intrusion information are
distributed among all network nodes (smart devices),
which contain their own IDS agent. Such distribu-
tion allows to analyze the behavior under different
viewpoints increasing, thus, the chance to detect the
anomaly.
4.3 Multi-level Intrusion Detection
System
The Intrusion Detection System (IDS) is integrated
in every smart node of the network. It is based on a
features extraction component and a binary machine
Table 1: A feature vector representation, network features
are grouped for space reason.
1
: Two distincts: one for back-
ward and one for forward direction.
2
: Four distincts: mini-
mum, mean, maximum and standard deviation.
Data Level Feature Group Feature Description
Kernel
switch Context switch
read Read from a file descriptor
mprotect Set protection on a region of memory
mmap2 Map files into memory
close Close a file descriptor
openat Open and possibly create a file
fstat64 Get a file status
futex Fast user-space locking
rt sigaction Examine and change a signal action
procinfo Get system processes information
stat64 Get a file status
fcntl Manipulate file descriptor
getdents64 Get directory entries
brk Change data segment size
newselect Synchronous I/O multiplexing
write Write to a file descriptor
uname Get name and information about current kernel
pipe Create pipe
Network
total packets
1
Total packets
total volume
1
Total bytes
pktl
12
Packets size
lat
12
Amount of time between two packets
duration Duration of the flow
active
2
Amount of time flow was active
idle Amount of time flow was idle
sflow packets
1
Number of packets in a sub flow
sflow bytes
1
Number of bytes in a sub flow
psh cnt
1
Number of times the PSH flag was set
urg cnt
1
Number of times the URG flag was set
total hlen
1
Total bytes used for headers
DHT
GET Number of GET operation performed on the DHT
PUT Number of PUT operation performed on the DHT
learning classifier able to distinguish normal and ma-
licious node behavior from the features extracted. The
features extraction component models the node be-
havior considering multiple abstraction layers corre-
sponding to kernel, network and DHT. The network
data extracted are related to the data information of
the packets exchanged between smart nodes. The net-
work traffic is used to identify unusual traffic flows.
To better characterize the node behavior the classifier
considers data collected at DHT level which repre-
sents the number and type of operations performed
by nodes on the DHT. Finally, data collected at ker-
nel level are related to a list of number of system
calls that summarize the device internal behavior. The
complete list of the features extracted and used by
the classifier is shown in Table 1. The overall fea-
tures extracted at different abstraction level provide a
complete behavioral characterization useful to detect
multiple types of malicious intrusion that can attack a
node on different layer.
4.4 Reputation Mechanism
To determine the behavior of a node, a reputation
mechanism is needed. If a specific node, analyzing
the information shared in the DHT, detects malicious
behavior of a node, it puts on the DHT a resource
containing that information to invite other nodes to
exclude it from the network. At the same time, we
Multi-level Distributed Intrusion Detection System for an IoT based Smart Home Environment
707

Internet
IDS
IDS
IDS
IDS
Network
Kernel
IDS
P2P Network
(DHT)
Application
Figure 1: Distributed Intrusion Detection System.
can not allow a malicious node to exclude benign
nodes declaring such nodes as malicious when they
are not. To this end, a distributed reputation mech-
anism is needed to assign, in a cooperative way, a
reputation score. If a node detects a malicious be-
havior coming from a node, it asks the other nodes its
reputation value and updates it to decrease the repu-
tation level. When a node finds on the DHT an en-
try declaring a malicious node, it evaluates the trust
of that entry, relying on the confidence of the node
that put that resource on the DHT. An example of a
reputation mechanism that could be adopted in our
system is described in (Faiella et al., 2016). In the pa-
per the authors presented models and algorithms for
a distributed reputation system with fine-grained trust
modeling.
5 IMPLEMENTATION
In this section we describe the implementation de-
tails of the entire distributed system, how data used
for the experiments was collected and a description of
the classifiers used.
5.1 Distributed Hash Table
The protocol we are going to use in order to store and
share data is Kademlia (Maymounkov and Mazi
`
eres,
2002), which is one of the most popular peer-to-peer
(P2P) Distributed Hash Table (DHT). Kademlia pro-
vides many desirable features that are not simultane-
ously offered by any other DHT. These include: min-
imization of the number of inter-node introduction
messages; configuration information such as nodes
on the network and neighboring nodes spread au-
tomatically as a side effect of key lookups; nodes
are knowledgeable of other nodes, allowing routing
queries through low latency paths. Kademlia uses
keys to identify both nodes and data on the Kademlia
network. Keys are opaque, 160-bit quantities. Partic-
ipating nodes each have a key, called NodeId, in the
160-bit key-space. Since Kademlia stores content in
the form of (key, value) pairs, each data on the DHT
is also uniquely identified by a key in the 160-bit key-
space. We used an already developed Java implemen-
tation of Kademlia: an Open Source project
2
, which
contains all the Kademlia basic features we are inter-
ested in. On top of it, we defined an application that
exploits the DHT provided and managed by Kadem-
lia.
5.2 Simulation Environment
To gather useful data for the machine learning classi-
fiers used, we built up a simulation environment using
three RaspberryPi 2 Model B, which are small single-
board computers with a quad-core ARM Cortex-A7
CPU and 1 GB of RAM. Each RaspberryPi stands
for a smart device and communicate with each other
through an Ethernet network switch. In our simula-
tion environment, each smart node manages a cer-
tain number of not-so-smart devices distributed in dif-
ferent rooms. The not-so-smart devices considered
are represented by temperature and motion sensors.
The motion sensor registers the entrances/exits in the
rooms, sending values to the smart node when the ac-
tion occurs, while the temperature sensor periodically
sends its updates. Data are maintained on the DHT
to share the information with the other nodes. To per-
form our analysis we needed both data extracted dur-
2
https://github.com/JoshuaKissoon/Kademlia
ICISSP 2020 - 6th International Conference on Information Systems Security and Privacy
708

ing system normal behavior, and data extracted from
system behavior when one of the nodes has been com-
promised. In order to simulate a normal behavior, en-
trances/exits and temperature changes are simulated
through random values generated by the Java pro-
gram. Each node periodically performs random ac-
tion (selected between room entrance or exit registra-
tion, temperature value update, or temperature value
requests) at a random time instance extracted from a
specific interval. To simulate a compromised node,
we installed on one of the RaspberryPi representing
a smart node Mirai malware. Mirai is a worm-like
family of malware that infects IoT devices and cor-
rals them into a DDoS botnet (Antonakakis et al.,
2017). A mirai-infected device, even without receiv-
ing an explicit attack command by its CnC, periodi-
cally scans the network and tries to infect other reach-
able devices, generating network traffic and altering
the normal device behavior. When Mirai identifies
a potential victim, it enters into a brute-force login
phase in which it attempts to establish a Telnet or
SSH connection using username and password pairs
selected randomly from a list. The list of normal and
malicious actions is summarized in Table 2.
Table 2: Normal/Malicious behavior actions.
Action Description Actor Behavior
GET temperature Temperature value request
Temperature
Sensor
Normal
PUT temperature Temperature value update
Temperature
Sensor
Normal
PUT Entrance Person room entrance
Motion
Sensor
Normal
PUT Exit Person room exit
Motion
Sensor
Normal
SSH/Telnet Connection
Telnet or SSH connection
using username and password
Mirai Malicious
5.3 Data Collection
As mentioned in 4.1, time is slotted. Every kind of
collected data is referred to a specific time slot. Dur-
ing the collection phase, in each slot we collect kernel,
network, and DHT data. To gather kernel-level data
from our simulation devices, we used sysdig (Draios,
): a tool for deep system visibility used to capture
system calls and other OS events. The network-level
data are captured using Wireshark(Wireshark, ): a
free and open-source packet analyzer that allows stor-
ing network-related data in a specific file format. Fi-
nally, the DHT-level data are collected at the end of
each time slot when every node puts on the DHT a re-
source containing all the operations (GET and PUT)
performed by that node on the DHT. We performed
five collection campaigns using 5, 10, 15, 20, and 30
seconds time slot. In each time slot, we collected data
both related to the compromised node and the other
nodes. We labeled each action as malicious or nor-
mal behavior with respect to the node on which it oc-
curred. For each time slot configuration we performed
three hours simulation without an infected node in
the system and three hours simulation with one of the
smart nodes infected by Mirai malware.
5.3.1 Features Extraction
For each time slot we extracted the following files: a
.pcap file containing all network data; a .sys file con-
taining the system calls performed by the node and a
.log file representing all the operations performed by
the node on the DHT. A features engineering phase
has been applied to the network-level data to extract
the main features used to describe the network flow.
To this end, a network feature extractor publicly avail-
able on
3
has been used. It extracts a vector for each
network flow (sequence of packets from a source to
a destination node) found in the pcap file collected,
containing all the network features described in Table
1. As features at kernel level, we considered the num-
ber of system calls executed during the system oper-
ations. The list of system calls selected is a sublist
of the overall system calls chosen as representative
of normal and malicious behavior. Finally, at DHT-
level, we extracted the number of GET and PUT op-
erations performed. The total amount of features ex-
tracted by the three levels is 60: 18 for kernel level,
40 for network-level, and 2 for DHT level.
5.4 Classifiers
The IDS implementation has been tested using dif-
ferent machine learning algorithms. As a preliminary
test, we considered traditional machine learning clas-
sifiers suitable for our problem. As described in Sec-
tion 5, we considered a vector of numerical features
extracted from the network flow, kernel, and DHT
level in a single time slot. Each vector is labeled
with a categorical label that identifies normal and ma-
licious behavior. Because of the data structure and the
categorical problem to solve, we selected seven states
of the art machine learning classifier, listed in Table
3, suitable for this classification problem.
6 EXPERIMENTS
To train our classifiers, we divided the dataset ran-
domly, taking 80% of the samples for training and
the remaining 20% for testing. For each classifier, in
order to evaluate classification accuracy, we applied
3
https://github.com/DanielArndt/flowtbag
Multi-level Distributed Intrusion Detection System for an IoT based Smart Home Environment
709
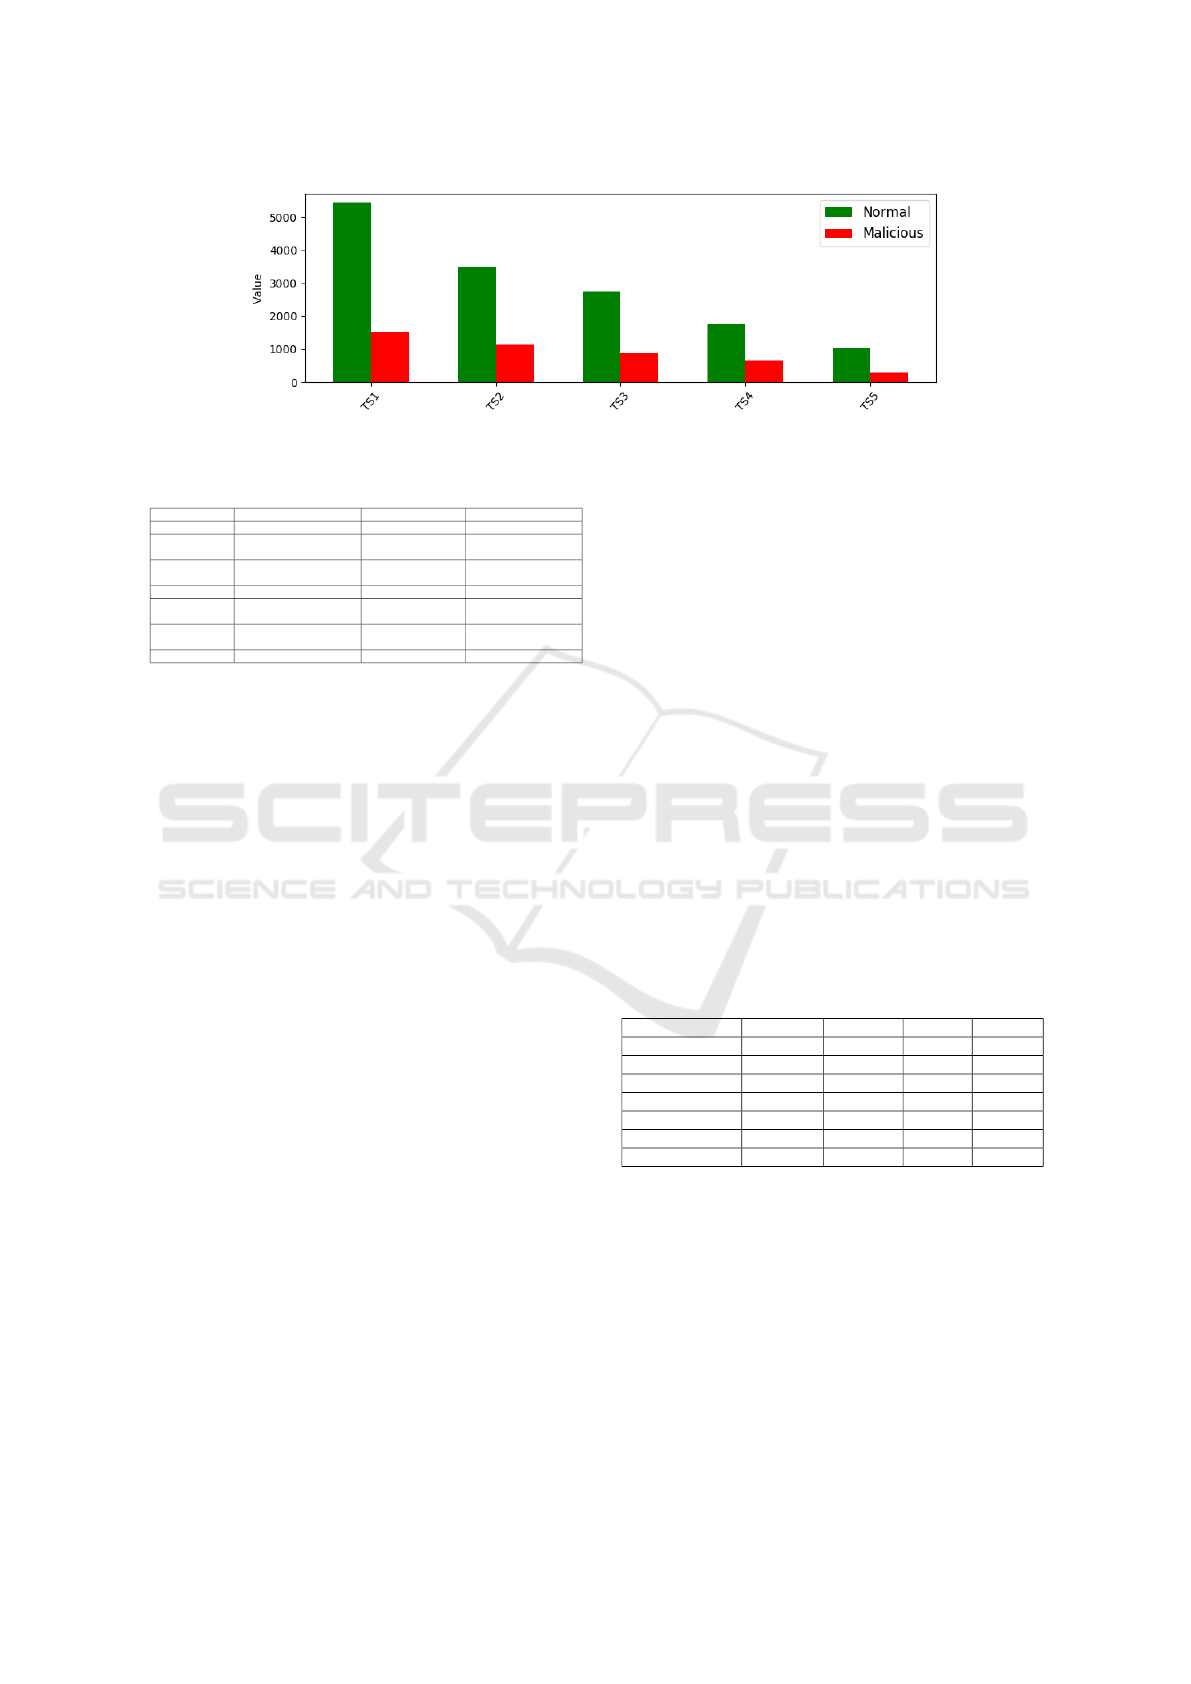
Figure 2: Number of collected samples for each configuration.
Table 3: Classifiers.
Classifier Advantages Disadvantages Reference
Neural Network Online learning Large training data (Haykin, 1994)
KNN
Few hyperparameters
to tune
Slow computation
in Real time
(Dasarathy, 1991)
Decision Tree
Handles colinearity
between features
No online learning (Quinlan, 1986)
Random Forest Random Tree Ensemble No online learning (Ho, 1995)
SVM Handles outliers
Handles only
independent features
(Suykens et al., 1999)
Naive Bayes Few training data
Handles only
independent features
(Rish et al., 2001)
AdaBoost Boosting ensemble model No online learning (Schapire and E., 2013)
10-fold cross-validation: the original sample has been
randomly partitioned into ten equal-sized subsamples.
One of the subsamples is retained as the validation
data to test the model, and the remaining nine have
been used as training data. The process is repeated ten
times, with each of the subsamples used exactly once
as validation data. To check our hypotesis, we per-
formed the following experiments: (i) Time slot ex-
periment: we trained the classifiers on each time slot
datasets gathered to find the best trade-off between the
classifier goodness and the intrusion detection time.
The aim is to predict the intrusion as soon as possible,
minimizing the false positive rate. (ii) Features ag-
gregation: we experimented the classifiers consider-
ing different features level aggregation (starting from
a single-level features classifier until the three-level
features classifier) to check the benefits of a multi-
level IDS.
6.1 Collected Data
As explained in Section 5, we run different simula-
tions varying time slot duration in order to find the
correct value for this parameter.
Figure 2 shows the number of normal and mali-
cious features vectors collected during the gathering
phase. The time slots considered are TS1 (5 seconds),
TS2 (10 seconds), TS3 (15 seconds), TS4 (20 sec-
onds), and TS5 (30 seconds), while the gathering time
is the same for every time slot. In every configuration,
the number of normal features vectors is higher than
the number of malicious ones since we assumed one
single node compromised.
6.2 Classifiers Results
First of all we need to find a good trade-off between
classifiers performances in terms of properly classi-
fied samples and time slot duration. We want time
slot window to be as short as possible in order to mini-
mize the time needed to detect an intrusion. To make a
comparison among the results obtained we trained all
classifiers with the same number of samples, i.e. the
one obtained for the TS5 simulation, shown in Fig.
2. According to Fig. 4, we can state that with TS2
results are better than those obtained with TS1. The
comparison among TS2 configuration and the others
(TS3, TS4 and TS5), instead, shows that there are not
great benefits in using bigger time slots, at least for the
best classifiers. Because of this we chose TS2 (time
slot duration of 10 seconds) to perform further analy-
sis. All the experiments that will be shown from now
on are referred to this configuration. For the selected
Table 4: Results.
Classifier Accuracy Precision Recall f1-score
MLP 97.69% 97.28% 97.09% 97.13%
KNN 96.86% 96.39% 96.21% 96.24%
Decision Tree 98.01% 98.94% 98.89% 98.90%
Random Forests 98.56% 98.94% 98.89% 98.90%
SVM 97.24% 97.43% 97.32% 97.35%
NBG 96.63% 97.13% 97.14% 97.13%
AdaBoost 99.39% 99.36% 99.33% 99.38%
time slot duration, we show in Table 4 detailed results
obtained for each machine learning classifier.
In Fig. 3 we show a comparison between results
obtained considering separately the three kinds of fea-
tures used (kernel, network and dht) with respect to
the results obtained considering all the features.
6.3 Discussion
As reported in Figure 3, the classification accuracy is
strongly dependent on kernel-level features, i.e., num-
ICISSP 2020 - 6th International Conference on Information Systems Security and Privacy
710
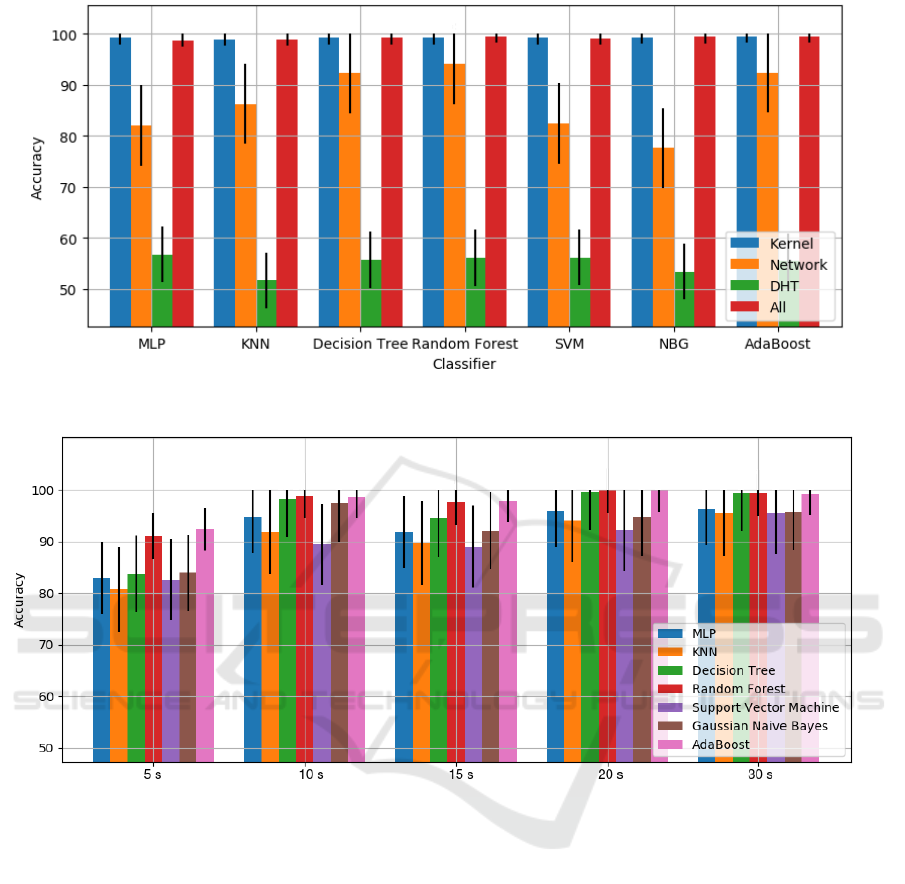
Figure 3: Classifiers results obtained for different features.
Figure 4: Classifiers results obtained for different time slots.
ber and kind of system call performed by smart nodes.
This is because the Mirai behavior, when the infected
device scans the network looking for other potential
victims, is more evident at kernel-level. Despite this,
considering all the features could be important to deal
with different kinds of malware (or misbehavior in
general) that could be more or less evident in different
levels, i.e., DDos, which can be accurately detected
analyzing network data. Considering the time slot ex-
periment, Figure 4 shows that using a short time slot
size (TS1 5 seconds), the feature vectors considered
are not enough representative for the classification be-
tween normal and malicious behavior.
7 CONCLUSIONS
We faced the problem of intrusion detection in a
smart-home environment. We proposed an architec-
ture based on a Distributed Hash Table and a multi-
level distributed Intrusion Detection System, which
analyzes features extracted from three different lay-
ers. We built a simulation environment through which
we collected a labeled dataset composed by normal
and malicious behaviors. We compared different ma-
chine learning approaches considering different fea-
tures dataset corresponding to distinct time slot sizes
and different features aggregation. As future work we
plan to add different attacks on real IoT devices to re-
mark the advantage of using a multi-level IDS.
Multi-level Distributed Intrusion Detection System for an IoT based Smart Home Environment
711

ACKNOWLEDGEMENTS
This work has been partially supported by H2020
EU-funded projects SPARTA, GA 830892 and EIT-
Digital Project HII, PRIN Governing Adaptive.
REFERENCES
Antonakakis, M., April, T., Bailey, M., Bernhard, M.,
Bursztein, E., Cochran, J., Durumeric, Z., Halderman,
J. A., Invernizzi, L., Kallitsis, M., Kumar, D., Lever,
C., Ma, Z., Mason, J., Menscher, D., Seaman, C., Sul-
livan, N., Thomas, K., and Zhou, Y. (2017). Under-
standing the mirai botnet. In 26th USENIX Security
Symposium (USENIX Security 17), pages 1093–1110.
USENIX Association.
Buczak, A. L. and Guven, E. (2016). A survey of data min-
ing and machine learning methods for cyber security
intrusion detection. IEEE Communications Surveys
Tutorials.
da Silva, A. P. R., Martins, M. H., Rocha, B. P., Loureiro,
A. A., Ruiz, L. B., and Wong, H. C. (2005). Decentral-
ized intrusion detection in wireless sensor networks.
In Proceedings of the 1st ACM international workshop
on Quality of service & security in wireless and mo-
bile networks, pages 16–23. ACM.
Dasarathy, B. V. (1991). Nearest neighbor (nn) norms: Nn
pattern classification techniques. IEEE Computer So-
ciety Tutorial.
Draios. Sysdig: Linux system exploration and troubleshoot-
ing tool with first class support for containers.
Faiella, M., Martinelli, F., Mori, P., Saracino, A., and
Sheikhalishahi, M. (2016). Collaborative attribute re-
trieval in environment with faulty attribute managers.
In 11th International Conference on Availability, Re-
liability and Security, ARES 2016, Salzburg, Austria,
August 31 - September 2, 2016, pages 296–303.
Gupta, A., Pandey, O. J., Shukla, M., Dadhich, A., Mathur,
S., and Ingle, A. (2013). Computational intelligence
based intrusion detection systems for wireless com-
munication and pervasive computing networks. IEEE
International Conference on Computational Intelli-
gence and Computing Research, pages 1–7.
Haykin, S. (1994). Neural networks: a comprehensive foun-
dation. Prentice Hall PTR.
Ho, T. K. (1995). Random decision forests. In Proceedings
of 3rd international conference on document analysis
and recognition, volume 1, pages 278–282. IEEE.
Maymounkov, P. and Mazi
`
eres, D. (2002). Kademlia: A
peer-to-peer information system based on the xor met-
ric. IPTPS 2002: Peer-to-Peer Systems, 2429:53–65.
Mirsky, Y., Doitshman, T., Elovici, Y., and Shabtai, A.
(2018). Kitsune: An ensemble of autoencoders for
online network intrusion detection.
Mudgerikar, A., Sharma, P., and Bertino, E. (2019). E-
spion: A system-level intrusion detection system for
iot devices. In Proceedings of the 2019 ACM Asia
Conference on Computer and Communications Secu-
rity, pages 493–500. ACM.
Oh, D., Kim, D., and Ro, W. (2014). A malicious pat-
tern detection engine for embedded securitysystems
in the internet of things. Sensors (Basel, Switzerland),
14:24188–24211.
Quinlan, J. R. (1986). Induction of decision trees. Machine
learning, 1(1):81–106.
Rish, I. et al. (2001). An empirical study of the naive bayes
classifier. In IJCAI 2001 workshop on empirical meth-
ods in artificial intelligence, volume 3, pages 41–46.
Scarfone, K. and Mell, P. (2012). Guide to intrusion detec-
tion and prevention systems (idps). Technical report,
National Institute of Standards and Technology.
Schapire and E., R. (2013). Explaining AdaBoost, pages
37–52. Springer Berlin Heidelberg.
Stoica, I., Morris, R., Karger, D., Kaashoek, M. F., and Bal-
akrishnan, H. (2001). Chord: A scalable peer-to-peer
lookup service for internet applications. Conference
on Applications, technologies, architectures, and pro-
tocols for computer communications, pages 149–160.
Suykens, J., Lukas, L., Van Dooren, P., De Moor, B., Van-
dewalle, J., et al. (1999). Least squares support vector
machine classifiers: a large scale algorithm. In Euro-
pean Conference on Circuit Theory and Design, EC-
CTD, volume 99, pages 839–842. Citeseer.
Wireshark. Wireshark - go deep.
ICISSP 2020 - 6th International Conference on Information Systems Security and Privacy
712
