
New Anomaly Detection in Semiconductor Manufacturing Process
using Oversampling Method
Seunghwan Song and Jun-Geol Baek
School of Industrial Management Engineering, Korea University, 145 Anam-ro, Seongbuk-gu,
Seoul, 02841, Republic of Korea
Keywords: Semiconductor Manufacturing Process, Anomaly Detection, Autoencoder, Latent Space, Wasserstein
Generative Adversarial Networks.
Abstract: Quality in the semiconductor manufacturing process, consisting of various production systems, leads to
economic factors, which necessitates sophisticated abnormal detection. However, since the semiconductor
manufacturing process has many sensors, there is a problem with the curse of dimensionality. It also has a
high imbalance ratio, which creates a classification model that is skewed to multiple class, thus reducing the
class classification performance of a minority class, which makes it difficult to detect anomalies. Therefore,
this paper proposes AEWGAN (Autoencoder Wasserstein General Advertising Networks), a method for
efficient anomaly detection in semiconductor manufacturing processes with high-dimensional imbalanced
data. First, learn autoencoder with normal data. Abnormal data is oversampled using WGAN (Wasserstein
General Additional Networks). Then, efficient anomaly detection within the potential is carried out through
the previously learned autoencoder. Experiments on wafer data were applied to verify performance, and of
the various methods, AEWGAN was found to have excellent performance in abnormal detection.
1 INTRODUCTION
Due to the influence of the recent fourth industrial
revolution, the way of production in manufacturing is
gradually being automated in digital way. In
particular, the semiconductor manufacturing process
is a very complex structure, and various production
systems exist. Various sensor data are generated in
real time from these automated production systems
(Cen et al., 2017).
System failures in production systems affect the
entire process and result in economic losses to the
business. Therefore, sophisticated anomaly detection
technology for sensor data is required. However, the
semiconductor manufacturing process with various
processes is composed of complex systems, which
have many variables and have few abnormal data, so
it is not easy to detect them.
Because of the variety of sensors that process,
there are many variables in the data, which are likely
to fall into the problem of curse of dimensionality
(Indyk and Motwani, 1998). This is a problem in
machine learning or deep learning where learning
becomes more difficult and requires more data. In
addition, the imbalance problem from less abnormal
data than normal data occurs in a variety of real-world
cases, such as fraud detection (Wei et al., 2013),
medical diagnosis (Mazurowski et al., 2008), and
semiconductor processes (Kerdprasop and
Kerdprasop, 2011). This means when the number of
instances in majority class is greater than the number
of instances in minority class (Chawla et al., 2002).
The ratio between the majority and minority class is
called the imbalanced ratio. A high imbalance ratio
causes the classifier to create a classification model
that is biased against the majority class, thereby
reducing the classification performance of the
minority class (Chawla et al., 2004). For example, if
the majority class has 99 instances and the minority
class has one instance, classifying all instances into
the majority class maximize misclassification error
within the confusion matrix of the minority class.
In many practical cases, instances belonging to the
minority class are often more important than majority
class instances. Therefore, it is necessary to minimize
misclassification errors within minority class
instances while improving their classification
performance.
In this paper, AEWGAN (Autoencoder
Wasserstein Generative Adversarial Networks) is
proposed as the way to solve high-dimensional
imbalanced data in the semiconductor manufacturing
926
Song, S. and Baek, J.
New Anomaly Detection in Semiconductor Manufacturing Process using Oversampling Method.
DOI: 10.5220/0009170709260932
In Proceedings of the 12th International Conference on Agents and Artificial Intelligence (ICAART 2020) - Volume 2, pages 926-932
ISBN: 978-989-758-395-7; ISSN: 2184-433X
Copyright
c
2022 by SCITEPRESS – Science and Technology Publications, Lda. All rights reserved

process. First, train the autoencoder using normal data.
Then, oversampling abnormal data through WGAN
(Wasserstein Generative Adversarial Networks).
Finally, oversampled data is inputted into the
previously trained autoencoder to perform anomaly
detection within the latent space, a reduced dimension.
The rest of this paper is organized as follows.
Section 2, we look at the related work. Section 3, we
address how proposed methods works with its
architectural design. Section 4, describes
experimental details and baseline methods while
Section 5 discusses the conclusions.
2 RELATED WORK
2.1 Anomaly Detection
Anomaly means data with low true probability
density (Harmeling et al., 2006), and data that does
not follow expected normal patterns (Chandola et al.,
2009). Anomaly detection is required because the
analysis of data for any decision can affect the
decision.
Anomaly detection is one of the classifications of
data for analysis purposes and is part of data mining.
Anomaly detection is used as important and
meaningful information in various fields. Examples
include fraud detection of credit cards, health
monitoring of patients in the medical field, and fault
detection at manufacturing (Hodge and Austin,
2004).
Various methods have been proposed for the
detection of anomaly using data, not through domain
knowledge. The general method is to find an
approximation of the data. The method uses the basic
assumption of manifold learning that normal and
abnormal data can be embedded into a low-
dimensional space with distinct differences. In other
words, the method of finding an approximation is to
use a combination of attributes that can capture the
variability of the data (Chandola et al., 2009). This
method includes the supervised learning method of
knowing and analyzing the normal and abnormal
status of each data at the algorithm learning stage, and
the unsupervised learning method, which removes
class labels and finds data showing different from
most normal data. A typical method of unsupervised
learning is an anomaly detection method using an
autoencoder.
The Autoencoder is an unsupervised neural
network model which learns that output values can be
reconstructed similarly to input value. It consists of
encoder and decoder, as shown in Figure 1. Encoder
compresses input data from the input layer to the
hidden layer. Decoder reconstruct compressed data
through the encoder.
Figure 1: Architecture of an autoencoder.
In equation (1) f
θ
is the result of the execution of
the encoder and 𝜃 means the parameter of W and b.
In equation (2) g
ϕ
is the result of the execution of the
decoder and
ϕ
means the parameter W
'
, b
'
. In each
equation, 𝑊(𝑊′) stands for weight, 𝑏
(
𝑏
)
stands for
bias, s for activation function (Vincent et al., 2010).
f
θ
= s(Wx + b) (1)
g
ϕ
= s(W
'
h
+ b
'
)
(2)
The procedure for anomaly detection through the
autoencoder is as follows:
(1) Using normal data only, learn encoder and
decoder to create a model.
(2) Pass abnormal data into the model learned above.
(3) Check abnormal data that has been reconstructed
to the original data through the decoder.
(4) Calculate the anomaly score as shown in equation
as the difference between the original and the restored
data.
Anomaly Score = 𝒙 − 𝑔
(
𝑓
(
𝒙
)
)
(3)
(5) If the anomaly score is greater than the critical
point, determine as the anomaly.
2.2 Imbalanced Data Processing
Technique
Classification performance is more affected by the
majority class than by the minority class (Akbani et
al., 2004). Classification performance demands data
that is uniformly distributed for each class, but actual
semiconductor manufacturing process data are often
extremely biased for some class. Using this
imbalanced data will lead to learning outcomes and
performance degradation, resulting in economic
damage within the business (Freeman, 1995).
New Anomaly Detection in Semiconductor Manufacturing Process using Oversampling Method
927

Oversampling is a popular method of anomaly
detection using imbalanced data. It focuses on the
bias between class in data where the ratio of abnormal
data to normal data is overwhelmingly small.
This paper solves the imbalance by using
oversampling techniques such as Figure 2.
Figure 2: Using oversampling techniques.
Typical oversampling techniques include RO
(Random Oversampling) (Liu, 2014), and SMOTE
(Synthetic Minority Oversampling Technique)
(Chawla et al., 2002), Borderline SMOTE (Han et al,
2005) (More, 2016).
RO is a method of random copying instances in
the minority class to compensate for insufficient data.
There is no loss of information, but there is a
possibility of overfitting because it simply copies
minority class. SMOTE, a method that has been
developed to supplement this, is a method of
generating new synthetic samples using k-NN (k-
Nearest Neighbors), focusing on minority class
instances. In other words, artificial data is generated
by selecting a point on the line that connects one of
the closest neighbors in the data space to an object of
a minority class. However, since sampling is
performed without loss of information but does not
take into account the location of adjacent majority
class instances when generating data, class can
overlap or creates noise, and high-dimensional data is
not efficient. Borderline SMOTE is a method of
generating synthetic data intensively near the
classification boundary. It is characterized by better
classification performance than SMOTE by
generating more data on the classification boundary.
Recently, it has been proposed to use GAN
(Generative Adversarial Networks) to learn the
distribution of minority class to generate artificial
data (Douzas and Bacao, 2018). The use of WGAN
as a method to solve the GAN shortcomings of
vanishing gradient or mode collapse was also
proposed (Wang et al., 2019).
These methods focus primarily on generating data
for the minority class. Therefore, in performing
anomaly detection in this paper, abnormal data with
relatively small proportion in the semiconductor
manufacturing process are oversampled using
WGAN.
3 PROPOSED METHOD
We propose a framework that integrates the concept
of autoencoder in Section 2.1 and the oversampling
method using WGAN in Section 2.2. The overall
architecture is showed in Figure 3. The model
consists of three main steps. The first step is to go
through the process of normalizing the raw data and
then create a model of learning the encoder and
decoder of the autoencoder using normal data only.
The second step is to perform an oversampling over
the WGAN until the number of objects in the
abnormal data is equal to the number of objects in the
normal data. As a final step, pass abnormal data that
has been oversampled in the second step to the
autoencoder model created in the first step. Anomaly
detection is then performed by utilizing a classifier in
the latent space of the autoencoder.
3.1 Step 1: Autoencoder
Effective anomaly detection requires a model that can
classify abnormal and unobserved data only with
normal data. By learning autoencoder with normal
data only, it is possible to classify normal and
abnormal data that has not yet been observed at later
time (An and Cho, 2015; Sun et al., 2018).
The autoencoder model learns a combination of
attributes that can express normal data well within the
potential under the basic assumption of manifold
learning. This represents a reduction in dimension
and can solve the curse of dimensionality.
3.2 Step 2: Oversampling with WGAN
Manufacturing data are mostly in the normal
category. However, abnormal data is often more
important than normal data. This imbalance is
problematic because it results in large
misclassification errors within abnormal data, thereby
reducing the classification performance. Therefore,
we usethe oversampling method which is to randomly
generate abnormal data as way to address the
imbalance of abnormal data.
The problem is that traditional oversampling
methods do not use the distribution of data. WGAN
is an algorithm that complements the shortcomings of
the GAN, a method using probability distribution
ICAART 2020 - 12th International Conference on Agents and Artificial Intelligence
928
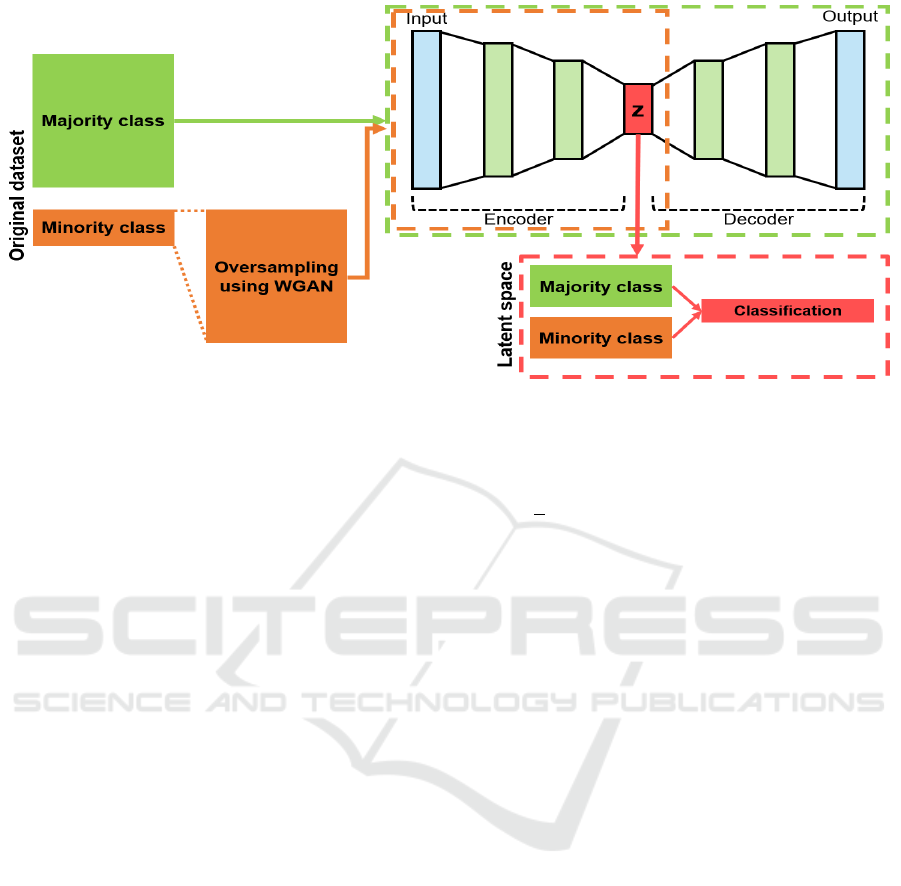
Figure 3: Architecture of AEWGAN.
in a minority class (Arjovsky et al., 2017).
𝐷
(
𝑥
)
=1
∀
𝑥∈𝑝
,𝐷
(
𝑥
)
=0
∀
𝑥∈𝑝
(4)
𝑚𝑖𝑛
𝑚𝑎𝑥
V
(
D, G
)
=𝐸
~
(
)
𝑙𝑜𝑔𝐷
(
𝑥
)
+𝐸
~
()
log (1 − 𝐷𝐺
(
𝑧
)
)
(5)
Typical problems with the GAN include
vanishing gradient and mode collapse. Vanishing
gradient refers to the problem of equation (4) being
satisfied when discriminator is perfect, and the loss
function of equation (5) being close to zero, thus
failing to obtain the gradient in the course of learning.
In equation (4) and equation (5), 𝑝
represents actual
data, 𝑝
represents generated data, and 𝑝
represents
a latent vector that follows the gaussian distribution.
Mode collapse is a problem in which the generator
always produces the same results in the course of
learning.
WGAN uses WD (Wasserstein Distance) such as
equation (5) instead of JS (Jensen-Shannon)
divergence as an indicator of the distance between the
two probabilities distributions. Even when the two
distributions do not overlap in low-dimensional
manifolds, WD still has meaningful values and is
expressed continuously, thus solving the problem of
vanishing gradient and mode collapse (Arjovsky et al.,
2017).
𝑊
𝑝
,𝑝
=in
f
~
∏
(
,
)
𝔼
(,)~
‖
𝑥−𝑦
‖
]
]
(6)
In equation (6),
∏
(𝑝
,𝑝
) represents a set of possible
combined probability distributions between the actual
data 𝑝
and the generated data 𝑝
.
𝑊𝑝
,𝑝
=
1
𝑘
sup
‖
‖
𝔼
~
f
(
𝑥
)
]
−𝔼
~
𝑓
(
𝑥
)
]
(7)
𝐿𝑝
,𝑝
=𝑊𝑝
,𝑝
=max
∈
𝔼
~
𝑓
(
𝑥
)
]
−𝔼
~
()
𝑓
(
𝑔
(𝑥)
)
]
(8)
However, because it is not possible to estimate the
number of possible cases, the newly modified form of
equation (7) is used using Kantorovich-Rubinstein
duality. When this is applied to equation (5) which is
the GAN's loss function, the WGAN's loss function is
expressed as an equation (8).
The
‖
𝑓
‖
≤𝐾 of equation (7) means K-Lipschitz
continuous and there is a real value 𝐾≥0 that
satisfies
|
𝑓
(
𝑥
)
−𝑓(𝑥
)
|
≤𝐾
|
𝑥
−𝑥
|
. In WGAN,
identifiers will not be direct criteria for identifying
actual and generated data, instead learning K-
Lipschitz continuous to find a good f. The smaller the
loss function in the learning process, the smaller the
WD becomes, the closer the constructor's resultant
value is to the actual data.
Therefore, oversampling is performed using the
WGAN until the number of instances in the abnormal
data is equal to the number of instances in the normal
data.
3.3 Step 3: Anomaly Detection in
Latent Space
Latent space is the space expressed using a
combination of attributes that can capture the
variability of data along the basic assumption of
manifold learning that normal and abnormal data can
New Anomaly Detection in Semiconductor Manufacturing Process using Oversampling Method
929

Table 1: Performance Comparisons.
Model
Raw RO SMOTE GAN AEWGAN
LR SVM RF LR SVM RF LR SVM RF LR SVM RF LR SVM RF
Precision 0.786 0.660 0.300 0.843 0.872 0.861 0.855 0.891 0.847 1.000 1.000 0.991 1.000 1.000 1.000
Recall 0.282 0.437 0.034 0.919 0.950 0.982 0.919 0.942 0.963 0.993 0.992 0.991 0.994 0.992 0.997
F-measure 0.384 0.515 0.060 0.879 0.909 0.918 0.886 0.916 0.901 0.996 0.996 0.996 0.997 0.996 0.996
AUC 0.641 0.718 0.517 0.874 0.906 0.912 0.882 0.912 0.894 0.996 0.996 0.995 0.997 0.996 0.995
be embedded into a low-dimensional space with
distinct differences.
The autoencoder previously learned from normal
data, will learn how to use a combination of attributes
that can capture the variability of normal data within
the latent space. Then, when abnormal data that has
been oversampled through the WGAN is entered into
the input value, it appears to be a different
combination of attributes than it was before, so it is
judged to be anomaly. Therefore, anomaly detection
is carried out by utilizing the classifier within the
latent space.
4 EXPERIMENTAL SETTING
The data used in the experiment for performance
verification in this paper are semiconductor wafer
data provided by the UEA & UCR Time Series
Classification Repository (Olszewski, 2001). It
consists of a set of 152 different sensor values
measured in the semiconductor manufacturing wafer
process and is the imbalanced ratio of 10.7% with 762
abnormal data out of 7,164 data. In order to match 762
abnormal data similarly to the 3-sigma of the actual
process, this paper conducted the experiment using
only 30 data.
To verify AEWGAN's performance, compare the
original data, RO, SMOTE, and methods using the
GAN. Use LR (Logistic regression, SVM (Support
Vector Machine), and RF (Random Forest) as the
classifier for performance evaluation. Use the
equation (9) precision, equation (10) recall, equation
(11) F-measure, and equation (12) AUC (Area Under
Curve), depending on the results of the table for the
confusion matrix in Table 1.
To check for anomaly detection, the t-SNE (t-
Stochastic Neighbor Embedding) method was used to
transform the distances between data stochastically.
Because t-SNE shows stable embedded learning
results over other algorithms for visualization, it is
suitable for expressing potential space in two
dimensions.
Table 2: Confusion Matrix.
Actual:
Yes
Actual:
No
Predicted:
Yes
TP
(True Positive)
FP
(False Positive)
Predicted:
No
FN
(False Negative)
TN
(True Negative)
𝑃𝑟𝑒𝑐𝑖𝑠𝑖𝑜𝑛 =
𝑇𝑃
𝑇𝑃
+
𝐹𝑃
(9)
𝑅𝑒𝑐𝑎𝑙𝑙 =
𝑇𝑃
𝑇𝑃 + 𝐹𝑁
(10)
𝐹−𝑚𝑒𝑎𝑠𝑢𝑟𝑒=
2𝑇𝑃
2𝑇𝑃 + 𝐹𝑃 + 𝐹𝑁
(11)
𝐴
𝑈𝐶 =
𝑇𝑟𝑢𝑒 𝑃𝑜𝑠𝑖𝑡𝑖𝑣𝑒 𝑅𝑎𝑡𝑒
1−𝐹
𝑎𝑙𝑠𝑒
𝑃
𝑜𝑠𝑖𝑡𝑖𝑣𝑒
𝑅
𝑎𝑡𝑒
(12)
Table 2 shows performance comparisons of abnormal
class between 15 or more detection models of wafer
data. All the results of the experiment were better
compared to the raw data. As a result, the
performance of GAN and AEWGAN is better than
RO and SMOTE. It also confirmed that AEWGAN,
the proposed method rather than using the GAN,
improved the results by improving the shortcomings
of the GAN.
In addition, the raw data and the data with
AEWGAN were compared as t-SNE as way to
determine if anomaly detection was carried out.
Figure 4(a) is a result of t-SNE for the raw data,
resulting in a severe imbalance and difficulty in
separating normal from abnormalities. The result of
applying AEWGAN is Figure 4(b). Unclassified data
has been easily discriminated against, and imbalanced
data problem has also been solved.
ICAART 2020 - 12th International Conference on Agents and Artificial Intelligence
930
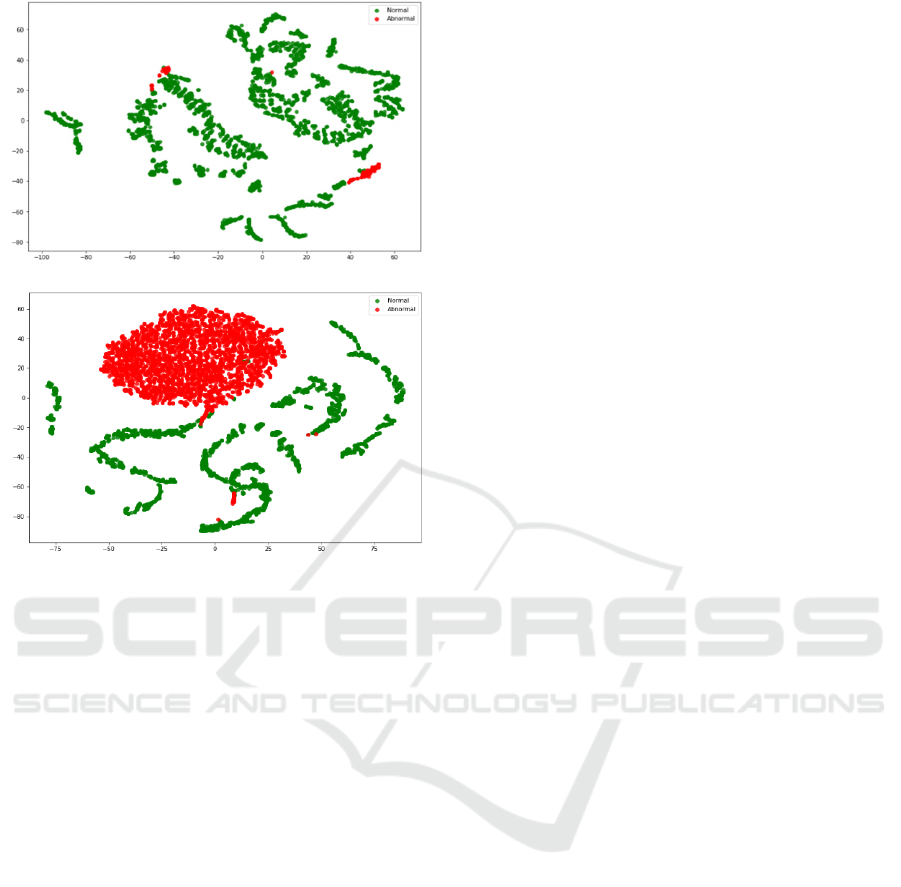
(a) Before AEWGAN
(b) After AEWGAN
Figure 4: Embedding using t-SNE.
In summary, the proposed method using
AEWGAN in this paper has shown excellent results
in terms of sampling and anomaly detection for wafer
data, which is high-dimension imbalanced data.
5 CONCLUSIONS
We observed proposed AEWGAN show an efficient
abnormal detection method of semiconductor
manufacturing process data with high dimensional
imbalance characteristics. AEWGAN first proceeded
with the autoencoder learning using normal data only.
Then, the abnormal data was oversampled using the
WGAN and put into the previously learned model as
an input value. Finally, we carried out anomaly
detection within the latent space.
In the experiment, semiconductor wafer data with
an extreme imbalance of 152 dimensions were used.
The results of the experiment showed that the
AEWGAN of this paper, performed better
classification performance in abnormal data
compared to other models and that efficient anomaly
detection was also performed in visual comparisons
through t-SNE.
The method is expected to be applicable to semi-
conductor manufacturing processes with various
production systems, i.e. data with many variables and
few abnormal data, so it is likely to be practical and
applicable to a wide variety of areas. Future work to
be undertaken not only will detect the manufacturing
process sensor data but also time series data affected
by past values. It is thought that quantitative
comparisons will be needed in the future.
ACKNOWLEDGEMENTS
This work was supported by the National Research
Foundation of Korea (NRF) grant funded by the
Korea government (MSIT) (NRF-
2019R1A2C2005949). This work was also supported
by the BK21 Plus (Big Data in Manufacturing and
Logistics Systems, Korea University) and by the
Samsung Electronics Co., Ltd.
REFERENCES
Akbani, R., Kwek, S., and Japkowicz, N., 2004. Applying
support vector machines to imbalanced datasets. In
European conference on machine learning (pp. 39-50).
Springer, Berlin, Heidelberg.
An, J., Cho, S., 2015. Variational autoencoder based
anomaly detection using reconstruction probability,
Special Lecture on IE, 2, 1-18.
Arjovsky, M., Chintala, S., and Bottou, L., 2017.
Wasserstein gan. arXiv preprint arXiv:1701.07875.
Chandola, V., Banerjee, A., and Kumar, V., 2009. Anomaly
detection: A survey, ACM computing surveys (CSUR),
41(3), 15.
Chawla, N. V., 2009. Data mining for imbalanced datasets:
An overview. In Data mining and knowledge discovery
handbook (pp. 875-886). Springer, Boston, MA
Chawla, N. V., Bowyer, K. W., Hall, L. O., and Kegelmeyer,
W. P., 2002. SMOTE: Synthetic minority over-
sampling technique. Journal of Artificial Intelligence
Research, 16, 321–357.
Chawla, N. V., Japkowicz, N., and Kotcz, A., 2004. Special
issue on learning from imbalanced data sets. ACM
Sigkdd Explorations Newsletter, 6(1), 1-6.
Chen, B., Wan, J., Shu, L., Li, P., Mukherjee, M., and Yin,
B., 2017. Smart factory of industry 4.0: Key
technologies, application case, and challenges. IEEE
Access, 6, 6505-6519.
Douzas, G., and Bacao, F., 2018. Effective data generation
for imbalanced learning using conditional generative
adversarial networks. Expert Systems with applications,
91, 464-471.
Freeman, J., 1995. Outliers in statistical data. Journal of the
Operational Research Society, 46(8), 1034-1035.
Goodfellow, I., Pouget-Abadie, J., Mirza, M., Xu, B.,
Warde-Farley, D., Ozair, S., ... and Bengio, Y., 2014.
New Anomaly Detection in Semiconductor Manufacturing Process using Oversampling Method
931

Generative adversarial nets. In Advances in neural
information processing systems (pp. 2672-2680).
Harmeling, S., Dornhege, G., Tax, D., Meinecke, F., and
Müller, K. R., 2006. From outliers to prototypes:
ordering data. Neurocomputing, 69(13-15), 1608-1618.
Hodge, V., and Austin, J., 2004., A survey of outlier
detection methodologies. Artificial intelligence review,
22(2), 85-126.
Indyk, P., and Motwani, R., 1998. Approximate nearest
neighbors: towards removing the curse of
dimensionality. In Proceedings of the thirtieth annual
ACM symposium on Theory of computing (pp. 604-613).
ACM.
Kerdprasop, K., and Kerdprasop, N., 2011. A data mining
approach to automate fault detection model
development in the semiconductor manufacturing
process. Int. J. Mech, 5(4), 336-344.
Liu, A. C., 2004. The effect of oversampling and
undersampling on classifying imbalanced text datasets.
The University of Texas at Austin.
Mazurowski, M. A., Habas, P. A., Zurada, J. M., Lo, J. Y.,
Baker, J. A., and Tourassi, G. D., 2008. Training neural
network classifiers for medical decision making: The
effects of imbalanced datasets on classification
performance. Neural networks, 21(2-3), 427-436.
More, A., 2016. Survey of resampling techniques for
improving classification performance in unbalanced
datasets. arXiv preprint arXiv:1608.06048.
Olszewski, R. T., 2001. Generalized feature extraction for
structural pattern recognition in time-series data (No.
CMU-CS-01-108). CARNEGIE-MELLON UNIV
PITTSBURGH PA SCHOOL OF COMPUTER
SCIENCE.
Sun, J., Wang, X., Xiong, N., and Shao, J., 2018. Learning
sparse representation with variational auto-encoder for
anomaly detection. IEEE Access, 6, 33353-33361.
Vincent, P., Larochelle, H., Lajoie, I., Bengio, Y., and
Manzagol, P. A., 2010. Stacked denoising autoencoders:
Learning useful representations in a deep network with
a local denoising criterion. Journal of machine learning
research, 11(Dec), 3371-3408.
Wang, Q., Zhou, X., Wang, C., Liu, Z., Huang, J., Zhou,
Y., ... and Cheng, J. Z., 2019. WGAN-Based Synthetic
Minority Over-Sampling Technique: Improving
Semantic Fine-Grained Classification for Lung
Nodules in CT Images. IEEE Access, 7, 18450-18463.
Wei, W., Li, J., Cao, L., Ou, Y., and Chen, J., 2013.
Effective detection of sophisticated online banking
fraud on extremely imbalanced data. World Wide Web,
16(4), 449-475.
ICAART 2020 - 12th International Conference on Agents and Artificial Intelligence
932
