
Non-invasive Recording with a New Three-channel Pneumatic Sensor
V. E. Antsiperov
1a
, G. K. Mansurov
1
, M. V. Danilychev
1
and A. S. Bugaev
2
1
Kotelnikov Institute of Radioengineering and Electronics (IRE) of RAS, Mokhovaya, Moscow, Russian Federation
2
Moscow Institute of Physics and Technology, Dolgoprudny, Russian Federation
Keywords: Arterial Blood Pressure, Non-invasive Pressure Monitoring, Hemodynamics, Pulse Wave Transition,
Three-channel Pneumatic Sensor.
Abstract: The paper presents the design features and test results of a new non-invasive blood pressure monitoring sensor
based on the local pressure compensation principle. Real-time differential processing of three-channel pulse
wave data is used to determine and maintain the optimal position of the sensor on the patient’s body. The
small size measuring unit with very small (1 mm
2
or less) sensor pads, when placed accurately on elastic
surfaces (for example, on the skin and underlying tissues), provides high-quality pulse wave recording,
continuity of measurement and minimization of external interference. The paper also gives the results of
measurement for some superficial arteries of the human body. Further development version of the sensor with
synchronous ECG measurement is also presented.
1 INTRODUCTION
Cardiovascular and cerebrovascular disorders,
referred to in the official statistics as circulatory
diseases, represent the most common death causes in
the Russian Federation (55% of deaths) (Chazova et
al., 2015). As part of diagnosis and treatment of those
disorders, specialists use the data on the state of the
circulatory system and the state of specific organs,
obtained by analysing blood pressure measurement
data (for accessible body parts). Though the invasive
blood pressure measurement method is considered
the most accurate and reliable, it is used only in a
medical institution under continuous supervision of a
competent and accredited medical staff. This method
is not suitable in everyday life due to strict staff
requirements and the risk of injury. Besides, the
invasive method is not applicable for everyday health
examination, monitoring of hemodynamics and the
state of the cardiovascular system in real-time.
Most modern non-invasive blood pressure
measurement methods are based on counter-pressure
handling in the cuff or pad applied to this artery
(usually to the whole limb). The purpose of these
manipulations is to maximally balance the excess
pressure held by the elastic walls of the artery
(Settels, 2015). For instance, the Penaz blood
a
https://orcid.org/0000-0002-6770-1317
pressure monitoring method employs the volumetric
compensation principle, which implies the dynamic
unloading of vascular walls (Peňáz, 1973). Speaking
of the bottlenecks of those methods – the limb
gripping causes blood stagnation and a physician
should periodically relax the cuff, which violates
continuous monitoring and disturbs the wave pattern.
Furthermore, it is quite difficult to arrange the
continuous recording of pulse wave signals during
numerous consecutive cardiac cycles under
dynamically changing load and at various parts on the
human body. From a technical point of view,
transmitting and processing the recorded signals by
developed or existing software cause no difficulties.
However, what remains to be a problem is capturing
high-quality blood pressure signals with no artifacts
at various points on the human body.
2 SENSOR CONCEPT / DESIGN
To address the above problem, a new continuous
blood pressure monitoring method was developed
based on the local pressure compensation technique
(Figure 1). The method became viable thanks to the
local compensation principle for pressure
measurement on small (1 mm
2
and less) surfaces,
268
Antsiperov, V., Mansurov, G., Danilychev, M. and Bugaev, A.
Non-Invasive Blood Pressure Monitoring Based on Pulse Wave Recording with a New Three-channel Pneumatic Sensor.
DOI: 10.5220/0009169902680273
In Proceedings of the 13th International Joint Conference on Biomedical Engineering Systems and Technologies (BIOSTEC 2020) - Volume 1: BIODEVICES, pages 268-273
ISBN: 978-989-758-398-8; ISSN: 2184-4305
Copyright
c
2022 by SCITEPRESS – Science and Technology Publications, Lda. All rights reserved

worked out earlier by the authors (Antsiperov et al.,
2017).
Figure 1: Blood pressure measurement through local
pressure compensation. P
rec
is compressed air receiver
pressure, P
art
is pressure in the artery, P
sen
is that in the
sensor chamber (A); and measuring assembly applied to the
patient's wrist (B).
Basically, local compensation in pressure
measurement amidst barely accessible gas/fluid
volumes is an intuitive concept. If it is possible to
make the surface enclosing the volume of an elastic
covering locally flat via the external impact, external
pressure will equalize internal pressure due to the
absence of normal tension. The principle was
implemented in the applanation tonometry method
used for measuring intraocular pressure (Goldmann et
al., 1975). After several years of hard work, the
authors found the solution and developed an
applanation tonometer that provides local pressure
compensation and has an open chamber between the
tile flat surface and the elastic surface of the skin.
With that, the chamber volume is quite small (about
1mm
3
) and mostly consists of the connection tube
hole and pressure sensor hollow. Using air as the
working agent of the sensor, we get an advantage over
the analogues sensor filled with liquid. Excess air can
be easily discharged into the atmosphere without
reversing charge ducts. Figure 1 illustrates how the
tonometer works. If at a specific moment P
sen
(pressure in the measurement unit) is lower than P
art
(arterial pressure), the tissue and skin above the artery
press against the sensor air duct, thereby shutting it.
P
sen
is growing fast due to continuous air supply from
the high-pressure receiver through the screw throttle.
When it reaches P
art
, the duct opens, and the excess
air is discharged into the area underneath the sensor
flat surface pressed against the skin. If the air inflow
to the chamber is designed correctly (by determining
P
rec
and throttle screw position), laminar airflow will
keep the skin surface flat and almost enclosed,
maintaining P
sen
≈ P
art
(even upon variable blood
pressure). In other words, the pneumatic sensor
performs local pressure compensation like a safety
valve with continuous compressed air inflow (from
the receiver) through the flow limiting throttle.
Significantly, the pressure is measured directly, and
not calculated, for example, by the normal component
of the force per area of the sensing element. Static
tests on the artery simplified the model connected to
a water column of adjustable height showed that the
measured values correspond to the water pressure in
the model from 0 to 90 mmHg with a stable offset of
about +10 mmHg. As a model was used a thin-walled
rubber tube — a piece of sausage-shaped air balloon
of a diameter of less than 1 cm at pressures up to 90
mmHg. The pressure drop on the model wall can be
explained by the properties of rubber — simple
elasticity, in contrast to the viscoelastic properties of
living tissue.
Inexpensive piezoresistive sensors by Honeywell
International Inc., used as primary pressure
converters, are mounted close to sensing pads to
minimize working volumes. Preamplified signals are
fed to analog inputs of embedded MCU (we use
STM32L151), which performs all low-level tasks,
including the micro compressor steering, data
acquisition, processing and communication with the
host computer (or smartphone).
3 POSITIONING PROBLEM
Beneficial as it may be the local pressure
compensation method entails new problems
concerning positioning the sensor. As the sensing
area of contact (duct outlet) is much smaller than the
artery cross-section, P
sen
matches P
art
(Figure 1) only
if the area of contact is located exactly above the
artery axis. Figure 2 shows in detail the uneven
distribution of pressure along the contact line of the
sensor in the transverse direction. As is seen, if the
sensor is moved left or right from the symmetry axis,
the observed value of pressure decreases while the
ratio of various curve elements distorts (Figure 2). A
detailed study showed that if the sensor is positioned
exactly above the artery axis, the pressure signal has
the largest amplitude, and local extrema points
themselves turn out to be sharper. For positions
symmetrically located against the artery, pulse wave
charts are almost identical though they may have
certain distinctions. Those distinctions are most
explicit at the diastole stage (Figure 3).
In the sensor tests the pressure appeared to be
distributed unevenly in the direction transversal to the
artery axis. That is due to the artery shape and
wavering of the artery axis position upon pulsation
under the sensor plate.
Non-Invasive Blood Pressure Monitoring Based on Pulse Wave Recording with a New Three-channel Pneumatic Sensor
269
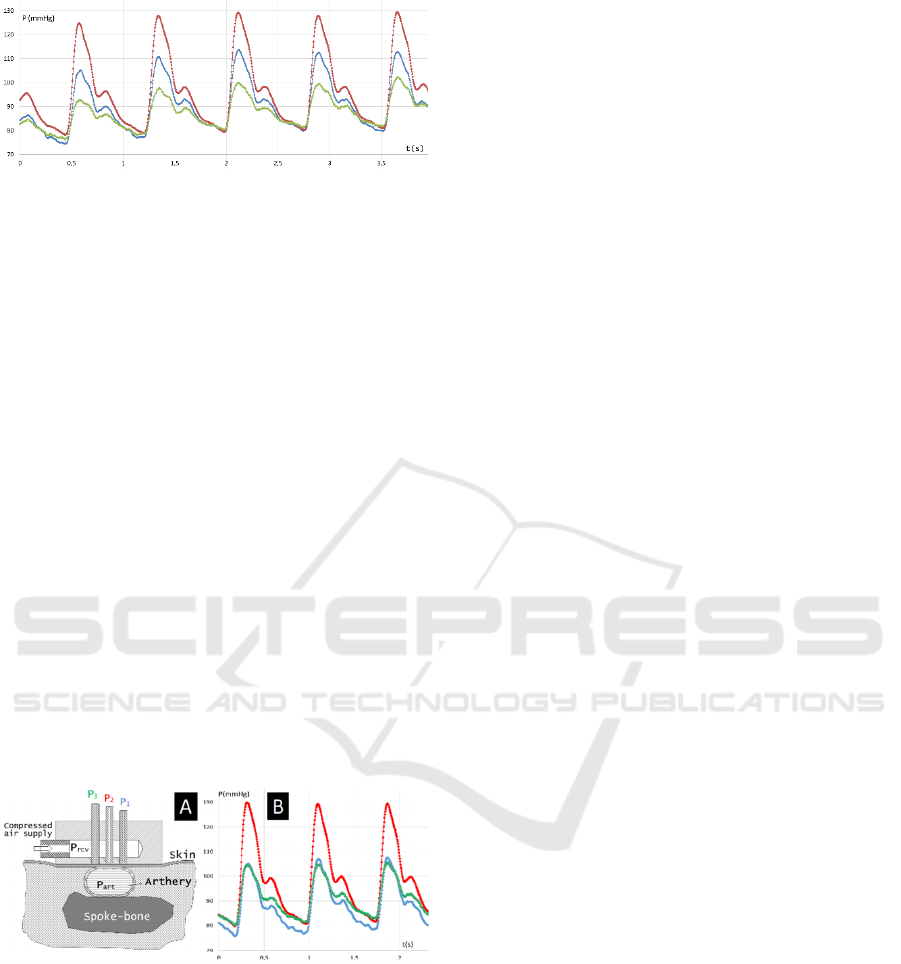
Figure 2: Different shapes of pulse wave signal depending
on the sensor pad position: ● — pad is located accurately
above the artery axis, ■. ♦ — pad is moved left and right
from the center of the radial artery, respectively.
This leads to two important conclusions relating
to positioning the sensor. First, the central measuring
chamber must be located accurately above the artery
axis projection. Second, the artery must be pressed by
the sensor to underlying tissues in a way its axis does
not waver upon pulsation. These observations
stimulated the authors to practically realize the
"targeting" method similar to the lateral signals
equalizing approach used in radar technique.
According to that, the authors designed a blood
pressure monitoring sensor whose main part is the
measuring block with three separate chambers. Each
chamber has its own independent measuring output.
During the operation, the channel nozzles are
positioned in a row transversely against the artery.
With that, the dimensions of the area of contact must
be designed to ensure that all the three nozzles are
located above the subject artery during the operation.
Figure 3 gives the sketch of the sensor and the result
of concurrent three-channel pulse wave measurement
(the sensor located above the radial artery).
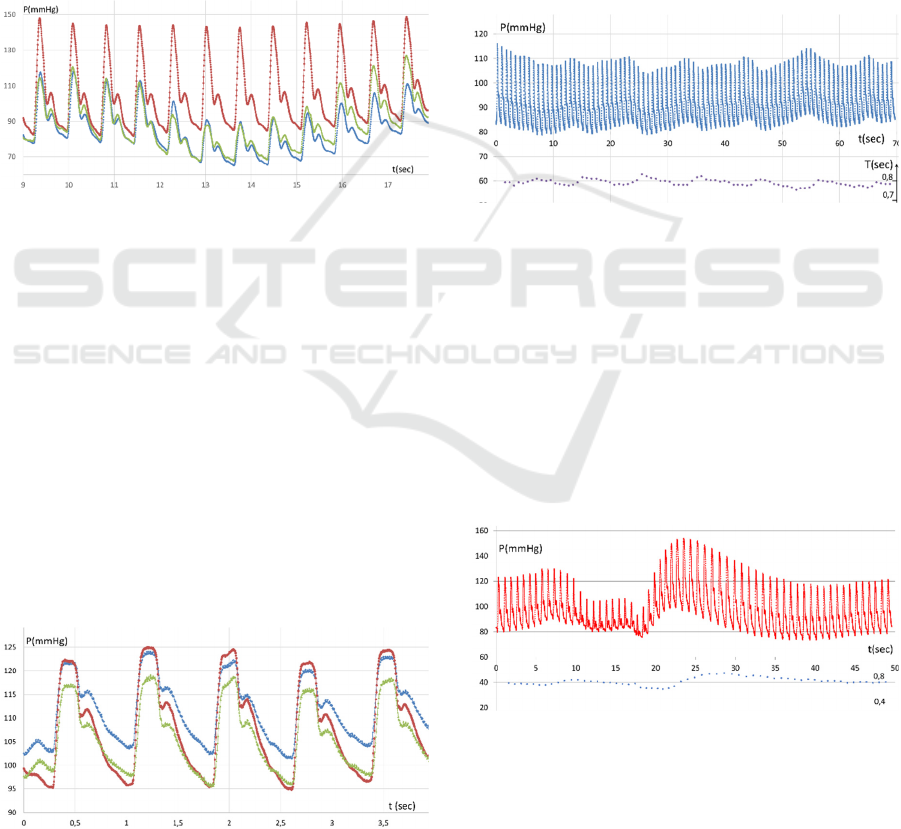
Figure 3: Three-chamber sensor enabling local-
compensation blood pressure measurement (A); and
synchronous three-channel pulse wave chart (B).
The comprehensive specification of the sensor is
provided in the patent (Mansurov et al., 2018). In
terms of the proposed design, the main task of side
channels is to ensure proper positioning of the central
measurement pad. With the correct position of the
measuring unit, the calibrated signals on the side
channels (Figure 3) coincide or slightly differ from
each other. It can be neglected that artery walls under
side channels cannot be fully unloaded, so the
pulsation response in those channels is significantly
distorted. It is only important that upon the equality
of those signals, the central chamber is positioned
accurately above the artery axis ("targeted") — in
such a position, that its signal will be a non-distorted
copy of arterial pressure (Antsiperov et al., 2018).
The methodology of measuring blood pressure by
the three-chamber pneumatic sensor is tightly related
to the described design features. At the first stage, just
before the measurement, the location of the artery is
determined by palpation. Then the sensor is applied
onto that place so that measuring chambers are
positioned in a row transversely against the artery
(Figures 2 and 3). Then, manually moving the sensor
along this direction (transversely against the artery),
the physician should find a position in which signals
of side channels are as equal as possible. After that,
the measurement unit is pressed against the skin so
that the contact area under the central pad became flat,
but without the artery occlusion (applanation
principle). For the radial artery case, the criterion of
the best position was experimentally determined.
According to it, the signal amplitude of the central
channel must be about twice as high as the equalized
amplitudes of the side channels.
The problem of positioning the sensor on the
radial artery was addressed via designing a
monolithic three-chamber sensor that reflected the
problem specifics. Three chambers are made in a rigid
flat surface (1.8 mm increment) along the line
perpendicular to the artery axis projection on the
sensor plane. The chambers are independently fed by
the air from the receiver through individual air
throttles. This way the pressure on the sensor surface
can be measured concurrently and independently at
three points (0.8 mm in diameter). To estimate the
thickness of the air cushion underneath the plane
surface, the current air consumption rate was
measured and amounted to ~ 0.5 cm
3
/s (with
accounting possible leaks). By the average pressure
difference of 100 mm Hg, the discharge flow speed in
the hole is about 140 m/s. The flow cross-section
thereby totaled 500/140,000 = 0.0036 mm
2
or 0.0012
mm
2
for each camera. Assuming that air is discharged
within the half of the chamber hole perimeter (cleft
length is ~ 1 mm), the cleft width should be ~ 1 µm.
The sensor of this type can be used for measuring
parameters of radial and other arteries (carotid,
temporal, etc.). However, such a sensor positioning
algorithm enabling adequate quantitative blood
pressure measurement is developed and empirically
confirmed only for positioning the sensor on the
radial artery.
BIODEVICES 2020 - 13th International Conference on Biomedical Electronics and Devices
270
4 PRIMARY TESTING
The experiments accompanied every stage of
hardware and software development. Some of the
recent results we found to be interesting are presented
below. The comparison of the results shows that
every artery is subject to individual specifics of pulse
wave parameters recorded at a certain point on the
human body. Those specifics affect the methodology
of practical measurements and further data
interpretation. Generally, the procedure of measuring,
interpreting, and using such data requires coordinated
efforts of equipment developers and cardiologists, as
well as measurement statistics for every artery.
Figure 4: Radial artery pulse wave, optimal position, slight
variations of press force ● – central channel signal (right
above the radial artery axis), ■, ♦ − side channels signals.
The experiments on measuring the pressure on
various surface arteries showed that the arteries
located over rigid tissue (bone) enable to register the
pulse wave shape and current blood pressure. Besides
the radial artery (Figure 4), we managed to measure
pressure only on the temporal artery (below in text).
With that, the positioning of the present sensor on it
turned out to be a difficult procedure, probably due to
the mobility and small diameter of the artery.
Unfortunately, as for the carotid artery, we can still
register the pulse wave pattern (Figure 5), but the
shape of the pulse wave does not give us the
appropriate information about the aorta state and the
cerebral circulation activity.
Figure 5: Carotid artery pulse wave: ● − central channel
signal, ■, ♦ − side channel signals.
The charts presented in Figure 5 demonstrate that
the carotid artery’s cross-section (which is
significantly larger than that of the radial artery) and
the lack of rigid tissues underneath has explicit
impact on the central vs side signal ratio. It seems
necessary to study the correlation and find an optimal
artery diameter/channel interval ratio for every artery
type.
The pulse wave pattern and quantitative
parameters change under various external and
internal processes. For instance, this phenomenon is
reflected in the radial artery pulse wave charts for the
quiescent state with consecutive deep inhaling and
exhaling (Figure 6) and holding breath when inhaled
(Figure 7). Let us consider those situations.
Figure 6: Pulse wave (upper curve) and variability of
heartbeat intervals (bottom point row, right scale),
quiescent, deep breathing.
Figure 6 illustrates the long-term pulse wave
pattern for a calm patient. Several deep inhalations
and exhalations explicitly affect average pressure in
the radial artery and heartbeat variations. It could be
supposed that, in the quiescent state, the heartbeat rate
adapts to maintain the average pressure in the aorta
against the thorax pressure. Perhaps a well innervated
aortic arch acts as a pressure gauge that is sensitive to
pressure differences inside and outside the aorta.
Figure 7: Radial artery pulse wave transformation (upper
curve) and variability of heartbeat intervals (bottom point
row, right scale) for short breath holding after inhaling.
The next figure (Figure 7) shows the pulse wave
pattern for the radial artery for held breath after
inhaling. Here’s how we can explain the peculiar
pattern of oscillations. During the very first seconds
Non-Invasive Blood Pressure Monitoring Based on Pulse Wave Recording with a New Three-channel Pneumatic Sensor
271
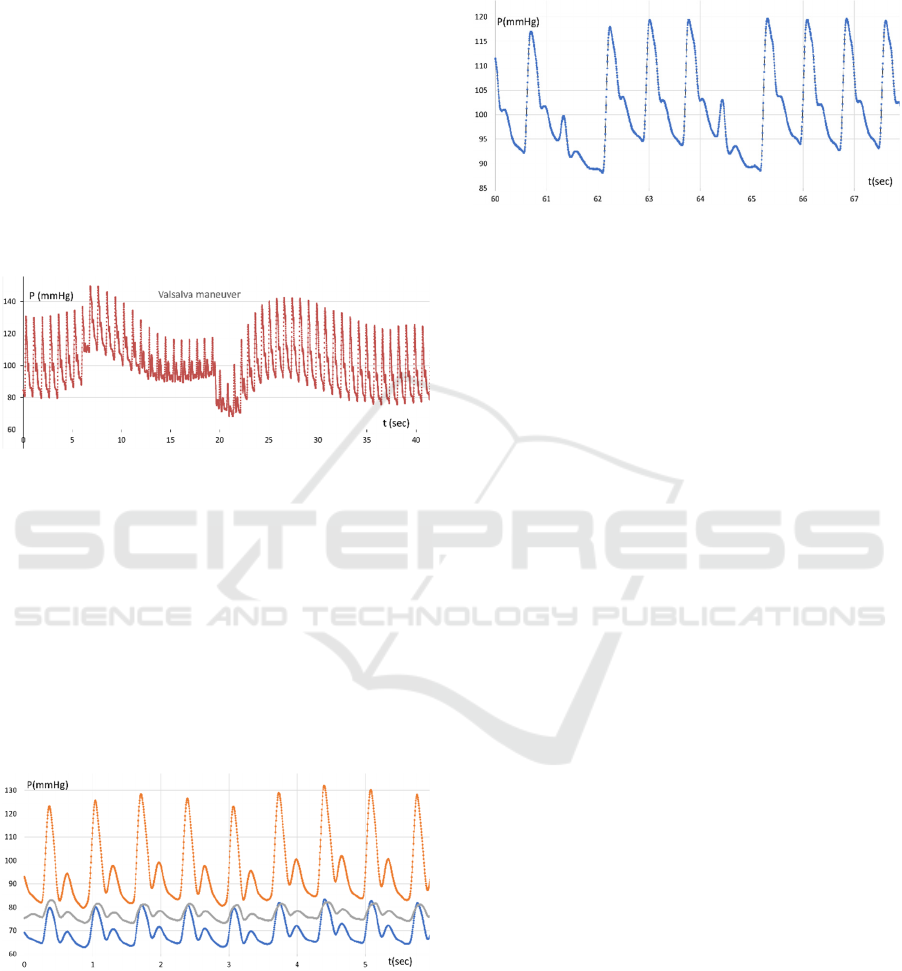
of breath holding, the lung and thorax pressure
increase due to the reflective desire to exhale
suppressed by the shut pharynx. The average pressure
in the artery starts growing following the aortic
pressure. At the 6th-7th second, the pressure starts
falling. Probably due to the increasing pressure drop,
insufficient venous blood enters the chest. At the 17th
second of the recording after exhalation, we can see
how the pressure drops briefly and then, after a
smooth increase in pressure for 20-25 seconds, the
initial picture of the pulse pressure wave is restored.
Figure 8 illustrates the pulse wave pattern under the
Valsalva maneuver. A few seconds before exhaling
the aortic walls appear to be unloaded almost
completely because of the pressure balance.
Figure 8: Radial artery pulse wave pattern under Valsalva
maneuver.
Another instance of an unusual radial artery pulse
wave pattern is shown in Figure 9. This signal was
recorded in the patient on the second day after the
injection of the EnceVir vaccine against tick-borne
encephalitis. It is known that this medicine may cause
reactions manifested in higher body temperature
(37.1° to 38.0°C), headache, fatigue, muscle and joint
pain. The reaction usually lasts for 3 days. By the end
of the second day, the above symptoms faded away
and the pulse wave pattern normalized.
Figure 9: Radial artery pulse wave pattern transformation
(central and side channels) one day after EnceVir injection.
Figure 10 illustrates the pulse wave pattern of the
diseased and fatigued patient. It is seen that the
regularity of the registered systolic pressure peaks
remains, while the partial losses look like omissions
without any disturbance of time intervals. Most
probably it is arrhythmia manifested in the form of
extrasystoles. However, without a synchronous ECG,
it is difficult to assert it is arrhythmia.
Figure 10: Pulse wave pattern disturbances (possibly
arrhythmia).
Therefore, this experiment drove us to develop the
synchronous ECG channel and integrate it into the
device. Since the high-resolution ECG is not required
to locate R-peaks, we designed a simplified single-
channel cardio-signal amplifier.
5 ECG CHANNEL-INTEGRATED
CIRCUIT
In the simplified cardio-signal amplifier we
developed an original scheme for connecting ECG
electrodes. It enables the equipment to operate
without a neutral electrode and without a conductive
gel. In this case, the suppression of interference is
carried out at the circuitry level and then using digital
signal processing (filtering). The purpose of
modifying the initial design was the desire to find out
the relationship between the pulse wave dynamics
and the rhythmic activity of the heart. Figure 11
illustrates the radial artery pulse wave pattern (blue
curve) recorded synchronously with the ECG (red
curve). Introducing the ECG channel to the circuit
enables watching the cardiac contraction signal (input
signal) pattern and the pattern of the resulting pulse
wave (output signal) at one of the possible
measurement locations (e.g. wrist, Figure 11). Based
on the analysis of the relationship between the signals
at the input and output of the cardiovascular system,
a few its time-frequency characteristics can be
estimated using methods known in radio physics.
Using the subject pneumatic sensor with an ECG
channel enables non-invasive measurement of the
pulse wave transit time. This value, jointly with non-
invasive systolic pressure monitoring and continuous
analysis of the pulse wave dynamics, can be used to
BIODEVICES 2020 - 13th International Conference on Biomedical Electronics and Devices
272
estimate the current state of the cardiovascular system
and diagnosing clinical and subclinical atherosclerosis.
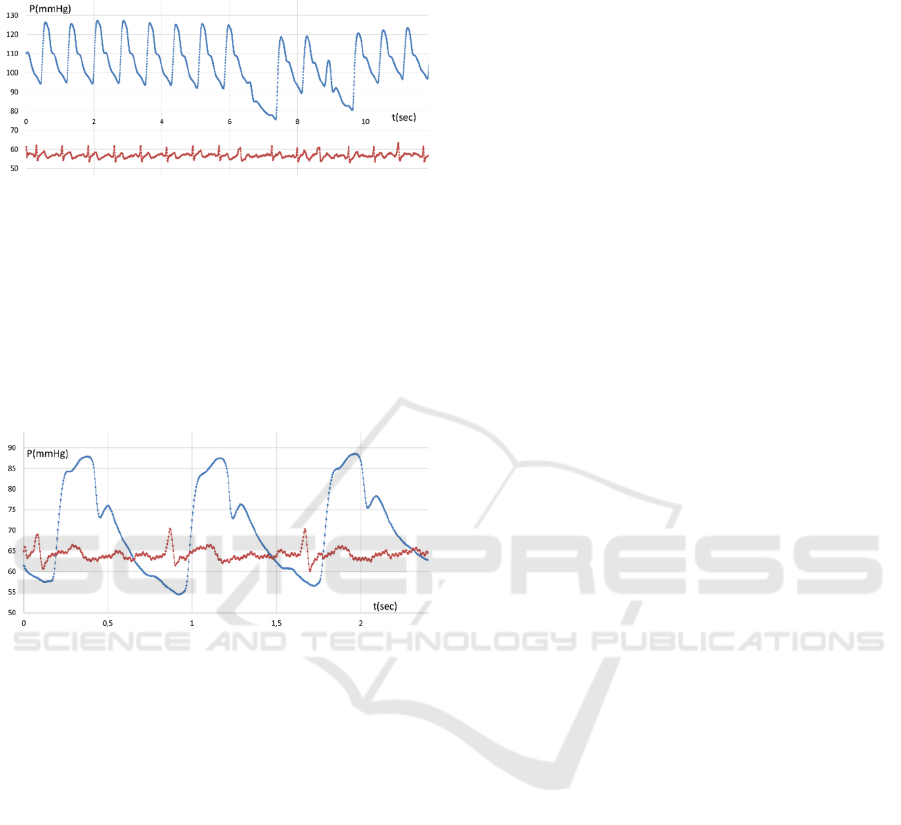
Figure 11: Pulse wave pattern disturbances (extrasystoles)
and synchronously recorded ECG.
As mentioned above, in our experiments we
managed to measure actual pressure (in mmHg) in the
temporal artery (likewise the radial artery). It was quite
difficult to ensure proper positioning in that case
(probably due to high motility and small diameter).
Figure 12 illustrates the results of synchronous pulse
wave measurement and ECG.
Figure 12: Temporal artery pulse wave pattern and
synchronously recorded ECG.
It goes without saying that the complex technology
of acquiring and interpreting combined data described
in this section has much room for further improvement.
However, there is feasibility in the significant growth
of the comprehensiveness and reliability of the
suggested approach in early heart and vessel disease
diagnosis compared to earlier methods not employing
pressure wave measurement with ECG timing.
6 CONCLUSIONS
The research results in the following conclusions:
1. The device designed enables real-time continuous
blood pressure measurement on several surface
arteries, displaying the pulse wave within a single cycle
and in long-time intervals.
2. The experiments on measuring pressure of
various surface arteries showed that arteries located
over rigid tissues (bones) allow to register the pulse
wave shape and current blood pressure. This was
proved for the radial and temporal arteries.
3. The device enables not only systolic/diastolic
pressure metering but also monitoring current value as
well as durable variations of arterial pressure
associated with respiration and the processes of
autonomic regulation.
4. Implementing the synchronous ECG channel
increased the amount of measurement data and enabled
monitoring of parameters of pulse wave transit along
surface arteries significant for several diseases.
5. In general, the research of the optimal methods for
measuring, interpreting, and using discussed data
demands the cooperation of cardiologists and
equipment developers, as well as the software
developers.
ACKNOWLEDGEMENTS
The authors are grateful to the Russian Foundation for
Basic Research (RFBR), grant N 18-29-02108 mk for
the financial support of this work.
REFERENCES
Antsiperov, V.E., Mansurov, G.K. et al, 2016. Pneumatic
sensor for non-invasive continuous blood pressure
measurement In Invention patent 2638712. Priority
November 7, 2017. Bulletin No. 35.
Antsiperov, V.E., Mansurov, G.K., and Danilychev, M.V.,
2018. Method of positioning a pneumatic sensor for
noninvasive blood pressure monitor according to three-
channel pulse wave detecting signal. In Proceedings of
the 11
th
International Scientific and Technical
Conference «Acousto-optic and radar methods for
information measurements and processing». P. 140-144.
Chazova I.E., Oshepkova E.V., Zhernakova Yu.V.
Diagnostics and treatment of arterial hypertension.
Clinical guidelines. In Kardiologicheskij Vestnik. No.1.
2015. Vol.10. pp.5-30.
Goldmann, H., Schmidt, T., 1975. Ueber
Applanationstonometrie In Ophthalmologica. Vol. 134.
P. 221-242.
Mansurov, G.K. et al. 2018. Monolithic three-chambered
pneumatic throttle sensor with integrated channels for
continuous non-invasive blood pressure measurement.
Patent application 2018106865.
Peňáz, J., 1973. Photoelectric measurement of blood
pressure, volume and flow in the finger. In Digest of the
10th International Conference on Medical and
Biological Engineering, Dresden, p.104.
Settels, J.J., 2014. Non-invasive Arterial Pressure
Monitoring. In Monitoring Technologies in Acute Care
Environments, ed. Ehrenfeld J.M., Cannesson M.
Springer, New York, P. 87-107.
Non-Invasive Blood Pressure Monitoring Based on Pulse Wave Recording with a New Three-channel Pneumatic Sensor
273
