
The Complexity of Social Media Response: Statistical Evidence for
One-dimensional Engagement Signal in Twitter
Damian Konrad Kowalczyk
1,2 a
and Lars Kai Hansen
2 b
1
Microsoft Development Center Copenhagen, Kanalvej 7, 2800 Kongens Lyngby, Denmark
2
DTU Compute, Matematiktorvet 303B, 2800 Kongens Lyngby, Denmark
Keywords:
Social, Influence, Engagement, Virality, Popularity, Twitter.
Abstract:
Many years after online social networks exceeded our collective attention, social influence is still built on
attention capital. Quality is not a prerequisite for viral spreading, yet large diffusion cascades remain the hall-
mark of a social influencer. Consequently, our exposure to low-quality content and questionable influence is
expected to increase. Since the conception of influence maximization frameworks, multiple content perfor-
mance metrics became available, albeit raising the complexity of influence analysis. In this paper, we examine
and consolidate a diverse set of content engagement metrics. The correlations discovered lead us to propose
a new, more holistic, one-dimensional engagement signal. We then show it is more predictable than any indi-
vidual influence predictors previously investigated. Our proposed model achieves strong engagement ranking
performance and is the first to explain half of the variance with features available early. We share the detailed
numerical workflow to compute the new compound engagement signal. The model is immediately applica-
ble to social media monitoring, influencer identification, campaign engagement forecasting, and curating user
feeds.
1 SOCIAL MEDIA
ENGAGEMENT
The unprecedented amount of attention aggregated by
online social networks comes under intense criticism
in the recent years (Bueno, 2016; Wu, 2017; Beyers-
dorf, 2019; Bybee and Jenkins, 2019), as billions are
now exposed to low-quality content and questionable
influence. Platforms like Facebook and Twitter, of-
fer an unparalleled opportunity for influence analysis
and maximization, impacting public opinion, culture,
policy, and commerce (Davenport and Beck, 2001).
Extant work on influence analysis focuses on ho-
mogeneous information networks and attributes the
greatest influence to authors triggering the largest dif-
fusion cascades (Franck, 2019). When the author’s
influence is modeled as the ability to maximize the
expected spread of information in the network (Pez-
zoni et al., 2013; Eshgi et al., 2019), the most desir-
able user-generated content is the one propagated fur-
thest, in Twitter measured by the number of retweets.
Propagation metrics however (retweet count in partic-
a
https://orcid.org/0000-0002-5612-0859
b
https://orcid.org/0000-0003-0442-5877
ular), do not capture the average individual attention
received. Retweet action does not inform, e.g., if the
actor has actually read the content, let alone consider
the source or whether that effort was left to the fol-
lowers. Meanwhile, the abundance of information to
which we are exposed through online social networks
is exceeding our capacity to consume it (Weng et al.,
2012), let alone in a critical way. Work presented
in (Weng et al., 2012; Qiu et al., 2017) shows that
content quality is not a prerequisite for viral spread-
ing, and (Lorenz-Spreen et al., 2019) shows that the
competition for our attention is growing, causing indi-
vidual topics to receive even shorter intervals of col-
lective attention. Accordingly, our exposure to low-
quality information and, by extension low-quality in-
fluence is increasing (Table 1).
Today, the digital footprint of an audience goes
Table 1: Four popular tweets ranked by the most prevalent
influence predictor: size of diffusion triggered in the net-
work, in Twitter measured by the number of retweets.
T
weet (body)
Retweets Replies F
avorites
”ZOZO
TOWN新春セルが史上最速で取高100を先ほ(...)”
4.5M 357.4K 1.3M
”HELP
ME PLEASE. A MAN NEEDS HIS NUGGS”
3.47M 37K 0.99M
”If
only Bradley’s arm was longer. Best photo ever. #oscars”
3.21M 215K 2.29M
”No
one is born hating another person because of the color
of his skin or his background or his religion...”
1.61M 69K 4.44M
918
Kowalczyk, D. and Hansen, L.
The Complexity of Social Media Response: Statistical Evidence for One-dimensional Engagement Signal in Twitter.
DOI: 10.5220/0009169709180925
In Proceedings of the 12th International Conference on Agents and Artificial Intelligence (ICAART 2020) - Volume 2, pages 918-925
ISBN: 978-989-758-395-7; ISSN: 2184-433X
Copyright
c
2022 by SCITEPRESS – Science and Technology Publications, Lda. All rights reserved

far beyond the retweet action. Platforms like Face-
book and Twitter record an increasingly diverse set of
user behaviors, including number of clicks, replies or
favorites (likes). Since the work of (Pezzoni et al.,
2013), Twitter has made many of these metrics avail-
able to the public, inviting a more holistic approach
to influence modeling, albeit rising the complexity of
all dependent tasks. Consequently, few studies to date
systematically investigate how to model the strength
of influence in heterogeneous information networks,
and the processes that drive popularity in our limited-
attention world remain mostly unexplored (Franck,
2019; Weng et al., 2012).
The four Tweets in Table 1 illustrate that the
mechanisms leading to high engagement are com-
plex. In the following work, we investigate the multi-
dimensional response of on-line audiences to under-
stand this complexity. We examine and consolidate
multiple discrete engagement metrics towards a new
compound engagement signal. While the new signal
is statistically motivated, we next show the relevance
of the signal for understanding engagement in mul-
tiple datasets. In particular, we show that the new
signal is more predictable than the individual met-
rics (e.g., diffusion size measured by retweet count)
prevalent in literature. Our engagement model is the
first to explain half of the variance with features avail-
able early, and to offer strong (Cohen, 1988) ranking
performance simultaneously. We provide the work-
flow for calculating the new compound engagement
signal from the raw count.
The contributions of this paper are summarized as
follows:
1. Parallel analysis of three individual content per-
formance signals, showing evidence of one-
dimensional engagement signal on Twitter
2. new compound engagement formula, capturing
over 75% of variance in available engagement sig-
nals
3. advancing feature representation of user gener-
ated content on Twitter, to consider increasingly
popular ’quote tweets’, validated on two real-
world datasets
4. two new engagement models (response and popu-
larity), delivering strong ranking performance
5. new state-of-the-art in virality prediction on Twit-
ter
6. finally, a new more holistic, compound engage-
ment model, first to explain half of the variance
with content features available at the time of post-
ing, and to offer strong ranking performance si-
multaneously
2 METHODOLOGY
In this section we describe the application of unsuper-
vised learning towards contributions (1,2,6), data col-
lection and feature extraction approach towards con-
tribution (1,3), and the chosen supervised method to-
wards contributions (4,5,6).
2.1 Principal Engagement Component
We acquire the multivariate set of responses forming
the ground truth vector:
e
gt
= [e
retweets
, e
replies
, e
favorites
]
T
. (1)
Recent work on engagement modeling, e.g., (Lee
et al., 2018) defines any response as a sign of engage-
ment, effectively reducing the multivariate response
to a one-dimensional signal. However, to our knowl-
edge, the complexity of the engagement signal has not
been explored more formally. While it appears cred-
ible that the population response signals,i.e., the di-
mensions of the of vector e, are highly correlated, we
can test the effective dimension of the space popu-
lated by the vectors using so-called Parallel Analysis
(PA) (Horn, 1965; Jorgensen and Hansen, 2011). In
PA principal component analysis of the measured sig-
nals is compared with the distribution of the princi-
pal components of null data obtained by permutation
under a (null) hypothesis that there is no dependency
between the individual response signals. Consistent
with this hypothesis, we can permute the sequence of
the signals for each observation separately. In particu-
lar, we compute the upper 95%quantile for the distri-
bution of the eigenvalues in the permuted data. Eigen-
values of the original unpermuted data set that reject
the null hypothesis are considered ”signal”.
Principal components are computed on the re-
sponse signals subject to a variance stabilization
transformation,
e = ln(e
gt
+ 1), (2)
see e.g., (Can et al., 2013; Kowalczyk and Larsen,
2019).
2.2 Projection on the Engagement
Component
Hypothesizing a one-dimensional engagement signal,
we compute the value as the projection on the first
principal component of the transformed data of di-
mension D = 3,
E
1
=
D
∑
i=1
w
i
(ln(e
i
+ 1) − µ
i
), (3)
The Complexity of Social Media Response: Statistical Evidence for One-dimensional Engagement Signal in Twitter
919
where µ
i
=
1
N
∑
N
n=1
ˆe
i,n
is the i’th component of the
D-dimensional mean vector for a sample of size N,
while w
i
is the i’th component of the first principal
component, computed on the same sample.
2.3 Gradient Boosted Regression Trees
(GBRT)
We consider the problem of predicting audience en-
gagement for a given tweet based on features avail-
able immediately after its delivery (Table 3). Features
describing the author are used together with the con-
tent, language, and temporal descriptors to predict the
size of retweet cascade, number of likes, number of
replies, and the proposed compound engagement sig-
nal. GBRT is a tree ensemble algorithm that builds
one regression tree at a time by fitting the residual of
the trees that preceded it. The training process mini-
mizing a chosen twice-differentiable loss function can
be described as:
θ
∗
= arg min
θ
N
∑
i=1
L
SE
( ˆe
i
, e
i
), (4)
where θ contains all parameters of the proposed
model, N is the number of examples, and L
SE
is the
squared error of an individual prediction,
L
SE
(e, ˆe) = (e − ˆe)
2
. (5)
We follow (Can et al., 2013; Kowalczyk and Larsen,
2019) to stabilize variance of all individual engage-
ment signals via log-transformation as in Equation 2.
2.3.1 Gradient Boosting Framework
We use Microsoft’s implementation of Gradient
Boosted Decision Trees (Ke et al., 2017) for model
training and tuning. LightGBM offers accurate han-
dling of categorical features by applying (Fisher,
1958), which limits the dimensionality of our tasks.
3 DATA COLLECTION
Recent work on social network analysis re-
emphasizes the importance of dataset size, to
make reliable predictions from representative sam-
ples. The larger the dataset, the better the accuracy
and consistency of a predictive model because it
minimizes the possibility of bias. However, as argued
by (Agarwal et al., 2019), this intuition is incom-
plete. Relying solely on short timeframe samples or
keyword-based crawling can produce a large dataset
full of noise and irrelevant (Bhattacharya et al., 2017)
data. Careful collection and filtering strategies, in
addition to large-scale sampling, are critical for
building datasets representative of the population and
engagement modeling at scale.
3.1 Unique Tweets
We use Twitter Historical PowerTrack APIs to collect
training and validation datasets described in Table 2.
Retroactive filtering of Twitter archives allows close
reproduction of datasets used in prior work (where
still public) e.g., (Wang et al., 2018; Kowalczyk and
Larsen, 2019). Historical PowerTrack API also en-
ables near-uniform sampling across long time-frames
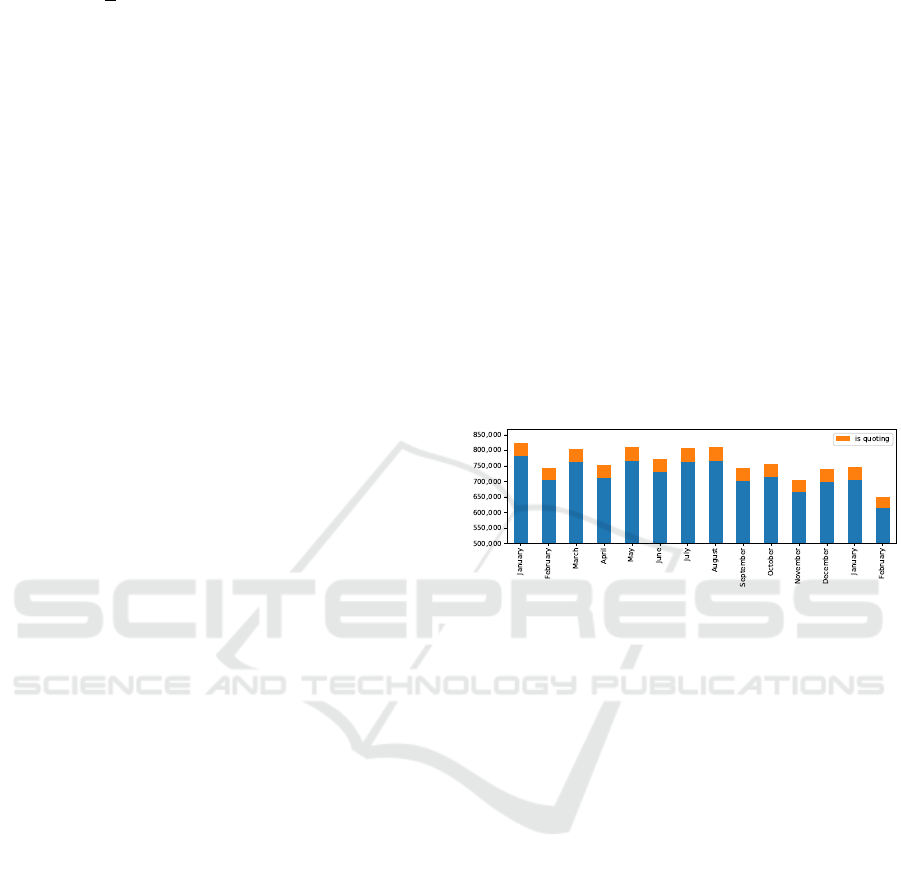
(Figure 1), to increase the proportion of the popula-
tion in a sample, as motivated by (Kim et al., 2018).
Collecting a dataset similar to T2017-ML by sam-
pling Twitter Firehose prevalent in prior work, would
have taken 14 months.
Figure 1: T2017-ML volume per month: Historical APIs
allow near uniform sampling of large-scale data to ensure
higher proportion of the population in a sample.
3.2 Engagement Totals
Three content engagement metrics are made pub-
licly available by Twitter since 2015. We use Twit-
ter’s Engagement Totals API to retrieve the number
of retweets, replies, and favorites ever registered for
each tweet (even if removed later via unlike or ac-
count suspension). Use of the Engagement Totals API
ensures 100% accuracy of our supervisory vector of
response signals e.
3.3 Sentiment Prediction
(Hansen et al., 2011; Kowalczyk and Larsen, 2019)
show the impact of sentiment on tweet’s virality
(retweetability). We reuse sentiment predictions from
(Kowalczyk and Larsen, 2019) for all tweets in the
validation datasets to explore correlation with other
engagement metrics and ensure fair comparison with
previous results. The analysis was performed for
tweets in 18 languages, using Text Analytics APIs
from Microsoft Cognitive Services (Microsoft, 2017).
ICAART 2020 - 12th International Conference on Agents and Artificial Intelligence
920

Table 2: Datasets acquired.
Dataset T2016-IMG T2017-ML T2018-ML
introduced Wang (2018) Kowalczyk (2018) now
w/image only True False False
languages English 18 all
months total 3 14 12
month from 2016.10 2017.01 2018.01
unique tweets 2,848,892 9,719,264 29,883,324
quoting 421,175 583,514 2,647,072
retweets total 5,929,850 11,361,699 42,919,158
replies total 717,644 3,576,976 12,414,907
favorites total 12,665,657 29,138,707 134,523,998
no engagement 1,547,829 5,689,501 14,813,772
3.4 Datasets
Table 2 offers a summary of three datasets collected
for this study.
1. T2016-IMG to evaluate our feature representa-
tion and training method in comparison with the
work of (Mazloom et al., 2016; McParlane et al.,
2014; Khosla et al., 2014; Cappallo et al., 2015;
Wang et al., 2018; Kowalczyk and Larsen, 2019).
The dataset matches the same filters, as applied
before (timeframe, language code or the presence
of an image attachment).
2. T2017-ML to evaluate the generalizability of
our resulting models across seasons and lan-
guages (cultures) and comparison with the work
of (Kowalczyk and Larsen, 2019). This dataset
represents a near-uniform sample of Twitter 2017
volume in all 18 languages supported by the sen-
timent analysis service (Microsoft, 2017).
3. T2018-ML to evaluate the generalizability of our
compound engagement signal across years. This
dataset represents a near-uniform sample of entire
Twitter 2018 volume in all known languages. In
this study, T2018-ML dataset is used in unsuper-
vised experiments only.
Datasets T2016-IMG and T2017-ML are split into
70% training, 20% test and 10% validation sets. To
aid reproducibility, we share unique ID’s of acquired
tweets along with sentiment predictions.
3.4.1 Privacy Respecting Storage
The data analyzed in this study is publicly available
during collection. How much of it remains public, can
change rapidly afterward. We follow the architecture
proposed by (Kowalczyk and Larsen, 2019) to secure
the data in a central highly scalable database, exposed
to applicable privacy requests from Twitter’s Compli-
ance Firehose API, and to feature extraction requests
from our Spark cluster.
Table 3: Feature representation summary.
Feature Representation Skewness Quoted
†
followers count ordinal 0.212 True
friends count ordinal -0.321 True
account age (days) ordinal 0.203 True
statuses count ordinal -0.665 True
actor favorites count ordinal -1.023 True
actor listed count ordinal 0.687 True
actor verified categorical - True
body length ordinal -1.426 True
mention count ordinal 3.820 True
hashtag count ordinal 5.808 True
media count ordinal 3.203 True
url count ordinal 1.449 True
language code categorical - True
sentiment value continuous -0.014 False
posted hour ordinal -0.058 False
posted day ordinal 0.021 False
posted month ordinal 0.210 False
retweet count label 6.091 n/a
reply count label 2.330 n/a
favorite count label 3.122 True
†
if True, additional feature is extracted from the quoted
tweet.
3.4.2 Feature Extraction
Table 3 describes features extracted from each tweet.
To ensure scalability in production, only the informa-
tion available at the time of engagement is considered.
In 2015 Twitter introduced ‘quote retweets’ (or ‘quote
RTs’) impacting political discourse and its diffusion
as shown by (Garimella et al., 2016). Over 3.5 million
tweets collected for this study quote another (Table 2).
We extend the feature representation by (Kowalczyk
and Larsen, 2019) to represent them. Table 3 shows
in bold, an additional 14 unique features computed for
quoted RT’s. We log-transform highly skewed (count
of followers, friends, statuses, and number of times
the actor has been listed) to stabilize variance.
4 RESULTS
We begin with examining all available content per-
formance signals (count of retweets, replies and fa-
vorites) in the extended time-frame datasets. We look
for potential correlations that could enable reducing
the dimension of engagement using Parallel Analysis.
In the supervised experiments, first we evaluate our
methodology and feature representation against pre-
vious state-of-the-art methods, by modelling the indi-
vidual influence metrics (e.g. virality) and the com-
pound engagement on the benchmark dataset T2016-
IMG. Finally we evaluate the generalizability of our
method across topics and cultures, modeling engage-
ment on the multilingual extended-timeframe dataset
T2017-ML.
The Complexity of Social Media Response: Statistical Evidence for One-dimensional Engagement Signal in Twitter
921

1 2 3
Eigenvalue #
0
5
10
Variance
10
5
Figure 2: Parallel Analyses of the response signals for the
2017 data set provide evidence for a one-dimensional en-
gagement signal: Only the first component (’1’- red dotted
line) exceeds the 95% quantile of the corresponding eigen-
value in the null hypothesis (blue dashed line).
4.1 Evidence for a One-dimensional
Engagement Signal
We perform Parallel Analysis and compute the prin-
cipal components and their associated projected vari-
ances for the log-transformed data as well as for
Q = 100 permutations of the data assuming the no
correlation null. The one-sided upper 95% quantile
is computed from the permuted samples. Variances
of the un-permuted signals and the 95% quantiles for
the three eigenvalues of the permuted data are shown
in figure 2. Very similar results are obtained for the
2018 data set (not shown).
4.2 The Engagement Signal
We perform principal component analysis of the two
data sets keeping a single principal component. The
mean vectors and projections are found in Table 4.
The variance explained by the first components in the
three analyses: 2016 : 83%, 2017 : 72%,2018 : 77%.
Table 4: First principal components of the extended time-
frame engagement signals, used to compute the one-
dimensional compound engagement (see Equation 3).
retweets replies favorites
w
1
µ
1
w
2
µ
2
w
3
µ
3
T2017-ML 0.451 0.049 0.145 0.082 0.880 0.148
T2018-ML 0.450 0.066 0.188 0.080 0.872 0.205
4.3 Predicting Engagement
Metrics. We compute the Spearman ρ ranking co-
efficients to measure each model’s ability to rank the
content depending on the definition of engagement.
We compute the relative measure of fit R
2
to compare
the variance explained in the compound engagement
and in the individual engagement signals. The abso-
lute measure of fit (RMSE) is chosen as an objective
of optimization, to penalize large errors and relative
insensitivity to outliers. The p-value for all reported
ρ results is p < 0.001. Each metric is an average from
3-fold cross-validation. SciPy version 1.3.1 is used to
ensure ρ tie handling. Interpretation of R
2
and Spear-
man ρ is domain-specific, with guidelines for social
and behavioral sciences proposed by (Cohen, 1988).
Representation. First round of our supervised ex-
periments focus on evaluating our user-generated
content feature representation and GBRT approach
against previous state-of-the-art methods, in model-
ing established engagement signals, like the size of
diffusion (e.g., retweet count), response (i.e., num-
ber of replies) and popularity (i.e., number of fa-
vorites/likes), before attempting to predict the com-
pound engagement. Table 5 shows the performance
of our GBRT with RMSE objective and new fea-
ture representation. Features extracted from the
quoted content did not provide a significant boost over
SOTA, likely due to visual modality dominating in the
T2016-IMG dataset, as considered by (Wang et al.,
2018). The approach did, however, match the per-
formance of (Kowalczyk and Larsen, 2019) in viral-
ity ranking, and achieves strong (Cohen, 1988) per-
formance without considering image modality. Ap-
plied to predict the new compound engagement, it
sets a new benchmark for content engagement rank-
ing ρ = 0.680.
Table 5: Method evaluation on the T2016-IMG dataset.
Method R
2
ρ RMSE
(McParlane et al., 2014)
†
- 0.257 -
(Khosla et al., 2014)
†
- 0.254 -
(Cappallo et al., 2015)
†
- 0.258 -
(Mazloom et al., 2016)
†
- 0.262 -
(Wang et al., 2018)
†
- 0.350 -
(Kowalczyk and Larsen, 2019) 0.391 0.504 0.555
virality (retweets) 0.393 0.504 0.554
response (replies) 0.239 0.384 0.290
popularity (favorites) 0.500 0.656 0.665
engagement (compound) 0.501 0.680 0.341
†
independent evaluation by (Wang et al., 2018)
Engagement The second round of supervised exper-
iments focuses on the scalability and generalizabil-
ity of our approach across topics and cultures (lan-
guages). Table 6 shows the performance of our en-
gagement models on the multilingual extended time-
frame dataset. Predicting the number of retweets with
our new feature representation outperforms (Kowal-
czyk and Larsen, 2019), offering new state-of-the-art
in virality ranking. Response and popularity models
ICAART 2020 - 12th International Conference on Agents and Artificial Intelligence
922
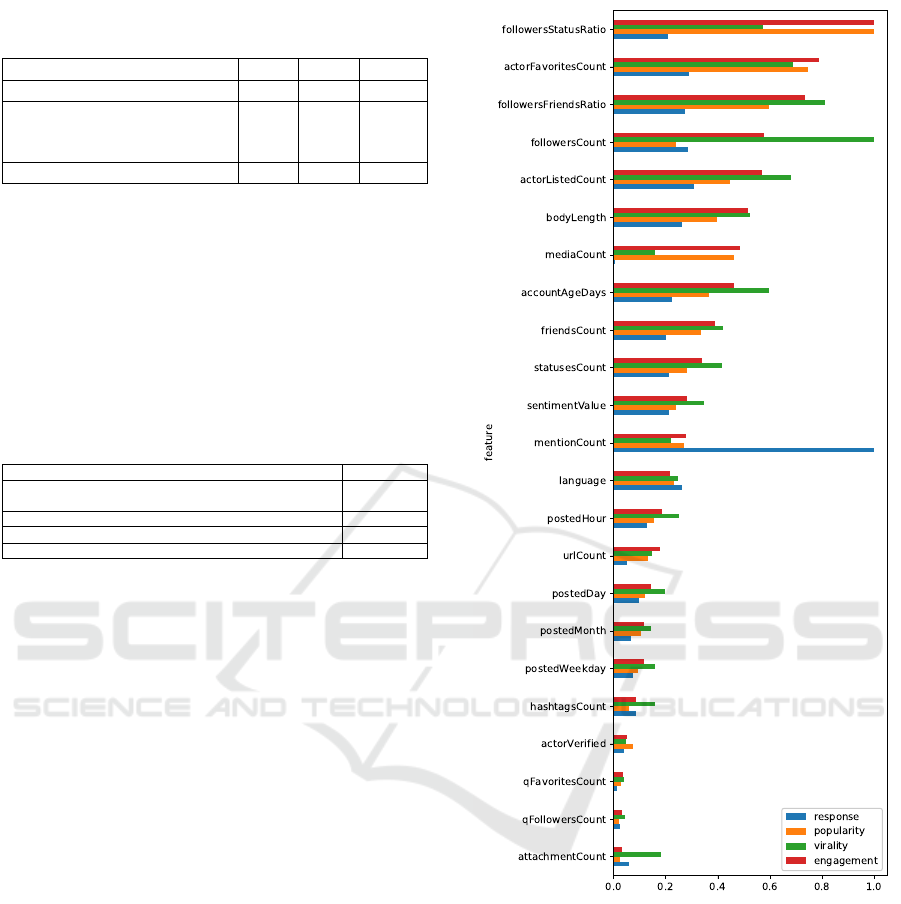
Table 6: Engagement prediction performance on T2017-
ML dataset. SD < 0.001 across 3-fold CV.
Method R
2
ρ RMSE
(Kowalczyk and Larsen, 2019) 0.402 0.369 0.336
virality (retweets) 0.425 0.371 0.329
response (replies) 0.302 0.512 0.292
popularity (favorites) 0.493 0.526 0.484
engagement (compound) 0.507 0.529 0.228
achieve strong (Cohen, 1988) ranking performance on
T2017-ML. The compound engagement model again
shows an increase in ranking performance over all
individual engagement models, setting a new bench-
mark for engagement variance explained R
2
= 0.507.
Table 7 offers a real-world illustration of the rank-
ing performance, in comparison with diffusion-based
ranking (Table 1).
Table 7: Four popular tweets, ranked by the new compound
engagement metric.
Tweet (body) Engagement
”No one is born hating another person because of the color
of his skin or his background or his religion...”
9.283
”If only Bradley’s arm was longer. Best photo ever. #oscars” 9.266
”ZOZOTOWN新春セルが史上最速で取高100を先ほ(...)” 9.158
”HELP ME PLEASE. A MAN NEEDS HIS NUGGS” 8.822
4.4 Feature Importance
Figure 3 offers a comparison of feature importance
between all engagement models trained on the T2017-
ML dataset. The importance equals total gains of
splits which use the feature, averaged across 3-folds
and rescaled to [0, 1] for comparison across all en-
gagement models. The uncertainty for virality fea-
tures does not exceed 6%. When predicting response
(i.e., number of replies), we find the number of users
mentioned to have the highest predictive value, while
the number of image attachments (i.e., media count)
to have almost none. The number of followers, most
popular in all prior work on virality prediction is
fourth when predicting compound engagement. The
average number of followers received with each sta-
tus or number of times the author liked another tweet
is far more predictive of compound engagement.
5 CONCLUSION
In this study, we have analyzed the complexity of the
multivariate response of users engaging with social
media. We have employed large-timeframe collec-
tion and filtering strategies to build datasets of unique
tweets that could better represent Twitter’s popula-
tion. We have acquired, examined, and consolidated
various response (engagement) metrics available for
Figure 3: Relative feature importance depending on the def-
inition of engagement (top 23 out of 31 features).
each of the tweets. The significant correlation found
between individual response signals leads us to pro-
pose a new one-dimensional compound engagement
signal. We showed on multiple benchmark datasets,
that compound engagement is more predictable than
any individual engagement signal, most notably the
number of retweets, measuring the size of diffu-
sion cascade, predominant in influence maximization
frameworks. (Franck, 2019; Eshgi et al., 2019).
Our compound engagement model is the first to
explain half of the variance with features available at
the time of posting, and to offer strong (Cohen, 1988)
The Complexity of Social Media Response: Statistical Evidence for One-dimensional Engagement Signal in Twitter
923

ranking performance simultaneously. The model is
ready for production with immediate application to
social media monitoring, campaign engagement fore-
casting, influence prediction, and maximization. We
propose the ability to engage the audience as a new,
more holistic baseline for social influence analysis.
We share the compound engagement workflow and
parameters (Eq. (3) and Table (4)) to ensure repro-
ducibility and inspire future work on engagement
modeling. We hope the future work will balance any
negative impact of diffusion-based influence maxi-
mization, on our collective attention and well-being.
ACKNOWLEDGEMENTS
This project is supported by Microsoft Development
Center Copenhagen and the Danish Innovation Fund,
Case No. 5189-00089B. We would like to acknowl-
edge the invaluable support of Sandeep Aparajit, J
¨
org
Derungs, Ralf Gautschi, Tomasz Janiczek, Charlotte
Mark, Pushpraj Shukla and Walter Sun. Any opin-
ions, findings, conclusions or recommendations ex-
pressed in this material are those of the authors and
do not necessarily reflect those of the sponsors.
REFERENCES
Agarwal, N., Dokoohaki, N., and Tokdemir, S., editors
(2019). Emerging Research Challenges and Opportu-
nities in Computational Social Network Analysis and
Mining. Lecture Notes in Social Networks. Springer
International Publishing, Cham.
Beyersdorf, B. (2019). Regulating the Most Accessible
Marketplace of Ideas in History: Disclosure Require-
ments in Online Political Advertisements after the
2016 Election. California Law Review, 107.
Bhattacharya, N., Arpinar, I. B., and Kursuncu, U. (2017).
Real Time Evaluation of Quality of Search Terms dur-
ing Query Expansion for Streaming Text Data Us-
ing Velocity and Relevance. In Proceedings - IEEE
11th International Conference on Semantic Comput-
ing, ICSC 2017, pages 280–281. Institute of Electrical
and Electronics Engineers Inc.
Bueno, C. C. (2016). The Attention Economy: Labour, Time
and Power in Cognitive Capitalism. Rowman & Lit-
tlefield International.
Bybee, K. J. and Jenkins, L. (2019). Free Speech, Free
Press, and Fake News: What If the Marketplace of
Ideas Isn’t About Identifying Truth? SSRN Electronic
Journal.
Can, E. F., Oktay, H., and Manmatha, R. (2013). Predicting
retweet count using visual cues. In Proceedings of the
22nd ACM international conference on Conference on
information & knowledge management - CIKM ’13.
Cappallo, S., Mensink, T., and Snoek, C. G. (2015). Latent
Factors of Visual Popularity Prediction. In Proceed-
ings of the 5th ACM on International Conference on
Multimedia Retrieval - ICMR ’15.
Cohen, J. (1988). Statistical Power Analysis for the Behav-
ioral Sciences. Lawrence Erlbaum Associates.
Davenport, T. H. and Beck, J. C. (2001). The attention
economy: Understanding the new currency of busi-
ness. Harvard Business Press.
Eshgi, S., Maghsudi, S., Restocchi, V., Stein, S., and Tassiu-
las, L. (2019). Efficient influence maximization under
network uncertainty. In INFOCOM 2019 Workshop
proceedings.
Fisher, W. D. (1958). On Grouping For Maximum Homo-
geneity. American Statistical Association Journal.
Franck, G. (2019). The economy of attention. Journal of
Sociology, 55(1):8–19.
Garimella, K., Weber, I., and De Choudhury, M. (2016).
Quote rts on twitter: Usage of the new feature for po-
litical discourse. In Proceedings of the 8th ACM Con-
ference on Web Science, WebSci ’16, pages 200–204,
New York, NY, USA. ACM.
Hansen, L. K., Arvidsson, A., Nielsen, F. A., Colleoni, E.,
and Etter, M. (2011). Good friends, bad news - Affect
and virality in twitter. In Communications in Com-
puter and Information Science.
Horn, J. L. (1965). A rationale and test for the number of
factors in factor analysis. Psychometrika, 30(2):179–
185.
Jorgensen, K. W. and Hansen, L. K. (2011). Model selection
for gaussian kernel pca denoising. IEEE transactions
on neural networks and learning systems, 23(1):163–
168.
Ke, G., Meng, Q., Wang, T., Chen, W., Ma, W., Liu, T.-
Y., Finley, T., Wang, T., Chen, W., Ma, W., Ye, Q.,
and Liu, T.-Y. (2017). LightGBM: A highly efficient
gradient boosting decision tree. Advances in Neural
Information Processing Systems.
Khosla, A., Das Sarma, A., and Hamid, R. (2014). What
makes an image popular? In Proceedings of the 23rd
international conference on World wide web - WWW
’14.
Kim, H., Jang, S. M., Kim, S.-H., and Wan, A. (2018).
Evaluating Sampling Methods for Content Analy-
sis of Twitter Data. Social Media + Society,
4(2):205630511877283.
Kowalczyk, D. K. and Larsen, J. (2019). Scalable Privacy-
Compliant Virality Prediction on Twitter. In Proceed-
ings of AffCon 2019 @ AAAI, volume 2328, pages 12–
27.
Lee, D., Hosanagar, K., and Nair, H. S. (2018). Advertis-
ing content and consumer engagement on social me-
dia: evidence from facebook. Management Science,
64(11):5105–5131.
Lorenz-Spreen, P., Mønsted, B. M., H
¨
ovel, P., and
Lehmann, S. (2019). Accelerating dynamics of collec-
tive attention. Nature Communications, 10(1):1759.
Mazloom, M., Rietveld, R., Rudinac, S., Worring, M., and
van Dolen, W. (2016). Multimodal Popularity Pre-
diction of Brand-related Social Media Posts. In Pro-
ICAART 2020 - 12th International Conference on Agents and Artificial Intelligence
924

ceedings of the 2016 ACM on Multimedia Conference
- MM ’16.
McParlane, P. J., Moshfeghi, Y., and Jose, J. M. (2014).
”Nobody comes here anymore, it’s too crowded”; Pre-
dicting Image Popularity on Flickr. Proceedings of
International Conference on Multimedia Retrieval -
ICMR ’14.
Microsoft (2017). Cognitive Services APIs refer-
ence. https://westus.dev.cognitive.microsoft.com/
docs/services/TextAnalytics.V2.0/. Accessed: 2018-
09-05.
Pezzoni, F., An, J., Passarella, A., Crowcroft, J., and Conti,
M. (2013). Why do I retweet it? An information prop-
agation model for microblogs. In Lecture Notes in
Computer Science (including subseries Lecture Notes
in Artificial Intelligence and Lecture Notes in Bioin-
formatics).
Qiu, X., F. M. Oliveira, D., Sahami Shirazi, A., Flammini,
A., and Menczer, F. (2017). Limited individual at-
tention and online virality of low-quality information.
Nature Human Behaviour, 1(7):0132.
Wang, K., Bansal, M., and Frahm, J. M. (2018). Retweet
wars: Tweet popularity prediction via dynamic multi-
modal regression. In Proceedings - 2018 IEEE Win-
ter Conference on Applications of Computer Vision,
WACV 2018.
Weng, L., Flammini, A., Vespignani, A., and Menczer, F.
(2012). Competition among memes in a world with
limited attention. Scientific reports, 2:335.
Wu, T. (2017). The attention merchants: The epic scramble
to get inside our heads. Vintage.
The Complexity of Social Media Response: Statistical Evidence for One-dimensional Engagement Signal in Twitter
925
