
Hybrid Fuzzy Binning for Near-duplicate Image Retrieval:
Combining Fuzzy Histograms and SIFT Keypoints
Afra’a Ahmad Alyosef and Andreas N
¨
urnberger
Department of Technical and Business Information Systems, Faculty of Computer Science,
Otto von Guericke University Magdeburg, Germany
Keywords:
Near-duplicate Image Retrieval, Fuzzy Histogram, HSV Color Histogram, SIFT Keypoints.
Abstract:
Near-duplicate image retrieval is still a challenging task, especially due to issues with matching quality and
performance. Most existing approaches use high dimensional vectors based on local features such as SIFT
keypoints to represent images. The extraction and matching of these vectors to detect near-duplicates are time
and memory consuming. Global features such as color histograms can strongly reduce the dimensionality of
image vectors and significantly accelerate the matching process. On the other hand, they strongly decrease the
quality of the retrieval process. In this work, we propose a hybrid approach to improve the quality of retrieval
and reduce the computation time by applying a robust filtering process using global features optimized for
recall followed by a ranking process optimized for precision. For efficient filtering we propose a fuzzy partition
hue saturation (HS) histogram to retrieve a subset of near-duplicate candidate images. After that, we re-rank
the top retrieved results by extracting the SIFT features. In order to evaluate the performance and quality of
this hybrid approach, we provide results of a comparative performance analysis using the original SIFT-128D,
the HS color histogram, the fuzzy HS model (F-HS), the proposed fuzzy partition HS model (FP-HS) and
the combination of the proposed fuzzy partition HS histogram with the SIFT features using large scale image
benchmark databases. The results of experiments show that applying the fuzzy partition HS histogram and
re-rank the top results (only 6%) of the retrieved images) using the SIFT algorithm significantly outperforms
the use of the individual state of art methods with respect to computing efficiently and effectively.
1 INTRODUCTION
Several major issues of image near-duplicate retrieval
(NDR) have been discussed in a lot of previous contri-
butions (Chum et al., 2007; Chu et al., 2013; Xu et al.,
2010) to reduce the size of image datasets by find-
ing out images that belong to the same scene but are
taken of different perspectives, lightness conditions,
cameras, or scales. Furthermore, NDR has been in-
troduced in (Auclair et al., 2009), to detect copyright
violations and in (Alyosef and N
¨
urnberger, 2019) to
identify the relation between zoomed-in images and
whole scene (i.e., zoomed-in retrieval (ZIR)). Key-
point features are extracted upon local distinct regions
of an image. The main research in NDR has focused
on using highly discriminative image features specifi-
cally, the scale-invariant feature detector and descrip-
tor (SIFT). Since they are invariant to a number of im-
age deformations such as affine transformation, view-
point or lightness change and adding noise or blur
to images. The descriptors of these features are high
dimensional vectors. Therefore, their extraction and
matching are time and memory consuming. Global
features such as color features represent images using
vectors of fixed length. The extraction and match-
ing of global features are faster than keypoints but
they produce lower performance than keypoint fea-
tures in solving retrieval tasks. In this work, we con-
struct our hybrid approach by combining the benefits
of the HSV color features and SIFT features. The
advantage of this hybrid approach is decreasing the
required memory, accelerating the matching process
and improving the performance of NDR and ZIR.
The remainder of this paper is organized as fol-
lows. Section 2 reviews the relevant works to accel-
erate the NDR. Section 3 details the proposed hybrid
method. Section 4 presents the settings and results of
our experiments. Section 5 concludes the work.
Alyosef, A. and Nürnberger, A.
Hybrid Fuzzy Binning for Near-duplicate Image Retrieval: Combining Fuzzy Histograms and SIFT Keypoints.
DOI: 10.5220/0009169602410248
In Proceedings of the 9th International Conference on Pattern Recognition Applications and Methods (ICPRAM 2020), pages 241-248
ISBN: 978-989-758-397-1; ISSN: 2184-4313
Copyright
c
2022 by SCITEPRESS – Science and Technology Publications, Lda. All rights reserved
241

2 STATE OF ART
SIFT features have high dimensional descriptors (the
dimensionality of each descriptor is 128D). There-
fore, their extraction and matching are time and
memory consumption specifically for a large image
dataset. To overcome this problem, two varieties
of optimization have been discussed in the previous
works. The first optimization is to downscale the di-
mensionality of a SIFT descriptor to get a lower di-
mension descriptor and consequently accelerate the
matching process (Khan et al., 2011; Ke and Suk-
thankar, 2004; Alyosef and N
¨
urnberger, 2016). The
second optimization suggests accelerating the process
of feature indexing and matching. To achieve this,
the concept of a bag of features has been proposed
in (Li et al., 2014; Grauman and Darrell, 2007; Jiang
et al., 2015; Nist
`
er and Stew
`
enius, 2006). The fuzzy
c1
c2
c3 c4
Figure 1: Comparison of crisp clusters and fuzzy clusters of
histogram bins.
color histogram has been introduced by (Han and Ma,
2002), which built the fuzzy histogram by processing
the three channels of the RGB histogram simultane-
ously. The idea is to compute the distance between the
color value of each pixel of an image and all clusters.
To improve the performance of the SIFT algorithm in
fields of object detection and image retrieval the idea
of the color descriptor (instead of the grayscale de-
scriptor) has been introduced in (Bosch et al., 2008;
van de Sande et al., 2010). However, these methods
increase the dimensionality of the SIFT descriptor. In
this work, we aim to accelerate the matching process
to improve the performance of image NDR and ZIR
tasks.
3 HYBRID APPROACH
To accelerate and improve the retrieval performance
of image NDR and ZIR, we proposed our hybrid ap-
proach by first applying the fuzzy color histogram.
Second, re-rank the results using their SIFT features.
The following subsections detail our method.
3.1 Fuzzy HSV & Partition Fuzzy HSV
This section details our method in building the fuzzy
HSV histogram (F-HSV). To improve the retrieval
performance, we suggest dividing each image into
sub-images and constructing the fuzzy partition HSV
histogram (FP-HSV). The following subsections de-
tail our proposed model to build F-HSV and FP-HSV.
3.1.1 Fuzzy HSV Histogram
The HSV color space is created by merging the three
channels of RGB color space to get hue, saturation
and value channels (HSV). Hue defines the type of
color and its value belongs to the range [0
o
, 360
o
].
Saturation describes pureness of color and value de-
scribes the amount of light in color. The values of
saturation and value belong to the range [0, 255]. To
build the 3D HSV color histogram, we divide each
color channel into a specific number of clusters. Af-
ter that, we assign the HSV values of each pixel to the
closest cluster centers. Theses clusters produce bins
of the HSV color histogram. Based on this, we split
the hue channel into 30 clusters (bins) and each of
Saturation and value channels into 32 clusters. The
way of building clusters produce crisp clusters i.e.
each sample color contributes only in one bin (clus-
ter). Consider c
k
; k = 1, ...,L are centers of clusters,
where L is the number of clusters and r the radius of
cluster. The crisp clustering is defined as:
p(x|c
k
) =
(
1, if |x − c
k
| ≤ r
0, otherwise
(1)
Since the clusters here stand for the bin of the HSV
histogram, all clusters have the same radius r. To
build the fuzzy clusters, we apply the following steps:
• for each sample x, determine the cluster where the
sample belongs to using crisp clustering.
• compute the absolute distance between the sample
and all centers c
k
; k = 1, ..., L.
• assign the probability 1 −
d
k
2r
to the cluster c
k
where d
k
= |x − c
k
| ≤ r. Based on the location of
a sample to the center of cluster, assign the prob-
ability
d
2r
to c
k−1
or c
k+1
i.e.:
p(x|c
k
) = 1 −
d
2r
if x ≤ c
k
: p(x|c
k−1
) = 1 −
1 − d
2r
else if x > c
k
: p(x|c
k+1
) = 1 −
1 − d
2r
(2)
ICPRAM 2020 - 9th International Conference on Pattern Recognition Applications and Methods
242
• for samples that belong to the first cluster and sat-
isfy d
1
= |x − c
1
| ≤ r, we assign the both proba-
bility computed in Equation 2 to the first cluster.
• the same idea for the last cluster i.e. contribu-
tions are assigned to the last center for samples
that they belong to the last cluster and satisfy
d
L
= |x − c
L
| ≥ r.
• normalize the clusters of F-HSV utilizing the area
of the input image.
Figure 1 explains the difference between crisp and
fuzzy clustering in case of having four clusters.
3.1.2 Construction of 2D Fuzzy Histogram
In our practice study, we notice that the third dimen-
sion of HSV histogram, which is the value dimension,
decreases the performance of image NDR. The value
dimension measures the amount of lighting in color
therefore; any change in the lightness of colors causes
a significant change in the bins of value dimension.
Based on this, we consider only the hue and saturation
dimensions when we construct the color histogram
i.e., we construct the F-HS and FP-HS histograms in-
stead of F-HSV and FP-HSV. Section 4.3.1 shows the
comparison between the F-HSV and the F-HS mod-
els.
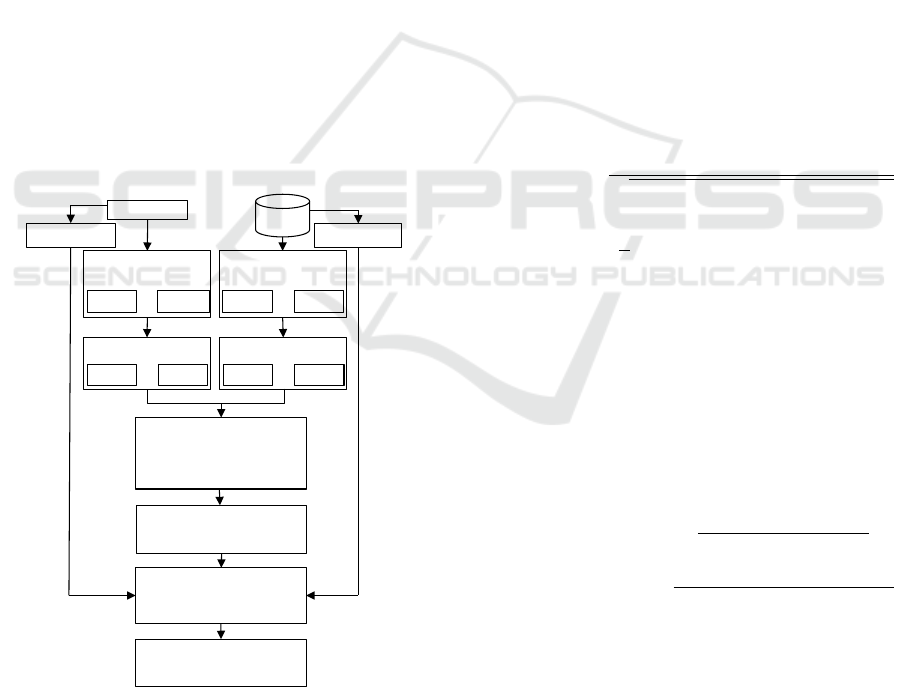
Image
dataset
Query Image
Extract SIFT features
Divide each image into
m
sub-images
sub-img
i_1
sub-img
i_m
…
Construct FP-HSV
FP-HSV
i_1
FP-HSV
i_m
…
Divide query image
into
m
sub-images
sub-img
q_1
sub-img
q_m
…
Construct FP-HSV
FP-HSV
q_1
FP-HSV
q_m
…
Compute the average correlation
avg_corr=
avg(corr(FP-HSV
q_j
,FP-HSV
i_j
)
Rank results based on decreasing
avg_corr
Compare SIFT features of Q and
the
N
top retrieved images
Extract SIFT features
Re-rank top
N
results based on
SIFT features
Figure 2: Flowchart of our proposed method.
3.1.3 Fuzzy Partition HS Histogram
To improve image NDR and ZIR by employing the
F-HS histogram, we suggest dividing each image into
a set of sub-images P. After that, we compute the
F-HS histogram for the whole image and for each
sub-image as described in Subsection 3.1.1. The set
of all F-HS histograms for all sub-images builds the
fuzzy partition HS histogram (FP-HS). The FP-HS
improves the performance of image NDR and ZIR
because it presents additional information about the
distribution of colors in images. Since the FP-HS
model considers the spatial distribution of colors, it
decreases the retrieving of non-relevant images.
3.1.4 Histogram Similarity Measures
Many methods have been suggested to measure the
similarity between two color histograms such as in-
tersection, Chi-Square, correlation and Earth mover
´
s
distance (P. Marin-Reyes, 2016). The idea of correla-
tion measure is to compare the distribution of two his-
tograms instead of the bin to bin comparison. There-
fore, we use in this work the correlation measure
by computing the mean µ and standard deviation σ
over all bins. The correlation Corr between two his-
tograms H
1
and H
2
is defined as (P. Marin-Reyes,
2016):
Corr(H
1
, H
2
) =
∑
L
i=1
(H
1,i
− µ
1
)(H
2,i
− µ
2
)
q
∑
L
i=1
(H
1,i
− µ
1
)
2
∑
L
i=1
(H
2,i
− µ
2
)
2
where µ =
1
L
L
∑
i=1
H
i
(3)
The values of Corr belong to the rang [−1, +1]. The
value of −1 means that there is no correlation be-
tween the histograms. Whereas, the value +1 implies
that histograms are identical. The complexity of this
measure is O(L) (P. Marin-Reyes, 2016). The cor-
relation between two fuzzy partitions HS histograms
of two near-duplicate images FP-HS
1
and FP-HS
2
is
defined as:
Corr(FP-HS
1
, FP-HS
2
) =
Corr(F-HS
1
, F-HS
2
)
P + 1
+
∑
P
i=1
Corr(F-HS
1i
, F-HS
2i
)
P + 1
(4)
In the case of zoomed-in / whole scene retrieval, we
compute the correlation between the F-HS
z
of the
zoomed-in image and both F-HS
w
and the set FP-
HS
wi
;i = 1, ..., P of a whole scene. After that, we mea-
sure the correlation between the zoomed-in and whole
scene images as the average of the highest two corre-
lations. Equation 5 describes the average correlation
in case of zoomed-in / whole scene retrieval, where
Hybrid Fuzzy Binning for Near-duplicate Image Retrieval: Combining Fuzzy Histograms and SIFT Keypoints
243

max
zw1
, max
zw2
are the highest two correlations.
avg-Corr(z, w) =
avg(max
zw1
, max
zw2
)
2
where
{max
zw1
, max
zw2
} = max{Corr(F-HS
z
, F-HS
w
),
{Corr(F-HS
z
, FP-HS
wi
); i = 1, ..., P}}
(5)
3.1.5 Complexity of F-HS & FP-HS
We compare the computation time of the traditional
HS, the F-HS and the FP-HS models to build color
histograms using the Ukbench dataset (the details of
this dataset are described in Subsection 4.1). Table 1
shows that the F-HS and FP-HS require a longer time
to generate their histograms than the crisp HS model.
However, the F-HS and FP-HS models significantly
improve the performance of image NDR (see Subsec-
tion 4.3.1) comparing to the HS histogram. Moreover,
F-HS and FP-HS still too faster than the SIFT algo-
rithm (which needs hours to complete the feature ex-
traction for the same image dataset). In addition, the
F-HS and the FP-HS models produce a lesser amount
of features than the SIFT algorithm. Hence, they ac-
celerate the matching process.
Table 1: Time computation of HS, F-HS and FP-HS his-
tograms using the Ukbench dataset.
Method HS F-HS FP-HS
Sub-images - - P = 3 P = 9
Time (Sec.) 151 273 381 530
3.2 SIFT Feature Extraction
In this work, we aim to present the effect of us-
ing the F-HS and FP-HS in improving the perfor-
mance of image NDR and ZIR. Therefore, in the
step of extracting the SIFT features we are not going
to discuss the optimized SIFT methods (Alyosef and
N
¨
urnberger, 2017a; Alyosef and N
¨
urnberger, 2017b;
Alyosef and N
¨
urnberger, 2016; Khan et al., 2011) in-
stead, we apply the original SIFT algorithm (Lowe,
2004) to extract the SIFT keypoints and build their
128 dimensions descriptors. The original SIFT algo-
rithm (Lowe, 2004) extracts features using grayscale
color space i.e. the color information play no role
in the building of descriptors. To match the key-
points, we utilize the Kd-tree and the best-bin-first
algorithm as described in (Lowe, 2004). However,
this method of matching obtains duplicate matches
i.e. a keypoint of one image may match with many
keypoints in the other one. To overcome this prob-
lem, we eliminate all duplicate matches except the
one which has the best matching score. This filtering
of matched features is important to reduce the number
of mismatched features. Further discussion to filter
the matched features have been discussed in (Alyosef
and N
¨
urnberger, 2019)
3.3 Re-rank the Top N Results
To optimize the NDR results obtained by the F-HS
and the FP-HS models, we apply the SIFT algorithm
on the top N retrieved results. Consequently, no need
to compare the SIFT features of a query image with
all SIFT features of dataset images. Instead, we com-
pare the features of a query image with only the top
N retrieved results where size(N) << size(Dataset).
In the Section 4, we discuss the suitable values for the
top N results. Figure 2 details the step of our method.
4 EVALUATION
We evaluate the performance of our hybrid model to
solve image NDR and ZIR tasks. We describe our
experiments as in the following subsections.
4.1 Datasets
In this work, since we aim to solve two tasks (i.e.
image NDR and ZIR), we decide to use two image
datasets. The first one is UKbench dataset which con-
tains 10200 images of 2550 various scenes (Nist
`
er and
Stew
`
enius, 2006). For each scene, there are four near-
duplicate images. We pick the first image as query
image and keep the rest three images in the dataset.
So we get 2550 queries. The second is the Oxford
building dataset to solve the ZIR task (Philbin et al.,
2007). This dataset contains images of the same sight
but not necessarily the same scene i.e. the images
present inside and outside parts of sights. To use this
dataset for solving the ZIR task, we generate three
sets of zoomed-in images by cropping and rescal-
ing the images of the oxford building dataset. These
datasets are Oxford-Zoomed-in-50, Oxford-Zoomed-
in-25 and Oxford-Zoomed-in-10 where the zoomed-
in images cover 50%, 25% and 10% of the original
scene respectively. We use these three constructed
datasets as queries to solve the task of the whole scene
(original images of oxford buildings) retrieval.
4.2 Evaluation Measures
To evaluate the performance of the proposed F-HS,
FP-HS models and the hybrid approach, we compute
the recall, MAP and VR (Alyosef and N
¨
urnberger,
ICPRAM 2020 - 9th International Conference on Pattern Recognition Applications and Methods
244

2019). Given are a set of Q query images, M
q
number
of relevant image to a query image q, then the mean
recall MR is defined as:
MR =
1
Q
Q
∑
q=1
Recall(q) ; Recall(q) =
M
qr
M
q
(6)
To present the distribution of recalls of individual
query images around the MR, we compute the vari-
ance of the recall values V R as follow:
V R =
1
Q
Q
∑
q=1
(Recall(q) − MR)
2
(7)
To present the positions of relevant images in the set
of retrieved results, we compute the mean average
precision MAP as:
MAP =
Q
∑
q=1
Ap(q)
Q
; AP(q) =
1
j
j
∑
i=1
p(i) × r(i)
(8)
Where Ap(q) is the average precision for image q and
r(i) = 1 if the i
th
retrieved image is one of the relevant
images otherwise r(i) = 0, p(i) is the precision at the
i
th
element, J is the number of retrieved results.
4.3 Results of Image NDR
The results of the original HSV, HS, SIFT and the
proposed F-HS and FP-HS and the hybrid method
are compared and evaluated to solve the image NDR
tasks.
Table 2: MR of the crisp HSV, the crisp HS, the F-HSV, and
the F-HS methods for the top 3, 10 and 500 results.
Method MR3% MR10% MR500%
HSV 34.87 44.44 82.38
HS 38.49 48.01 87.52
F-HSV 37.09 47.76 86.38
F-HS 41.87 51.62 87.52
4.3.1 Comparison of F-HSV, F-HS & HSV, HS
As we mentioned in Subsection 3.1.2, using 2D HS
histogram performs better than the 3D HSV his-
togram. To justify this idea, we compare the perfor-
mance of crisp HSV, F-HSV to the performance of
crisp HS, F-HS histograms to solve image NDR tasks.
We apply this experiment on the Ukbench dataset.
Table 2 shows that the crisp HS and the F-HS mod-
els perform better than the crisp HSV and the F-HSV
models in solving the image NDR task. Table 3 clar-
ifies that the ignoring of the value domain improves
the MAP and the VR by solving image NDR tasks.
Table 3: MAP and VR of crisp HSV, crisp HS, F-HSV and
F-HS methods on top 3 and 10 results.
Method MAP3 MAP10 VR3 VR10
HSV 31.40 33.52 11.65 16.02
HS 35.57 36.47 12.01 13.81
F-HSV 33.40 35.02 11.19 15.65
F-HS 37.32 40.39 12.07 13.28
4.3.2 Results of F-HS for NDR Task
As shown in Table 2 the F-HS outperforms the crisp
HSV, F-HSV and the HS models. Therefore, we re-
ranked the results of the F-HS using their SIFT fea-
tures. Table 2 presents that the top 500 retrieved im-
ages using FH-SH retrieves about 87% of the rele-
vant images. Therefore, we suggest to re-rank the top
500 results using their SIFT features. Table 4 presents
that applying the hybrid method (i.e., first F-HS and
then re-rank the top 500 results) obtains better results
than the extraction and matching of only SIFT fea-
tures to solve image NDR task. Moreover, our hy-
brid approach accelerates the matching process since
it compares SIFT features of a query image with only
the top 500 retrieved results i.e., with only 6.5% of
total images in the dataset. Table 4 explains that our
hybrid method obtains better MAP than the SIFT al-
gorithm. In addition, it presents that the distribution
of the individual recalls around the MR is better by
our method than by the SIFT algorithm.
Table 4: The MR of the SIFT algorithm and the F-
HS+SIFT for the top 3, 10 and 50 results.
Method MR3% MR10% MR50%
SIFT 49.32 54.31 58.70
F-HS+SIFT 55.77 64.61 72.78
Table 5: MAR and VR of the SIFT & the F-HS+SIFT mod-
els.
Method MAP3 MAP10 VR3 VR10
SIFT 47.46 51.07 15.08 15.17
F-HS+SIFT 53.76 57.46 14.75 14.60
4.3.3 Results of FP-HS for NDR Task
Table 6 presents the performance of the FP-HS model
when both query and dataset images are divided into
three (P = 3) and then nine (P = 9) sub-images. The
results illustrate that the using of nine sub-images im-
proves the MR of the FP-HS model. Moreover, as pre-
sented in Table 7, the FP-HS model produces a small
Hybrid Fuzzy Binning for Near-duplicate Image Retrieval: Combining Fuzzy Histograms and SIFT Keypoints
245
VR when P = 9 too. As displayed in Table 6, the MR
obtained by nine sub-images is around 80% on the top
50 results while it is more than 90% when the top 500
results are retrieved. Therefore, we can improve the
performance of image NDR by re-ranking the top 50
or 500 results, i.e., only 0.65% or 6.5% of the size of
the dataset respectively.
Table 6: MR of the FP-HS model for P = 3 and P = 9.
FP-HS MR3 MR10 MR50 MR500
P = 3 52.27 59.32 73.53 89.32
P = 9 55.71 66.22 78.44 91.32
Table 7: The MAP and VR of the FP-HS model.
FP-HS MAP3 MAP10 VR3 VR10
P = 3 46.74 50.39 13.42 15.73
P = 9 52.68 56.71 13.24 14.29
4.3.4 Re-rank FP-HS Results for NDR Task
We improve the ranking of results by matching the
SIFT features of a query with the top 300 images. Ta-
bles 8 and 9 introduce the re-ranked results of the FP-
HS model. The hybrid model obtains the best MR
when P = 9 is utilized to construct the FP-HS. More-
over, the best MAP and VR are obtained concerning
the hybrid model and P = 9 (Table 9). The hybrid
model (when P = 9) improves the results of image
NDR by 22% more than the SIFT algorithm, 30%
more than F-HS, and 4% more than the hybrid model
using P = 3. In this work, we do not resume the evalu-
ation concerning more sub-images since the partition
of images into smaller sub-images is once again time
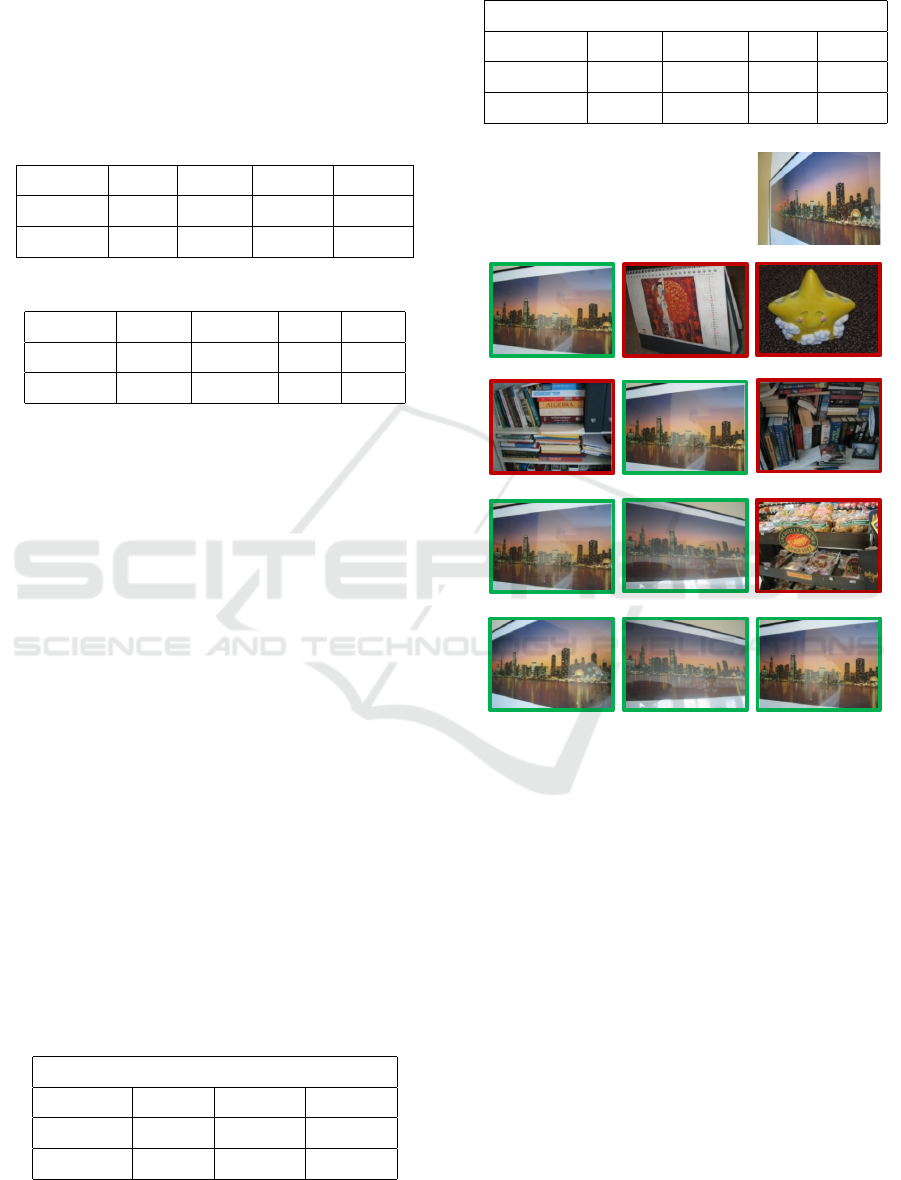
and memory consuming. Figure 3 presents a compari-
son between the SIFT algorithm, the F-HS model, the
FP-HS, and the hybrid approach. The SIFT algorithm
and the F-HS model retrieve only one of the three rel-
evant images in the top three results. Whereas, the
FP-HS model retrieves two of the relevant images in
top results. However, re-ranking the results utilizing
SIFT features obtains all relevant results in the top
three results.
Table 8: The MR of the hybrid approach on the top 300
found by the FP-HS model.
Re-ranked results: hybrid approach
Partitions MR3% MR10% MR50%
P = 3 68.52 73.73 75.44
P = 9 72.77 81.79 87.59
Table 9: The MAP and the VR of the hybrid approach on
the top 300 results of the FP-HS model.
Re-ranked: hybrid approach
Partitions MAP3 MAP10 VR3 VR10
P = 3 67.12 70.57 13.11 12.05
P = 9 71.06 75.20 12.64 11.16
Query image:
Retrieved results by the SIFT algorithm:
Retrieved results by the F-HS model:
Retrieved results by the FP-HS model:
Retrieved results by our hybrid approach:
Figure 3: Comparison of the top three retrieved images em-
ploying the SIFT, the F-HS, the FP-HS, and the hybrid ap-
proach to solve the image NDR task.
4.4 Result of Zoomed-in Retrieval
Zoomed-in images retrieval is a part of image NDR
when the zoomed-in image covers the most relevant
details in the whole scene. If the zoomed-in image
covers only a very small part of the whole scene and
differs in resolution, then the justification of zoomed-
in / whole scene relation is challenging even for the
human visual system. Therefore, in this work, we dis-
cuss the case of ZIR separately. We use the Oxford
buildings dataset to compare the performance of the
F-HS, the SIFT, the FP-HS, and the hybrid approach.
ICPRAM 2020 - 9th International Conference on Pattern Recognition Applications and Methods
246

Table 10: MR values for various zoomed-image datasets to
solve the ZIR task. The results are computed concerning
the top 1, 5, and 50 results.
Oxford- F-HS
Zoomed-in MR1% MR5% MR50%
50% 77.63 83.86 95.41
25% 49.17 57.13 78.49
10% 29.93 36.79 59.63
4.4.1 Zoomed-in Retrieval using F-HS
Tables 10, 11 explain that the best performance of
the F-HS model is achieved for the Oxford-Zoomed-
in-50. When zoomed-in images cover only 10% of
whole scenes, the MR and the MAP of the F-HS
model decrease very strongly since the color distri-
bution in zoomed-in images differs dramatically from
whole scenes. We do not present the MAP for the
first result since it is equal to the MR. The best VR is
obtained for the Oxford-Zoomed-in-50.
Table 11: The MAP and VR of the F-HS model for the top
5 and 50 results.
Oxford- F-HS
Zoomed-in MAP5 MAP50 VR5 VR50
50% 70.93 72.64 11.41 12.41
25% 37.25 39.35 11.83 13.21
10% 19.58 21.46 14.64 15.21
4.4.2 Zoomed-in Retrieval using FP-HS
We present the performance only for (P = 9) since
the utilizing of nine sub-images outperforms the us-
ing of only three sub-images. Tables 10 and 12 show
that the FP-HS model obtains MR 3%, 14%, and 23%
better than the F-HS model for Oxford-Zoomed-in-
50, Oxford-Zoomed-in-25, and Oxford-Zoomed-in-
10 respectively. As described in 12 and 13, the best
MR and MAP are obtained for the Oxford-Zoomed-
in-50 dataset. The VR is small for all query datasets.
Table 12: MR of the FP-HS model to solve ZIR task.
Oxford- F-HS
Zoomed-in- MR1% MR5% MR50%
50% 79.10 85.40 96.20
25% 63.48 73.77 92.02
10% 53.10 61.44 82.39
Table 13: The MAP and VR of the FP-HS model.
Oxford- F-HS
Zoomed-in MAP5 MAP50 VR5 VR50
50% 66.39 66.98 16.92 3.65
25% 48.52 50.84 23.94 7.33
10% 39.80 41.99 25.81 14.50
4.4.3 Re-rank FP-HS Result
To improve the ZIR, we re-rank the top 100 results
utilizing their SIFT features. Table 14 presents that
our hybrid approach improves the MR even when the
zoomed-in image covers a small part (i.e. 10%) of
the whole scene. Moreover, it improves the VR of
re-ranked results (see Table 15). The MAP for our
approach is about the same for the top five and ten
results.
Table 14: The MR results of the hybrid approach.
Oxford- F-HS
Zoomed-in- MR1% MR5% MR10%
50% 95.92 96.24 96.24
25% 91.56 92.07 92.07
10% 79.66 81.55 82.06
Table 15: The MAP and VR of the hybrid approach.
Oxford- F-HS
Zoomed-in MAP5 MAP50 VR5 VR50
50% 96.08 96.08 3.91 3.61
25% 91.80 91.80 7.29 7.02
10% 80.48 80.55 16.20 15.04
5 CONCLUSIONS
In this work, we introduced a method to accelerate the
extraction and matching of features to improve image
NDR and ZIR. To accelerate the extraction of fea-
tures and reduce the usage of memory, we proposed
the F-HS and FP-HS models. The purpose of these
models is to construct the fuzzy 2D hue and satura-
tion histogram of an image. To enhance the perfor-
mance of the FP-HS model, we re-rank the top N re-
trieved results utilizing their SIFT features. Hence,
we avoid the comparison of SIFT features with the
whole dataset images. The results indicated that the
hybrid method has a better performance than applying
the SIFT algorithm or the FP-HS model individually.
Hybrid Fuzzy Binning for Near-duplicate Image Retrieval: Combining Fuzzy Histograms and SIFT Keypoints
247

REFERENCES
Alyosef, A. A. and N
¨
urnberger, A. (2016). Adapted sift
descriptor for improved near duplicate retrieval. In
Proc. ICPRAM, pp. 55-64.
Alyosef, A. A. and N
¨
urnberger, A. (2017a). The effect
of sift features properties in descriptors matching for
near-duplicate retrieval tasks. In ICPRAM.
Alyosef, A. A. and N
¨
urnberger, A. (2017b). Near-duplicate
retrieval: A benchmark study of modified sift descrip-
tors. In Springer, pp. 121-138.
Alyosef, A. A. and N
¨
urnberger, A. (2019). Detecting sub-
image replicas: Retrieval and localization of zoomed-
in images. In CAIP.
Auclair, A., Vincent, N., and Cohen, L. D. (2009). Hash
functions for near duplicate image retrieval. In WACV.
Bosch, A., Zisserman, A., and oz, X. M. (2008). Scene
classification using a hybrid generative/discriminative
approach. In Trans. PAMI.
Chu, L., Jiang, S., Wang, S., Zhang, Y., and Huang, Q.
(2013). Robust spatial consistency graph model for
partial duplicate image retrieval. In IEEE Trans. on
Multimedia, pp. 1982-1996.
Chum, O., Philbin, J., Isard, M., and Zisserman, A. (2007).
Scalable near identical image and shot detection. In
Proc. CIVR, pp. 549-556.
Grauman, K. and Darrell, T. (2007). The pyramid match
kernel: Efficient learning with sets of features. In
Journal of Machine Learning Research.
Han, J. and Ma, K. K. (2002). Fuzzy color histogram and
its use in color image retrieval. In IEEE TRANS. ON
IMAGE PROCESSING.
Jiang, M., Zhang, S., Li, H., and Metaxas, D. N. (2015).
Computer-aided diagnosis of mammographic masses
using scalable image retrieval. In IEEE Trans.
Biomedical Engineering.
Ke, Y. and Sukthankar, R. (2004). Pca-sift: A more dis-
tinctive representation for local image descriptors. In
CVPR, pp. 506-513.
Khan, N., McCane, B., and Wyvill, G. (2011). Sift and surf
performance evaluation against various image defor-
mations on benchmark dataset. In DICTA, pp. 501-
506.
Li, J., Qian, X., Li, Q., Zhao, Y., Wang, L., and Tang,
Y. Y. (2014). Mining near duplicate image groups.
In Springer, pp. 655-669.
Lowe, D. (2004). Distinctive image features from scale-
invariant keypoints. In Computer Vision.
Nist
`
er, D. and Stew
`
enius, H. (2006). Scalable recognition
with a vocabulary tree. In Conf. CVPR.
P. Marin-Reyes, J. Lorenzo-Navarro, M. C. S. (2016). Com-
parative study of histogram distance measures for re-
identification. In CoRR.
Philbin, J., Chum, O., Isard, M., Sivic, J., and Zisserman, A.
(2007). Object retrieval with large vocabularies and
fast spatial matching. In IEEE Conf. on CVPR.
van de Sande, K., Gevers, T., and Snoek, C. (2010). Eval-
uating color descriptors for object and scene recogni-
tion. In IEEE Trans. on PAMI.
Xu, D., Cham, T., Yan, S., Duan, L., and Chang, S. (2010).
Near duplicate identification with spatially aligned
pyramid matching. In IEEE Trans. Circuits and Sys-
tems for Video Technology.
ICPRAM 2020 - 9th International Conference on Pattern Recognition Applications and Methods
248
