
Self-service Data Science for Healthcare Professionals: A Data
Preparation Approach
Marco Spruit
1a
, Thomas Dedding
1
and Daniel Vijlbrief
2
1
Department of Information and Computing Sciences, Utrecht University, The Netherlands
2
Department of Neonatology, Wilhelmina Children’s Hospital, University Medical Center Utrecht, The Netherlands
Keywords: Applied Data Science, Meta-algorithmic Modelling, Knowledge Discovery, Domain Expertise, Healthcare,
Data Analytics, CRISP-DM.
Abstract: Knowledge Discovery and Data Mining are two well-known and still growing fields that, with the
advancements of data collection and storage technologies, emerged and expanded with great strength by the
many possibilities and benefits that exploring and analyzing data can bring. However, it is a task that requires
great domain expertise to really achieve its full potential. Furthermore, it is an activity which is done mainly
by data experts who know little about specific domains, like the healthcare sector, for example. Thus, in this
research, we propose means for allowing domain experts from the medical domain (e.g. doctors and nurses)
to also be actively part of the Knowledge Discovery process, focusing in the Data Preparation phase, and use
the specific domain knowledge that they have in order to start unveiling useful information from the data.
Hence, a guideline based on the CRISP-DM framework, in the format of methods fragments is proposed to
guide these professionals through the KD process.
1 INTRODUCTION
Knowledge Discovery and Data Mining are two well-
known and steadily expanding fields that investigate
the many possibilities and benefits that exploring and
analysing data can bring. Knowledge Discovery (KD)
was defined by Fayyad, Piatetsky-shapiro, & Smyth
(1996) as “the non-trivial process of identifying valid,
novel, potentially useful and ultimately
understandable patterns in data”. Additionally, Data
Mining (DM) was defined by Luo (2008) as “the
process of analysing data from different perspectives
and summarizing it into useful information”. Hence,
although sharing similar goals (turning data into
knowledge), assuming that KD and DM are the same
is a misconception. KD is an overall process of
extracting information from data which can be turned
into valuable insights, having the application of DM
techniques within it. DM on the other hand, can be
addressed as the application of methods, techniques
and specific algorithms to extract those useful
patterns out of the data. However, extracting
knowledge from data is not a trivial task and the
process is composed of many phases and activities.
a
https://orcid.org/0000-0002-9237-221X
These vary in complexity and importance for each
specific and distinct scenario, dataset, and problem.
For larger and massive datasets, one of the most
problematic and exhaustive tasks is to prepare the
data, by removing inconsistences, integrating tables,
and transforming its variables and values, before
applying the different statistical methods and
techniques to obtain useful information from it. This
requires a good understanding of the business goals
and project’s objectives, and also a good
understanding of the data itself. Moreover, since data
preparation is an activity as important as data mining,
lacking in doing it properly can hinder or even
compromise the entire data analysis activity. Hence,
even for simple questions and hypothesis, preparing
the data properly is essential for a good analysis, and
to avoid getting bias for not considering ‘dirty’ data
into it.
Although in healthcare research KD’s application
is currently not as advanced as in other areas, it is
already being used to aid nurses and doctors on their
daily activities and patient’s treatment, where some of
the potential benefits of using data smartly and
effectively includes detecting and preventing
724
Spruit, M., Dedding, T. and Vijlbrief, D.
Self-service Data Science for Healthcare Professionals: A Data Preparation Approach.
DOI: 10.5220/0009169507240734
In Proceedings of the 13th International Joint Conference on Biomedical Engineering Systems and Technologies (BIOSTEC 2020) - Volume 5: HEALTHINF, pages 724-734
ISBN: 978-989-758-398-8; ISSN: 2184-4305
Copyright
c
2022 by SCITEPRESS – Science and Technology Publications, Lda. All rights reserved

potential diseases, predicting outcomes, and
estimating length of hospital stay (Raghupathi &
Raghupathi, 2014). For that purpose, hospitals
usually seek data experts to help them on extracting
knowledge from their data, however, these
professionals often do not have the specific medical
background information to make the most of their
analysis, like doctors would if the right tools were
provided to them. Therefore, the data exploration
process could take longer than needed due to the fact
that the person would not have the proficiency, for
example, to fully understand all the variables within
the data. Thus, if domain experts could also have a
way and be supported to analyse the data, the
knowledge discovery process could be greatly
improved, as they are supposed to have a deeper
understanding of the business, problems, and the
attributes within the data. Thus, given the power that
data analytics has, and although data scientists and
analysts are very much required in today’s market,
KD should not be an exclusive activity for those
professionals, especially because (as stated above)
they usually lack relevant domain knowledge when
compared to field experts. Hence, based on the above,
the overarching research question for this research is:
How can the data preparation phase, embedded
within the knowledge discovery process, be further
specified to enable domain experts such as healthcare
professionals to explore analytical problems more
easily and intuitively by themselves?
As defined by Spruit & Jagesar (2016), Applied
Data Science is “the knowledge discovery process in
which analytical applications are designed and
evaluated to improve the daily practices of domain
experts”. Therefore, to help domain experts to
analyse, understand and extract knowledge from data,
and by this, improve their daily practices, we present,
in the format of method fragments, a guideline which
suggests how domain experts should pursue the data
pre-processing phase of the KD process. In addition
to that, in order to gather enough information and
knowledge over what was important and should be
included in the guideline, an extensive literature study
was made, together with information collected by
means of interviews with domain experts from the
medical domain, and a brief data quality assessment
over the information collected and stored within the
databases from the children’s hospital in the city of
Utrecht in the Netherlands (WKZ), as will be briefly
explained next. The guideline development was based
on the CRISP-DM framework, which was adapted to
the domain experts’ needs. Hence, first, a brief
theoretical explanation that supports KD to be done
by domain experts will be given, together with the
summarized findings from the interviews and data
quality assessment. Next, the CRISP-DM’s
adaptation will be shown, followed by the developed
guideline. Finally, we will present the evaluation
results for this study, as well as or conclusions and
future steps.
2 DOMAIN EXPERTS AND
KNOWLEDGE DISCOVERY
As could be seen already, Knowledge Discovery is a
complex and extensive process where DM is only one
step within it. Even so, data driven activities keep on
focusing specially in DM, while the other phases are
underestimated and their importance is not really
taken seriously (Tsai, Lai, Chao, & Vasilakos, 2015).
That creates a deficiency in what is expected from the
business and what is actually delivered. For example:
data scientists and researches identify achievements
and findings from a technical perspective, while
business analysts need useful information that
actually add some value to the business. Moreover,
organizations then seek to perform Actionable
Knowledge Discovery (AKD) instead of simple KD,
or in other words, extract knowledge from data that
actually supports decision-making and action-taking
activities. As per Cao (2012), one of the main
concepts (among others) which create the basis for
applying AKD is ‘ubiquitous intelligence’ which
makes reference to all knowledge and information
surrounding the AKD process. Thus, it can be
categorized by in-depth data intelligence, which
refers not only to the task of extracting patterns from
transactional or demographic data, but the power of
adding into the analysis real-time data,
multidimensional data, business performance data,
environmental data, etc.; domain intelligence, which
involves extracting all relevant knowledge from the
project’s domain, such as expert knowledge,
background information, possible constraints, etc.;
organizational and social intelligence, which refers
to all organizational and social information that can
be extracted to and added into the analysis, such as
business processes and rules, organograms, etc.;
network and web intelligence, which refers to hidden
information throughout, for instance, distributed
systems, network structures, online communities,
emails, etc.; and human intelligence, which refers to
the participation of domain experts into the
knowledge discovery process, by means of
supervising, evaluating, sharing knowledge, and
sharing expectations and priorities.
Self-service Data Science for Healthcare Professionals: A Data Preparation Approach
725

2.1 What Domain Experts Know about
Knowledge Discovery
Although is explicit that domain experts are required
in order to perform AKD, it was not clear how much
these professionals could indeed contribute to the
process, or in other words, how much they knew
about KD. Hence, as said above, seven semi-structure
interviews were conducted in order to gather
information about how much medical experts knew
about this topic, where the number of participants was
chosen following the ‘data saturation’ theory (Francis
et al., 2010). All participants were medical experts
with no deep technical expertise, and the interviews
covered the following topics:
Knowledge Discovery Understanding: what the
interviewee understands about knowledge
discovery, their thoughts about its benefits for the
organization, patients, etc., and what is the
understanding about the process of discovering
knowledge from data;
Data Preparation and Modeling Understanding:
this aimed to understand if the interviewee have
any technical knowledge such as statistical and
programming skills, their experience in extracting
knowledge out of data, their difficulties, and
knowledge over the available data;
Expectations and Thoughts over KD: aiming to
understand their expectations of being able to
analyze data themselves, if they would be able to
do it in their daily work, and their experiences (if
any) with third-party data analysts doing data
analysis.
As a result, even though the exact definition of KD
was not known, the idea of using data to ex-tract
information that can be used to better treat patients,
and even prevent diseases to happen was well
acknowledged by all the interviewees. Additionally,
it was possible to see that some of the concepts and
phases from CRISP-DM, for example, such as
business understanding, data understanding, data
preparation, and modelling could be seen in the
answers given by the participants, and therefore most
of them had an overall understanding of the activities
that exist in between defining a goal and analysing
data. Furthermore, as expected, domain experts lack
programming skills, and therefore, any analysis based
on coding activities can be difficult for them.
However, most of them said to have a reasonable
knowledge of statistical methods, which on the other
hand, allows them to, by using other techniques,
analyse data. Hence, their experience in the matter is
mostly based on basic exploratory analyses or
applying statistical methods for testing research
hypothesis. When asked about the quality of the data
that they usually work with, most of them complained
about the huge amounts of dirty data present in the
many databases (given bad inputs from machines or
even doctors and nurses who add information e.g. free
text, into the databases). Also, most participants had
an idea of what data was being stored into the
databases but had no clue on how to check that
information, or to retrieve such content. However,
one of the main difficulties stated by them was to
gather information from different places (as the data
is scattered throughout many tables) in one single
master-file where they could base their analysis upon.
Furthermore, most of them demonstrated
excitement when asked if they would like to spend
more time analysing data if that activity was
somehow facilitated. A recent study made by ana-
lysts from Gartner Inc. (Linden et al., 2017) evaluated
top-rated commercial data science platforms (i.e.
software applications that can produce all types of
data science solutions), and showed that almost none
of them could support less technical people. When
asked about their thoughts and wishes, most domain
experts complained about the so called ‘black-box’
scenario, or not having control (or not completely
understanding) about what was being done beneath
algorithms within tools and wish to have some step-
by-step guidance on how to pursue an analytical task.
Moreover, domain experts know the challenges and
difficulties of dealing with data and know how
essential data experts are for the process. However,
they know that most of the times data ana-lysts and
scientists don’t have the medical background to
understand and extract all relevant information from
the data, and that therefore, they have to work
together with these people, providing them medical
knowledge in order to get the “right” answers.
2.2 Data Quality Understanding
Much has been said about the benefits of using data
analytics as a decision-support mechanism in
different areas of application, especially in the
healthcare. However, these benefits are directly
related to the quality of data that is being used during
the analysis, and therefore, people have to be really
sure that the data is trustworthy. Nowadays most data
within hospitals is being generated by means of
electronic health records (EHRs), which should be,
most of the times, reliable. However, even those
mechanisms sometimes depend on human factors,
such as an electrode being connected correctly to a
patient. Besides that, a lot of data from, for example,
HEALTHINF 2020 - 13th International Conference on Health Informatics
726

the intensive care units, as per the interviewees, are
still being entered by doctors and nurses as free-text
based on observations or comments that can differ for
each professional. Thus, to understand what domain
experts would be dealing with when analysing data,
and based on Batini, Cappiello, Francalanci, &
Maurino, (2009), four main quality dimensions
(which although do not represent all dimensions, are
considered the centre of attention for the majority of
researchers) were briefly analysed: accuracy,
completeness, consistency, and timeliness. The first
one refers to syntactic and semantic accuracy for
example, which sees if a value is syntactically cor-
rect, and if that same value is making reference to
what it was supposed to respectively; completeness
makes reference to the amount and impact of missing
values within a dataset; consistency is when values,
attributes, and constraints are persisted across the
whole database; and lastly, timeliness refers to how
current the data is, and whether the it is available
when expected and needed to be.
Table 1: Quality Issues Overview.
Quality
Dimensions
Type of Problems Found
Accuracy
Medication being written in up to
seventy different manners.
NICU patients from the gaining up to
three kilograms in the same day.
Length of stay in the NICU of less
than 5 minutes for some of the
patients.
Consistency
Around 2% of the random sample of
16.000 records was duplicated.
Almost 20% of the 10.647 patients
analysed were officially admitted
after or discharged before a
measurement was realized.
Different units of measurement (e.g.
millilitres, grams, kilograms, etc.) are
being utilized, where for some
specific types of measurements the
unit employed is being specified in
the its name (i.e. grams for measuring
the patient’s weight), however, for
others it is very hard to identify it.
Completeness
Almost 24% (from a random sample
of 50.000 records) of the information
about line’s type and position was
missing from the data table.
From a random sample of 12.000
records referring to antibiotic
treatment, the information of which
type of medication was given is
missing in around 67% of the cases.
Timeliness
No specific problem was found in this
dimension.
The data was analysed using R, where by means of an
exploratory analysis some problems were discovered.
The analysis was made upon the data corresponding
to the Ne-onatal Intensive Care Unit (NICU) from the
WKZ, without following any specific procedure.
Hence, Table 1 summarizes the problems that were
found, per quality dimension.
As can be seen, many data problems related to the
mentioned quality dimensions were found (due to
page restrictions they cannot be exemplified in
detail), depicting flaws that probably ex-tend to both
data generation process and technical aspects (e.g.
better definition of integrity con-strains to avoid
human errors). Regarding some examples given
above, such as the wrong values concerning the
weight of the babies, is hard not to ask further
questions such as whether those values were
typographical errors, or if, those values belonged to
some other patient and were exchanged by mistake; if
yes, whether that could be happening to other
variables as well and how often. Thus, although many
data quality problems exist and can be easily seen,
some of them open new questions about the whole
validity of the available data, which would require a
more extensive data quality assessment to be
checked. Nevertheless, with the knowledge that was
acquired, it is clear that this matter requires more
attention and continuously improvement to slowly
transforming and creating a more trustworthy and
consistent data environment.
3 CRISP-DM FRAMEWORK
ADAPTATION
As per the CRISP-DM framework, all main phases of
the KD process and their respective out-comes are
very well defined (Chapman et al., 2000). However,
there is no distinction of how phases should be
pursued (and what outcomes are expected) depending
of the type of user who is fol-lowing the guideline.
For example, the majority of data driven tasks are
mainly being done by data analysts and scientists,
who spend hours, days, and even weeks,
understanding and map-ping inconsistencies and
potential problems, and applying DM methods on the
data. On the other hand, domain experts usually have
different priorities where unfortunately the focus is
not KD. Hence, they do not have the same amount of
time to spend on data analysis, and therefore, not all
KD phases will be conducted with the same level of
details when compared with data ex-perts. Thus, as
the focus and the technical knowledge is different, the
Self-service Data Science for Healthcare Professionals: A Data Preparation Approach
727
way of pursuing the phas-es from CRISP-DM should
be different as well.
Additionally, in order to facilitate the Data
Preparation phase, the Data Understanding phase has
to be considered as well. As mentioned in the last
section, the main aspect that differentiates domain
experts from the majority of external analysts, is the
huge domain knowledge that these professionals
have. On the other hand, the database environment in
which the information is stored, and of course, where
and how the data is stored, is something that most
domain experts would have difficulties to explain,
and although domain experts already have a deep
under-standing of the variables and information
within a dataset, is not always easy for them to know
where to find (and how to access) such information.
Also, data is usually spread across many tables within
the database, and examining the datasets one by one,
trying to find the right infor-mation to be used in the
analysis, can be very time consuming and
demotivating. Therefore, the first topic that should be
highlighted during the Data Understanding stage is
the understanding the data environment. Second, as
domain experts are limited to time and also technical
con-straints, it is not feasible to expect that any
complex analysis or algorithms applications will be
made during the investigation, hence, it is expected
that they would only perform simple explor-atory
data analysis which could be performed entirely
during this phase.
Moving forward, as it should be clear now,
preparing data can be very time consuming depend-
ing on the data quality level one wants to achieve. For
some data mining methods, ensuring that only valid
and clean data enters into the analysis is mandatory
for a good outcome, as it is the case for classification
and predictive DM methods for example. However,
that does not mean that for the other types of DM
activities data quality is less important, yet, by means
of explora-tory data analysis and knowledge over the
quality issues, problems can be considered and
avoided during the analysis, and the quality
improvements, if required, made on demand. The
Data Preparation goal for domain experts, based on
their technical skills, time constraints, and type of
DM orientation to be pursued, should only focus in
making the dataset simpler and smaller for further
analysis. Based on all that, any proposed solution has
to be straightforward, since, besides the time
constraint aspect, people tend to get demotivated if
stuck into something for too long with no much
progress. Nevertheless, as it is hard to specify the
exact activities that should be pursued in this phase
(given that many activities are highly situational), two
aspects can be highlighted, as ones that fit domain
experts’ needs (based on the difficulties stated by
them during the interviews) and constraints, and at the
same time, aligned with the phase’s goal stated above:
creating a unified view for the data, and constructing
the dataset with the purpose of making any analytical
task easier afterwards.
Based on has been said above, an adaptation for
the CRISP-DM framework is proposed when
focusing on domain experts. Thus, the three first
phases from the model are suggested to be enough for
them to pursue an analytical task without major help
from data experts. The Business Understanding
phase, should still be the starting point still, however,
with the objective of only translating the research
question or hypothesis that domain experts most of
the times already have into an analytical project goal.
Next, considering all that has been said above about
the Da-ta Understanding and Data Preparation
phases, the certainty that preparing the data is most of
the times needed to the full comprehension of the data
content and to perform a full data quality assessment,
and the fact that it was suggested for domain experts
to in fact pursue the whole da-ta analysis within the
Data Understanding phase, two alterations are
proposed in the original CRISP-DM model, as can be
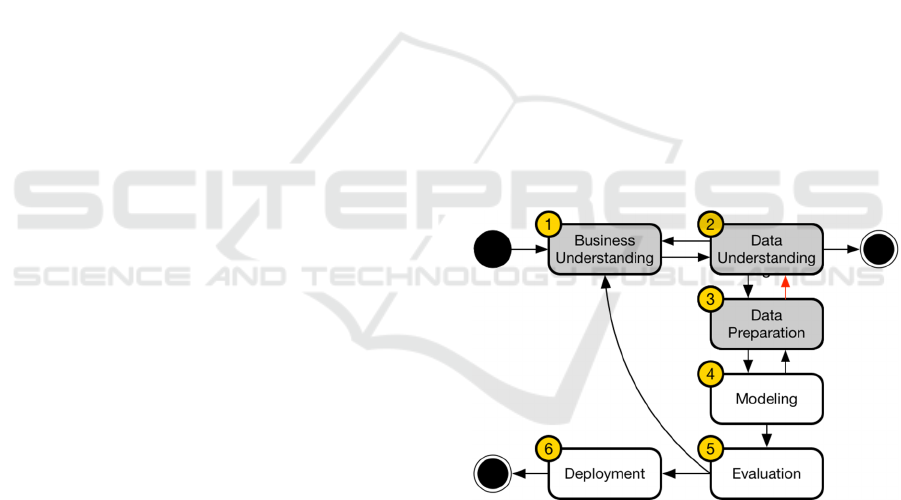
seen in Figure 1.
Figure 1: CRISP-DM for Domain Experts: Phases.
First, a two-way relationship was added between
Data Understanding and the Data Preparation phases
(arrow in read). That way, is possible to prepare and
manipulate the data prior or during the exploratory
analysis, as well as (if desired) to fully examine data
quality problems within the data. That was an
unexpected non-existent relationship in the original
CRISP-DM, given the fact that even data analysts in
order to fully understand the data, take advantage of
some data preparation tasks in order to the explore it.
Second, a new ending point was added after the Data
Understanding phase. Thus, the process now has two
HEALTHINF 2020 - 13th International Conference on Health Informatics
728
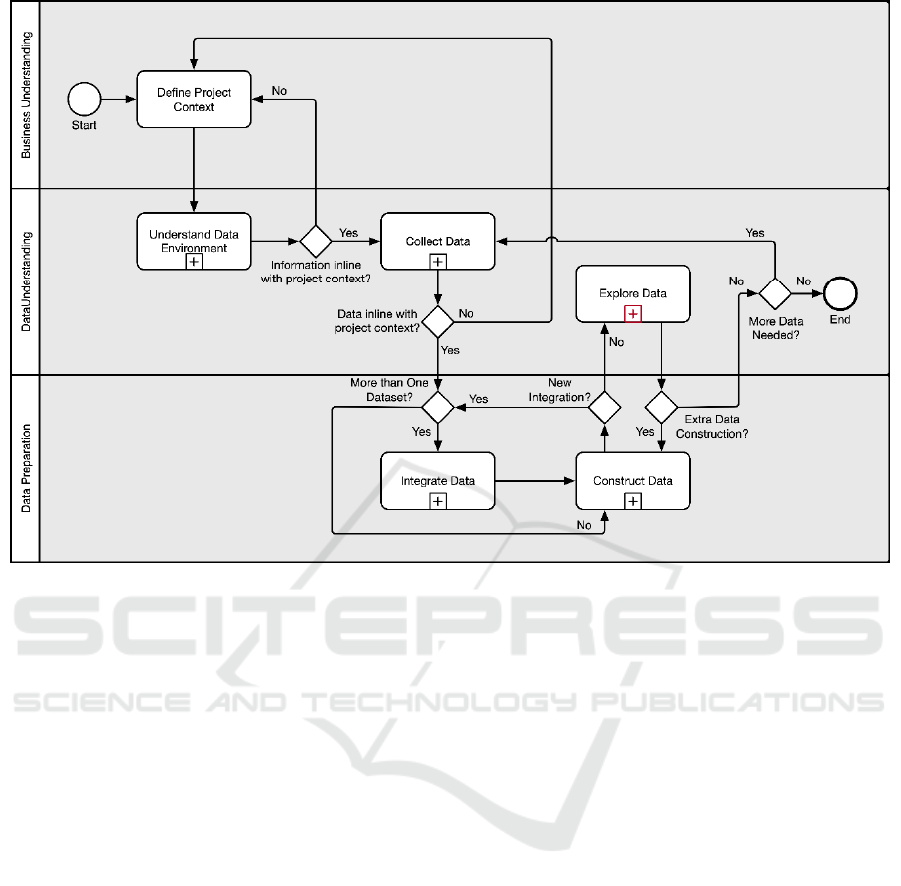
Figure 2: Knowledge Discovery Process for Self-Service Data Science.
ending points depending on the activity to be done,
and the type of user who is conducting the analysis.
The ending point after the Data Understanding phase
would mean that domain experts would have
concluded the exploratory data analysis, answered
their research questions, and no further interactions
are needed. Finally, the steps in grey are the ones
suggested for domain experts.
4 META-ALGORITHMIC
MODEL
The concept of MAM was inspired by the Method
Engineering discipline, which is defined as a
discipline to “design, construct and adapt methods,
techniques and tools for the development of
information systems” (Brinkkemper, 1996). In turn,
MAM is given the meaning of the “engineering
discipline where sequences of algorithm selection
and configuration activities are specified
deterministically for performing analytical tasks
based on problem-specific data input characteristics
and process preferences” (Spruit & Jagesar, 2016).
Thus, its main objective is to devise a step-by-step
guideline, composed by method fragments, used to
guide experts from the application domain (without
deep technical expertise) in the understanding of
some design science’s artefact. These fragments were
built using the Process-Deliverable Diagram (PDD)
notation, which consists of two integrated diagrams
that express both process-view and deliverable-view
of an artefact construction. In this section the method
fragments that are suggested to be followed by
domain experts are illustrated bellow together with
their brief description respectively. Figure 2 shows
how each task from the MAM refers to the CRISP-
DM adaptation showed in the previous section.
4.1 Understand Data Environment
The first main activity is called ‘Understand Data
Environment’ and it contains five sub-steps as
depicted in Figure 3. It starts from the assumption that
documents that describe in detail the database schema
from a given business are updated and available for
checking. Hence, first those documents have to be
identified and retrieved, where explanations about the
data tables within the database should exist. After
that, one should focus on finding the information
focusing in the data component in which the analysis
should be based upon; verifying which data tables are
available, their meanings, their purposes, and how
they are arranged; identifying how data tables relate
Self-service Data Science for Healthcare Professionals: A Data Preparation Approach
729
to each other, that means, which variables and
attributes allow the establishment of a relationship
between two tables; and finally understanding which
variables are being stored within each table, and how
to refer to them. No content is being analysed so far,
only attributes and their meanings.
Figure 3: Understand Data Environment step.
4.2 Collect Data
After acquiring a reasonable knowledge over the data
environment, the “Collect Data” activity has the
purpose of loading the data files that are required for
the analytical task and getting familiarized with them.
Thus, this activity has three components, as shown in
Figure 4. The process starts by loading the data file
into a tool of choice, such as loading a .CSV file into
Excel or R. Next, is recommended to describe the data
and then plot its features to start exploring the data
and the relationship between its variables. It has the
purpose of being a straightforward activity that aims
to provide an overall picture of the data’s content,
such as some descriptive statistics, how the data is
distributed, and some of its quality problems such as
quantity of missing data related to a given variable.
Figure 4: Collect Data step.
4.3 Integrate Data
Moving forward, after collecting and understanding
the data, the acquired datasets should be prepared for
the analysis accordingly to the user needs. Based on
what has been explained in previous sections, the
main objective of the Data Preparation phase for
domain experts should be on creating a simplified and
smaller dataset for an exploratory data analysis. Thus,
considering the user group to whom this MAM is
being created, the first main activity that are
suggested is the ‘Integrate Data’ task, as shown in
Figure 5.
Figure 5: Integrate Data step.
Integrating datasets can be a tricky activity for
those who do not have experience doing it, and it
should be pursued of course, if more than one dataset
has been collected/created. First, one has to know what
can be integrated and what makes sense integrating.
For domain experts, most of the information needed
about this matter should have been acquired during the
‘Understand Data Environment’ activity, where the
data tables and their relationship were examined. Thus,
the ‘Integrate Data’ activity starts with the selection of
the two convenient datasets to be integrated. After that,
the merging criteria between those files have to be
identified, where the correct and successful
identification of such criteria is mandatory for a
successful integration between the two datasets. Thus,
the last activity, ‘Execute Merging’ should only be
pursued if the merging criteria are indeed found.
Figure 6: Identify Criteria substep within Integrate Data.
HEALTHINF 2020 - 13th International Conference on Health Informatics
730
Moreover, the merging criteria are usually
defined by a primary and foreign key relationship
between two data tables, that is, a common attribute
that allows to identify matching records between two
datasets. The method fragment shown in Figure 6 was
designed to help domain experts on identifying those
attributes. First, a user has to identify common
variables (even if with different names) between both
datasets, and then, the one(s) that uniquely identify
single observations for each dataset, that is, the
attribute(s) that permits to differentiate one record
from another.
Furthermore, the next step is to identify the type
of relationship (in terms of cardinality) between the
two datasets considering the selected attributes as the
merging criteria. Four distinct types of relationship
cardinality exist: One-to-One (1:1), One-to-Many
(1:n), Many-to-One (n:1), and Many-to-Many (n:n).
Although in theory datasets could be merged despite
the type of relationship, for the domain experts only
the first three mentioned are suggested to be used,
since the Many-to-Many could create very complex
datasets, with several duplicate records, and even
wrong information.
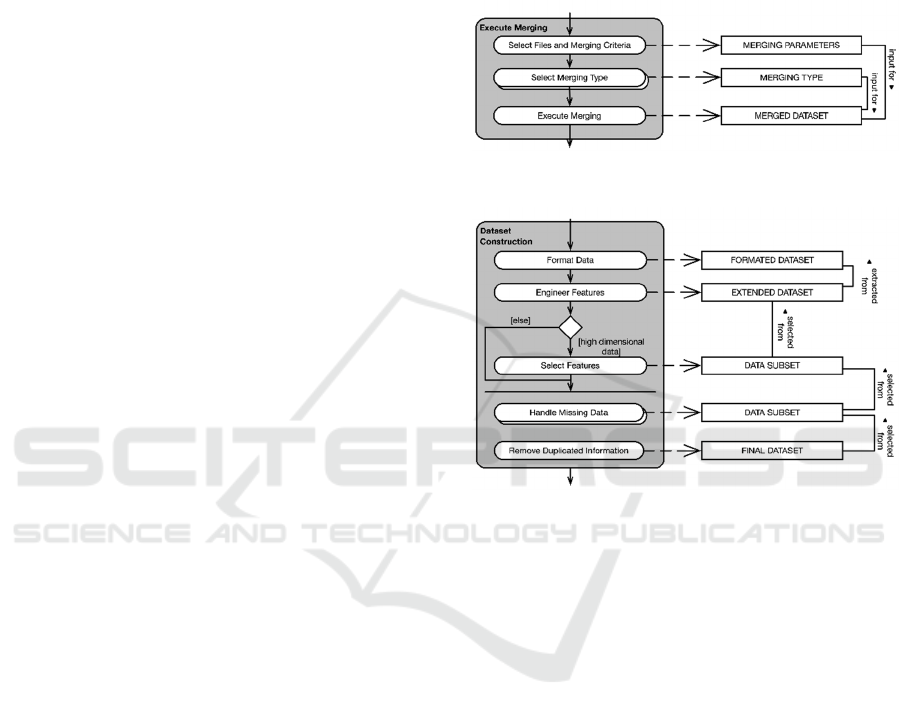
The last step for integrating the data is the actual
execution of the merging task, as shown in Figure 7.
It can be pursued in several ways, using different
tools and notations. Moreover, the goal is not
enforcing the user to choose one tool, and teach how
to execute such task, but to provide the knowledge of
what is needed in order integrate datasets. Thus,
despite the means, the parameters which are required
doing so are basically the same in any tool available.
Thus, the only missing parameter is the merging type,
which represents the definition of the content that
should be returned after the conclusion of the merging
task. Four merging types (the most commonly used
and known) are suggested, they are: Inner Join, Left
Join, Right Join, and Outer Join. Inner Join is
probably the most commonly used merging type, and
it returns all records from Dataset A which have a
corresponding matching record in Dataset B. The Left
Join type returns all record from Dataset A regardless
if that record has a match or not in Dataset B, together
with the matching records (if any) from Dataset B.
Right Join, similarly to the Left Join, returns all record
from Dataset B regardless if that record has a match
or not in Dataset A, together with the matching
records (if any) from Dataset A. Finally, the Outer
Join merging type returns all records from both tables,
matches and un-matches.
After choosing the right merging type for the
given situation, all three main components for
integrating two datasets were identified, what allows
the merging task execution to be done, using the most
convenient method and tool for the user. In R for
example, one could use the merge function and add
the correct parameters based on the MAM above. The
whole data integration process can be repeated if the
merging was not successfully done (which could
happen due to a bad judgment of the merging criteria)
or if there are more files collected in previous steps to
be merged.
Figure 7: Execute Merging substep within Integrate Data.
Figure 8: Construct Dataset step.
4.4 Construct Dataset
The last main activity within the Data Preparation
phase is called “Construct Dataset”. It comprises
most of the tasks defined by the original CRISP-DM
framework for the Data Preparation phase, such as
data selection, formatting, construction, and data
cleaning. This activity is suggested to be pursued with
the dataset resulted from the ‘Integrate Data’ task or
with the datasets initially collected. The activity is
illustrated in detail in Figure 8.
It starts with the “Format Data” activity which is
basically the same as the Data Formatting step from
the CRISP-DM. Examples of tasks that can be done
within this activity are: rearranging attributes,
changing text from upper to lower case, etc., with the
goal of formatting the variables without changing
their meaning, building that way a better visualization
(based on the user’s interpretation) of the dataset to
be analysed. The next proposed activity is called
“Engineer Features”, where new attributes can be
constructed if needed based on the already existing
attributes within a dataset. For example, if the dataset
Self-service Data Science for Healthcare Professionals: A Data Preparation Approach
731
has the weight and height information from a given
person, a new variable could be their body max index,
calculated based on the existing variables.
Next, as proposed by Spruit & Jagesar (2016), if
the dataset is high dimensional, that is, if it has a high
number of variables and records, a feature selection
should be done, first to reduce the size of the dataset
which will facilitate the analysis, and second, to
remove variables and records that may not be relevant
to the project goal and analytical task. Thus, the
feature selection can be done both horizontally and
vertically, where horizontally means applying feature
selection techniques (like a simple filtering) to the
attributes (columns) of a given dataset. On the other
hand, vertically means applying those techniques
upon the records (rows) from the dataset.
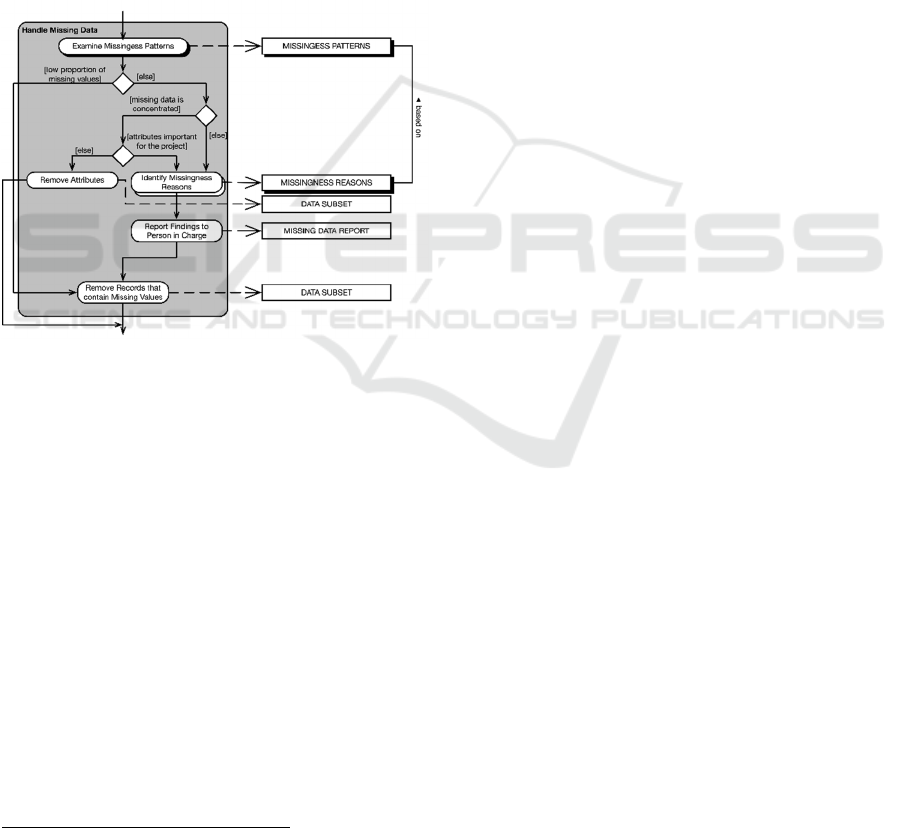
Figure 9: Handle Missing Data substep within Construct
Dataset.
Finally, the last two activities are dedicated to
handle the missing data and removing duplicate
information, as shown in Figure 9. Thus, by cleaning
the data building a simpler dataset, it should be easier
to achieve and produce better results during the
exploratory data analysis.
Additionally, missing data if not identified and
considered during the analytical task, can heavily
interfere in outcome by making the analysis biased
due to the incomplete information. Thus, identifying
and handling missing data is of high importance for
any analytical activity. Moreover, when focusing in
domain experts, is suggested that the user examine the
missingness patterns of the given dataset. Two main
aspects should be noticed when examining the
patterns: the proportion of missing data when
compared with the content of the dataset, and if it is
2
The Prototype Application can be accessed at:
https://github.com/Dedding/R-Shiny-Prototype-Tool
scattered throughout the many variables or
concentrated in only few attributes. In the end, the
main suggestion still is to remove all missing
information, since even if the mechanisms of
missingness (MCAR, MAR and MNAR) are well
known, is not guaranteed that by using the existing
methods and techniques such as deletion, single and
multiple amputation approaches, and maximum
likelihood estimation, to fix that specific issue will
result in an optimal dataset (Baraldi & Enders, 2010).
Thus, what is suggested is to evaluate the missingness
scenario, and to try removing the less number of
records possible.
After constructing the dataset, the user has then
the option of pursuing an exploratory data analysis
with the new dataset, always being able to collect new
data if needed, performing new integrations or
constructing activities.
5 EVALUATION AND RESULTS
In order to evaluate the proposed guideline, first a
structured walkthrough was performed, which is the
process of explaining in detail every aspect of the
artefact, with the purpose of ensure comprehension
from the domain experts over the model, as well as
guide them through why such activities exist, their
expected outcomes, decisions that were made in order
to create a given activity, what should be the benefits
of using the guideline, and answer any questions they
had (Rozanski & Woods, 2005). Thus, it was
mandatory to show why and how the proposed
artefact would indeed be of value for the domain
experts, meeting their needs, and making them
understand the importance of using it. The next step
of the evaluation procedure was to present a
developed prototype tool
2
to the participant, which
although not being part of the final artefact and main
deliverable of this study, it was developed with the
objective of facilitating comprehension over the
guideline, regarding its activities and their expected
outcomes. Furthermore, with the purpose of
exemplifying the model usage in the real-world, two
use case scenarios were created, where an analytical
project goal was defined in which domain experts had
to go through the model by using real data extracted
from the hospital’s databases, with the aid of the
prototype tool. After concluding both case studies, a
questionnaire was applied where questions regarding
the four topics:
HEALTHINF 2020 - 13th International Conference on Health Informatics
732

Interpretability: accordingly to Bibal & Frénay
(2016), it can be explained by the following three
connected subjects: understandability, accuracy,
and efficiency. The first one means that a model is
only interpretable when it can be understood.
Accuracy refers to how accurate the model is to the
data in hand since a model can be rather simple and
easily understood without having any relationship
with the data. Finally, efficiency, refers to the time
and effort it takes to understand the model,
however, this was not measured as it would not
make sense for this study.
Perceived Usefulness: refers to the degree to which
the participant considers the artifact effective for
structuring and preparing the data for an analytical
project.
Ease of Use: measures the degree to which the
participant considers following the guideline free
of effort
Intention to Use: like its own name says, whether
the participants intent to use the guideline for future
analytical projects.
Finally, the data was analyzed, and the results are
displayed below. The participants included in the
validation process were five domain experts from the
medical domain.
5.1 Interpretability
In terms of understandability, the ratings, as per the
respondents, were considered very good, as they
declared being able to fully comprehend the activities
and outcomes from the guideline, and the importance
of specific activities such as Understand Data
Environment and Integrate Data, which were designed
to facilitate not only the current step in the process, but
its following activities. In terms of accuracy, it was
clear that the participants felt confident on how real
datasets from their domain fitted the MAM, and how
the tasks and problems could be represented and
assessed by following it. Therefore, the overall
interpretability from the model, after conducting the
evaluation, was considered high and fulfilled the
expectations.
5.2 Ease of Use
To evaluate the overall ease of use of the MAM, three
topics had to be considered: how much effort it took to
understand the guideline, how much effort it took to
follow it, and if the tool influenced positively (or not)
in the evaluation of that matter. First, the effort to
understand the model was not optimal nor high, it was
rated to be between an average level of effort and
almost effortless. As domain experts are not used to
perform such activities, hence, it was expected for
them to have some difficulties interpreting all activities
and seeing the big picture immediately. Thus, that
supported the choice of pursuing a structured
walkthrough technique in the evaluation procedure. On
the other hand, after the understanding of the MAM,
the participants rated as almost effortless to follow its
activities. In addition to that, most participants had
good opinions about whether the tool helped on
understanding the model and how easy was to use it.
However, as it was limited to some small number of
functionalities, the data preparation activity was
limited to a pre-defined set of possibilities to be
performed. Hence, that may have influenced
negatively some ratings. Nevertheless, although a little
bit of effort was needed to fully comprehend the model,
it was possible to see a good evaluation of its ease of
use.
5.3 Perceived Usefulness
Regarding the perceived usefulness, the majority of the
respondents declared that they perceived the MAM to
be indeed useful. Only one participant rated it as
average. However, the level of usefulness of the
guideline is directly influenced by the level of
experience that one might have in the subject.
Regarding this specific participant, as she had a little
bit more experience on the subject, she did not need
guidance for all activities depicted within the model.
Moreover, she also stated that she missed some
activities within the model to better handle missing
data. However, as mentioned earlier, the model was
built for an audience without prior experiences with
data analytics and on preparing data, hence it had to be
kept simple to what was feasible to the majority of this
professionals. Therefore, considering the target
audience and the problems that they face when trying
to do KD, the overall perceived usefulness of the model
fulfil the expectations.
5.4 Intention to Use
Last but not least, most domain experts declared that
they indeed intent to use the model in future activities.
In the same way to what happened on the perceived
usefulness evaluation, only one participant rated her
intention to use the MAM as average, which again
relates to her level of experience on the matter and
which tasks she intent to perform, as explained above.
Therefore, as 80% of the respondents declared that
they have the intention to use the model, it also
achieved the expectation on this matter.
Self-service Data Science for Healthcare Professionals: A Data Preparation Approach
733

6 CONCLUSION
Data analytics, as could be seen throughout this
document, is a very promising and important field
nowadays, as it is still growing and being adapted
within many companies around the globe. The paper
Power to the People! (Spruit & Jagesar, 2016)
represented a starting point for spreading the power of
KD, of technology, to people who are no experts in the
area, who have other qualities that could indeed help
on extracting information as good as (or sometimes
better) data analysts or scientists. This study followed
the same line of research, focusing in the applied data
science area of study, and showed to be significant, as
we could see it to be of value for domain experts to start
exploring data in a simpler and structured way, as per
the good results during the evaluation of the guideline.
Additionally, answering the research question
presented earlier in this research, first, the original
CRISP-DM was identified as being indifferent
regarding the type of professional who is following it,
when in reality the type of user who is conducting the
analysis, in conjunction with the type of analytical
project and data available, should determine how to
pursue an activity, and which tasks to actually perform.
Thus, an adaptation of the CRISP-DM was proposed,
aligning the objectives of the framework with what is
believed to be indeed important for domain experts
(based on the interviews, data quality assessment, and
literature review), where only the activities (as well as
their inner tasks) that would add some value into the
analysis, and at the same time, would be feasible
considering all the mentioned constraints, were
suggested to be followed by domain experts. Second,
regarding the Data Preparation phase, one cannot
prepare any data without first defining a project context
and going through the Data Understanding phase. It
was not possible to focus only in the Data Preparation
task, without providing domain experts the means and
the goals for preparing the data. Thus, to facilitate the
Data Preparation phase the Business Understanding
and Data Understanding phases had to be addressed
and simplified as well. Third, as mentioned earlier in
this study, Data Preparation is considered to be even
more time consuming and complicated than DM itself.
Defining how to pursue this activity, depends most of
the times to the project at hand and information
available. Thus, in order to facilitate it, the goals of this
phase had to be limited to only making the dataset
simpler and smaller, instead of fixing and cleaning all
possible scenarios, given domain experts’ time and
technical constraints. Additionally, based on the
difficulties mentioned by domain experts during the
interviews and the quality of the data that they would
be dealing with, some activities within the Data
Preparation phase were highlighted, such as Data
Integration and Data Construction, focusing on
allowing those professionals to prepare the data, and at
the same time, to not spend more time than required on
this task. Therefore, Data Preparation for domain
experts such as healthcare professionals should not
have the purpose of creating a perfect dataset, but
rather to create a simpler and smaller one for further
exploration.
REFERENCES
Baraldi, A. N., & Enders, C. K. (2010). An introduction to
modern missing data analyses. Journal of School
Psychology, 48(1), 5–37.
Bibal, A., & Frénay, B. (2016). Interpretability of Machine
Learning Models and Representations. ESANN
European Symposium on Artificial Neural Networks, 27–
29.
Brinkkemper, S. (1996). Method engineering: Engineering of
information systems development methods and tools.
Information and Software Technology, 38(4), 275–280.
Cao, L. (2012). Actionable knowledge discovery and
delivery. Wiley Interdisciplinary Reviews: Data Mining
and Knowledge Discovery, 2, 149–163.
Chapman, P., Clinton, J., Kerber, R., Khabaza, T., Reinartz,
T., Shearer, C., & Wirth, R. (2000). Crisp-Dm 1.0.
CRISP-DM Consortium.
Fayyad, U., Piatetsky-Shapiro, G., & Smyth, P. (1996). From
Data Mining to Knowledge Discovery in Databases. AI
Magazine, 17(3), 37–54.
Francis, J., Johnston, M., Robertson, C., Glidewell, L.,
Entwistle, V., Eccles, M., & Grimshaw, J. (2010). What
is an adequate sample size? Operationalising data
saturation for theory-based interview studies. Psychology
and Health, 25(10), 1229–1245.
Linden, A., Vashisth, S., Sicular, S., Idoine, C., Krensky, P.,
& Hare, J. (2017). Magic Quadrant for Data Science
Platforms. G00301536. Gartner.
Luo, Q. (2008). Advancing Knowledge Discovery and Data
Mining. First International Workshop on Knowledge
Discovery and Data Mining (WKDD 2008), 7–9.
Raghupathi, W., & Raghupathi, V. (2014). Big data analytics
in healthcare: promise and potential. Health Information
Science & Systems, 2(1), 3.
Rozanski, N., & Woods, E. (2005). Software Systems
Architecture: Working with Stakeholders using
Viewpoints and Perspectives. Addison-Wesley.
Spruit, M., & Jagesar, R. (2016). Power to the People! - Meta-
Algorithmic Modelling in Applied Data Science. Proc. of
the 8th Int. Joint Conf. on Knowledge Discovery,
Knowledge Engineering and Knowledge Management,
1, 400–406.
Tsai, C.-W., Lai, C.-F., Chao, H.-C., & Vasilakos, A. V.
(2015). Big data analytics: a survey. Journal of Big Data,
2(1), 21.
HEALTHINF 2020 - 13th International Conference on Health Informatics
734
