
Predicting Depression with Social Media Images
Stankevich Maxim
1
, Nikolay Ignatiev
2
and Ivan Smirnov
1,2
1
Federal Research Center ”Computer Science and Control” of RAS, Moscow, Russia
2
RUDN University, Moscow, Russia
Keywords:
Machine Learning, Classification, Depression, Social Media, Image Recognition.
Abstract:
The study is focused on the task of depression detection by analyzing images related to social media users.
We formed a dataset that consists of 485,121 images from profiles of 398 volunteers that provided access to
their data in popular Russian-speaking social media Vkontakte. The results of the depression questionnaire
were used to distinguish depression and control groups and set the binary classification task. We observed 3
types of users’ images: profile photos, images from posts, and albums. We applied object detection methods
to retrieve object features that determine the presence of 80 different object classes on users’ images. To aim
the task, the different machine learning algorithms were trained on the objects and color features. Our models
achieved up to 65.5% F1-score for the task of revealing depressed users.
1 INTRODUCTION
Depression is one of the most common mental disor-
ders in the world and it can significantly affect the life
quality of individuals. According to the World Health
Organization, millions of people around the world
suffer from different forms of depression (Moussavi
et al., 2007). People affected by depression often
hide or ignore this fact of mental disorder presence,
and as a consequence, the large percentage of depres-
sion cases are left without professional and appropri-
ate treatment, which in the worst case can lead to sui-
cide. At the same time, there are effective psycholog-
ical and pharmacological treatments for depression.
Considering both facts, developing methods that can
detect signs of depression in population is of great in-
terest.
Social networks considered by researches as an in-
exhaustible source of data that can be used to study
human behavior in modern society. There are a grow-
ing amount of studies devoted to the task of as-
sessing mental health, personality traits and socio-
demographic characteristic of peoples by analyzing
social media data. Currently, this problem mostly rep-
resented as a machine learning task. Even if most
studies analyses text data, there is possibility to use
images posted by users to address the problem.
The study describes the task of predicting de-
pression of users by analyzing different types of im-
ages posted on social media. We formed a dataset
that matches 398 Back Depression Inventory screen-
ings and 485121 images posted by users in Russian-
speaking social media Vkontakte. We separated our
data on 3 parts: profile photos, images attached to
users’ posts and custom albums. The data were pro-
cessed to retrieve 80 object classes by utilizing Faster
R-CNN trained on the COCO dataset (Lin et al.,
2014) and color properties of images. To perform on
the depression detection task, we evaluated 3 different
sets of users’ images and retrieved features by train-
ing various machine learning methods.
2 RELATED WORK
Social networks are considered, by researchers, as
unique sources of information about individuals and
their social relationships, and modern methods of data
analysis allow us to build accurate prediction mod-
els of human behavior. Numerous studies show that
the analysis of personal pages of a social network
user can be a source of information not only about
the socio-demographic characteristics of the user but
also about their personality traits, psychological pref-
erences, and current psychological states. For exam-
ple, to solve the problem of classifying users based on
the five-factor model of human personality traits, an
analysis of a large corpus of text messages from Face-
book users was performed (Schwartz et al., 2013). It
is important to note that neuroticism and extroversion
Maxim, S., Ignatiev, N. and Smirnov, I.
Predicting Depression with Social Media Images.
DOI: 10.5220/0009168602350240
In Proceedings of the 9th International Conference on Pattern Recognition Applications and Methods (ICPRAM 2020), pages 235-240
ISBN: 978-989-758-397-1; ISSN: 2184-4313
Copyright
c
2022 by SCITEPRESS – Science and Technology Publications, Lda. All rights reserved
235

personality traits can serve as predictors of depres-
sion (Widiger and Mullins-Sweatt, 2010). In another
study, researchers evaluated the possibility of iden-
tifying user personal traits and socio-demographic
characteristics based on information about the users
liked content (Kosinski et al., 2013). Data about
music preference, from the online resource last.fm,
was used to identify reliable correlations between user
personality features and music preferences (Ferwerda
et al., 2017). It is worth noting that the most popular
approach in such studies is to create a dataset, consist-
ing of user data from a social network and the result
of a specialized questionnaire.
Currently, researchers are most interested in the
task of assessing mental health, based on informa-
tion gathered from social networks and other online
resources (Shatte et al., 2019; Kursuncu et al., 2019).
For example, for CLEF/eRisk 2018, project partici-
pants were provided with a collection of text mes-
sages from Reddit, for the purpose of detecting de-
pression and anorexia among its users (Losada et al.,
2018). The task was presented in the form of a bi-
nary classification, where participants were supposed
to build a prediction model based on the training data
that was given to them. According to the results of
the project, the best F1-score for the task of detecting
depression was 64%, and the best F1- score for the de-
tection of anorexia was 85%. Another study proposed
a dynamic assessment of the severity of the 9 major
symptoms of depression based on a semi-supervised
machine learning method. (Yazdavar et al., 2017).
The approach was tested on a dataset consisting of 23
million Twitter posts and showed a 68% average pre-
diction accuracy of 9 symptoms of depression. The
following symptoms were determined with the great-
est accuracy: loss of interest, depressed mood, and
eating disorders.
Even though most of these types of classifica-
tions are done using data gathered from text, there
are several studies that use data gathered from im-
ages (Wongkoblap et al., 2017). Images from the
popular social network Instagram were used to iden-
tify depression among its users (Reece and Dan-
forth, 2017). With the help of Amazons Mechanical
Turk crowd-sourcing platform (MTurk), a dataset was
gathered, consisting of 43950 photos from 166 volun-
teers. Workers sourced from MTurk were tasked with
classifying depression in users based on the images in
the dataset. These classifications were used to com-
pare the efficacy of the proposed machine learning
model against the efficacy of humans performing the
same task. To train the model, the following features
were extracted from the collected data: indicators of
activity on the social network, color parameters of the
photo, the presence of color filters, and the number of
faces in the images. The proposed model was able to
classify depression with an F1-score of around 65%.
The most significant predictors of depression in this
model were: hue, saturation, brightness, face count,
face presence, whether or not a filter was used, and
what type of filter was used.
According to research, emotions and mental char-
acteristics of a person have certain connections to
their color preferences (Nolan et al., 1995; Valdez and
Mehrabian, 1994). In turn, the connection between
Flickr user personalities and the color characteristics
of their uploaded photos were discovered based on
32056 photos and the results of a standard question-
naire of personality traits (Wieloch et al., 2018). It
is also worth noting the study where researchers were
looking for correlations between personality traits and
the frequency of encounters of certain groups of ob-
jects, that were classified with the help of Googles
Vision API (Ferwerda and Tkalcic, 2018).
Data gathered from Flickr was used in the creation
of regression models, capable of predicting the sever-
ity of certain user personality traits (Segalin et al.,
2016). The authors analyzed 60000 favorite images
(200 from each of the 300 users) and extracted many
color, composition, and texture characteristics, that
were used as features in the training model. A total
of 2 separate experiments were conducted: predicting
personality traits, using the results of a questionnaire
as the target parameter, and the prediction of person-
ality traits using the scores judgment from other users,
that evaluated user personality traits based on the pho-
tos that those users uploaded. Even if the second ex-
periment was successful, the first experiment demon-
strated a determination coefficient R2 of less than 0.1
among all personality traits. This study was contin-
ued in another work, where the authors set the task of
binary classification between high and low levels of
displayed personality traits on the same dataset, using
a pre-trained convolutional neural network determin-
ing the feature set (Segalin et al., 2017). The classifi-
cation accuracy in this experiment ranged from 61%
to 69% for various personality traits.
In another study, researchers used data from Twit-
ter profiles to find correlations between the images
that users posted and whether the users posting those
images were depressed or anxious (Guntuku et al.,
2019). The authors used a sample of 28749 Face-
book users to build a language prediction model for
depression and anxiety. This model was used to pre-
dict depression and anxiety in a different set of 4132
Twitter users. The researchers extracted data from
these twitter users posted and profile pictures. This
dataset included HSV (Hue-Saturation-Value) data,
ICPRAM 2020 - 9th International Conference on Pattern Recognition Applications and Methods
236
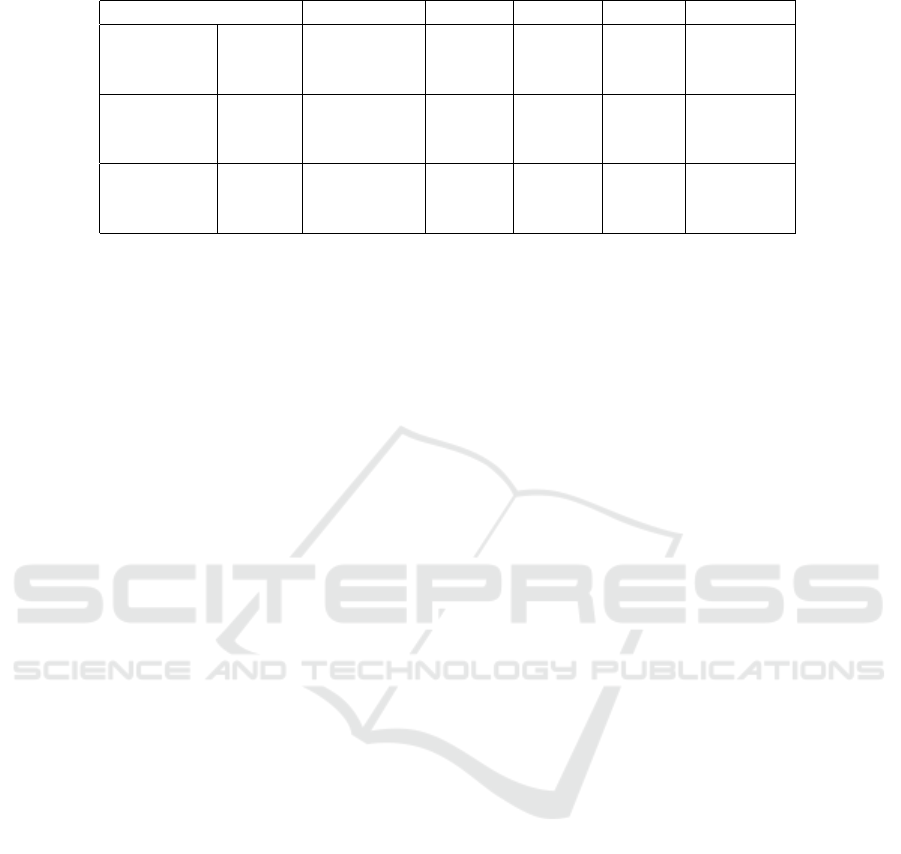
Table 1: Data statistics.
Set Image count Mean Std median User count
All
Avatars 4098 10.29 10.63 10
398Posts 23678 62.00 81.00 60
Albums 457345 1149.10 1707.09 1170
Control
Avatars 2081 10.35 10.49 10
201Posts 12015 59.78 79.28 55
Albums 227786 1133.26 1849.21 988
Depression
Avatars 2017 10.23 10.72 10
197Posts 11663 59.20 81.84 45
Albums 229559 1165.27 1825.97 1006
image aesthetics data, image content data, and face
and emotion data. The authors of this study have
found that depressed users tend to post more photos
that suppress positive emotions (rather than exhibiting
negative emotions); photos that are less aesthetically
pleasing than photos of non-depressed users; photos
which are not sharp, and which do not contain faces;
gray-scale photos.
Researchers in another study created a prediction
model using posts data from Instagram containing
hashtags related to depression (Huang et al., 2019).
The authors of this study chose this approach because
it allows for a cheaper and faster way of collecting
data about depressed users, compared to the more
common use of the depression questionnaires. Tex-
tual, behavioral, and image features were extracted
from Instagram data and a CNN (convolutional neural
network) was used to score depression on photos in
the dataset. The researchers employed transfer learn-
ing from ImageNet in order to speed up and improve
the performance of their predictive model. The best
image features based model in their experiments was
able to classify depression with an F1-score of 77%.
3 METHODS
3.1 Data Collection
The data for the study was collected from popular
Russian-speaking social media Vkontakte. To collect
the data we built a web-application that allows vol-
unteers to authorize via Vkontakte API. The volun-
teers were requested for permission to access the data
from their personal profiles in social media. Then
we asked them to fulfill a Russian adaptation of de-
pression questionnaire based on Beck Depression In-
ventory (Beck et al., 1996). The results of the ques-
tionnaire represent a depression score which is inte-
ger value on the 0-63 scale. Vkontakte has a com-
plex structure in comparison to Instagram and Flickr.
There are several different sources of users’ images
that we can retrieve from profiles.
Avatars. All images that were used by users as the
main profile photo.
Posts. Images that were attached to users’ posts in
their profiles including images attached to reposts
(similar to retweets).
Albums. Vkontakte users can create their own al-
bums and fill them with any type of images. We col-
lect all images from users’ custom albums which are
not closed.
Overall, data was collected from more than 1000
Vkontakte users. To aim binary classification task we
defined depression and control groups by using top
and bottom quartiles of Beck Depression Inventory
scores. All users with a score that less than bottom
quartile value were annotated as a control group and
all users with a score that more than top quartile value
as a depression group. Users with middle scores were
removed from observation as well as users with less
than 5 images in at least one of the sets. These steps
yielded a dataset that consists of data from 197 de-
pressed and 201 non-depressed users. The similar
approach of splitting data into two groups according
to questionnaire scores was also implemented in re-
lated works, for example in (Iacobelli et al., 2011) and
(De Choudhury et al., 2013). The general statistics on
the data presented in Table 1.
3.2 Object Features
To retrieve features from users’ images we formed
vectors that characterize the presence of different ob-
jects on them. The number of human faces on images
was utilized as a feature for depression detection in
(Reece and Danforth, 2017). We decided to extend
this idea with other types of objects. Faster R-CNN
model (Ren et al., 2015) was trained on the COCO
Predicting Depression with Social Media Images
237

dataset (Lin et al., 2014) to be capable of detecting
the presence of 80 different object types. The thresh-
old value that determines the minimal required prob-
ability yielded by the model to count this object has
been set to 0.6 in our experiments. We implemented
different strategies to calculate objects vector. As (I)
strategy we calculated the probability of meeting the
object on the photo. As (II) strategy the vectors were
formed from the objects presence frequency, which
was calculated on the basis of the probability values
given by the detector where these values were more
than the threshold. The objects vectors with (III)
strategy were formed by calculating object frequency
as well, but instead of using raw probability values we
rounded them to 1. Computed values were divided by
a number of images provided by users (except (I)).
Objects with overall sum by all users did not exceed
0.0001 were removed from data.
3.3 Color Features
Other features were retrieved from the color proper-
ties of images. We utilized OpenCV library (Bradski
and Kaehler, 2008) to compute components of follow-
ing color spaces RGB, HSV, XYZ, and LAB. We used
averaged values of these properties and standard de-
viation to form color features for all sets.
4 RESULTS
To perform on depression detection task we tested
following machine learning algorithms: Logistic
Regression (LR), Support Vector Machine (SVM),
Multi-layer Perceptron (MLP), Random Forest (RF),
Naive Bias (NB), k-Nearest Neighbors (KNN), Cat-
Boost (CAT) (Dorogush et al., 2018), and random
based classifier (RAND). Regardless of the exper-
iment and observed features, we split each of the
avatars, posts, and albums sets on 80% for train data
and 20% for test data. All hyperparameters of clas-
sification models were tuned by grid-search with 5-
fold cross-validation on train data. We also included
the number of feature dimensions yielded by principal
component analysis (PCA) performed on our sets as
an additional hyperparameter for grid-search. All re-
sults presented as a F1-score for depression class. As
a first step we evaluated the best strategies for each
of avatars, posts, and albums sets. We trained all of
the mentioned classifier algorithms and outlined best
performances in Table 2,
According to Table 2, the choice of strategy did
not affect the quality of classification with avatars im-
ages. For the posts set the (I) strategy performed
Table 2: Result of experiments using different strategies.
Image set (I) (II) (III)
Avatars .6554 .6554 .6554
Posts .6554 .6408 .6361
Albums .5572 .5481 .6518
with the highest F1-score. Surprisingly, classification
based on the object features from albums set achieved
poor results with (I) and (II) strategies compared to
(III), which we link to the chosen threshold value and
big amount of image data in this set. On the next
step, we performed classification with color features
and different combinations of object and color fea-
tures using the best strategies for each image source
(see Table 3).
Overall, Multi-layer Perceptron, CatBoost, and
Naive Bias performed better than other models. The
best result with objects only features achieved on
Avatars (obj), Posts (obj) sets with 65.54% F1-score
by MLP classifier. According to the results, color fea-
tures demonstrate inferior results comparing to ob-
jects and yielded 62.33% of F1-score with All sets
(col), which is a concatenated vector of color fea-
tures from all sets. We observed several classification
runs by CatBoost model with avatars and posts ob-
jects without PCA processing to retrieve feature im-
portance that was computed trough the training pro-
cess (see Table 4). It is interesting to note, that ob-
ject person has a high feature importance value since
it corresponds to the analysis reported in (Reece and
Danforth, 2017) where the number of human faces on
photos was also applied as a valuable feature.
By analyzing related works we came to the con-
clusion that it is hard to strictly compare our work
with other studies. We observed two related work:
(Huang et al., 2019) and (Reece and Danforth, 2017).
Both of them are based on Instagram data, which
mostly consist of real photos uploaded by users, and
this differs from Vkontakte format. The posts set
might be considered as most similar to Instagram
data, but it also contained images from reposts, which
are usually pictures and photos that are only indirectly
related to user.
Authors of (Huang et al., 2019) followed the idea
presented in (De Choudhury et al., 2016) and col-
lected data by crawling Instagram posts with indica-
tive words: ”depression” and ”suicide” for depressed
users and ”happy” for control users. This work
presents interesting results but implemented data col-
lection methods differ from questionnaire screening
and it is still not clearly evident that we compare these
approaches. The work presented in (Reece and Dan-
forth, 2017) has more similarities with ours. The class
partition in this study is 43% (71 users) for the depres-
ICPRAM 2020 - 9th International Conference on Pattern Recognition Applications and Methods
238
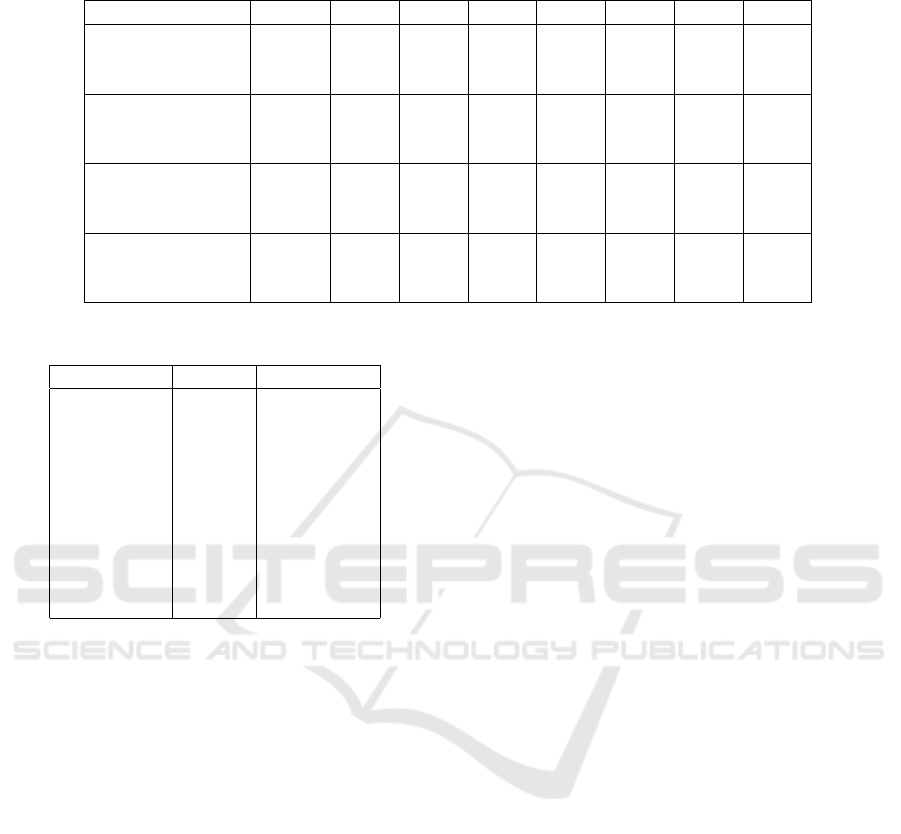
Table 3: Result of experiments on different combinations of features and image sets. All results presented as F1-score for
depression class. obj - object features; col - color features.
Feature set RAND LR SVM MLP RF CAT NB KNN
Avatars (obj) .4858 .5175 .5249 .6554 .5166 .5977 .6256 .5779
Avatars (col) - .5376 .5482 .4988 .5636 .6172 .5128 .5469
Avatars (obj+col) - .5669 .5395 .5243 .5889 .6000 .6245 .5374
Posts (obj) - .5263 .5113 .6554 .5271 .5925 .6338 .5547
Posts (col) - .4958 .4854 .5214 .5255 .5609 .5033 .5509
Posts (obj+col) - .5250 .4904 .6554 .5234 .5185 .6338 .5273
Albums (obj) - .5124 .5020 .6518 .5271 .5783 .4467 .5539
Albums (col) - .5183 .4700 .4976 .5217 .5542 .4500 .5178
Albums (obj+col) - .5298 .4767 .5243 .5279 .5952 .6245 .5390
All sets (obj) - .5452 .5380 .4972 .5377 .5609 .6254 .5333
All sets (col) - .5059 .5242 .5536 .5676 .6233 .4885 .5145
All sets (obj+col) - .5361 .5575 .6554 .5172 .5542 .6118 .5240
Table 4: Feature importance.
Object type Source Importance
person Posts 5.05
tie Posts 3.43
cat Posts 3.11
cat Avatars 2.59
car Avatars 2.16
clock Avatars 2.02
person Avatars 1.83
cup Posts 1.80
clock Posts 1.69
tv Posts 1.62
sion group and 57% (95 users) for the control group.
In additional to depression questionnaire screening
they also asked volunteers about depression history
and make use of this information to form 2 sets of ex-
periments: classification using all data and classifica-
tion using posts submitted by depressed users before
the first depression incident (pre-diagnosis). The best
result for all-data was 64.7% of F1-score and 40.1%
for pre-diagnosis.
5 CONCLUSION
The present study is focused on the task of predicting
depression by using images posted by users on social
media. We built a dataset that consists of images col-
lected from Vkontakte and scores of Beck Depression
Inventory screenings which were used to determine
the binary classification task. To perform on the task
we retrieved object and color features from users’ im-
ages. Our experiments demonstrated that by utilizing
data from different sources of images in social media
such as profile photos, images attached to the posts
and custom albums it is possible to retrieve useful fea-
tures. The best performances were achieved by Multi-
layer Perceptron based classifier using object features
with 65.54% of F1-score.
We believe that to achieve better results it is nec-
essary to apply some constraints on the step of data
pre-processing. First, it seems fair that we should
deal with outliers in the data and adjust the amount
of provided images from each user to the same num-
ber. Secondly, it is important to consider the speci-
ficity of the aimed task and impose time constraints
on the data by observing only the users’ images that
were posted during a short time period before ques-
tionnaire screening. As a general idea for future work,
we planning to apply these methods to our previous
research (Stankevich et al., 2019) where we analyzed
text messages to perform on the same task.
ACKNOWLEDGEMENTS
The reported study was funded by RFBR according to
the research project 17-29-02225.
REFERENCES
Beck, A. T., Steer, R. A., and Brown, G. K. (1996). Beck
depression inventory-ii. San Antonio, 78(2):490–498.
Bradski, G. and Kaehler, A. (2008). Learning OpenCV:
Computer vision with the OpenCV library. ” O’Reilly
Media, Inc.”.
De Choudhury, M., Counts, S., and Horvitz, E. (2013). So-
cial media as a measurement tool of depression in pop-
ulations. In Proceedings of the 5th Annual ACM Web
Science Conference, pages 47–56. ACM.
De Choudhury, M., Kiciman, E., Dredze, M., Coppersmith,
G., and Kumar, M. (2016). Discovering shifts to suici-
dal ideation from mental health content in social me-
Predicting Depression with Social Media Images
239

dia. In Proceedings of the 2016 CHI conference on hu-
man factors in computing systems, pages 2098–2110.
ACM.
Dorogush, A. V., Ershov, V., and Gulin, A. (2018). Cat-
boost: gradient boosting with categorical features sup-
port. arXiv preprint arXiv:1810.11363.
Ferwerda, B. and Tkalcic, M. (2018). You are what you
post: What the content of instagram pictures tells
about users personality. In The 23rd International on
Intelligent User Interfaces, March 7-11, Tokyo, Japan.
Ferwerda, B., Tkalcic, M., and Schedl, M. (2017). Person-
ality traits and music genres: What do people prefer
to listen to? In Proceedings of the 25th Conference
on User Modeling, Adaptation and Personalization,
pages 285–288. ACM.
Guntuku, S. C., Preotiuc-Pietro, D., Eichstaedt, J. C., and
Ungar, L. H. (2019). What twitter profile and posted
images reveal about depression and anxiety. In Pro-
ceedings of the International AAAI Conference on
Web and Social Media, volume 13, pages 236–246.
Huang, Y. C., Chiang, C.-F., and Chen, A. L. (2019). Pre-
dicting depression tendency based on image, text and
behavior data from instagram.
Iacobelli, F., Gill, A. J., Nowson, S., and Oberlander, J.
(2011). Large scale personality classification of blog-
gers. In international conference on affective com-
puting and intelligent interaction, pages 568–577.
Springer.
Kosinski, M., Stillwell, D., and Graepel, T. (2013). Pri-
vate traits and attributes are predictable from digital
records of human behavior. Proceedings of the Na-
tional Academy of Sciences, 110(15):5802–5805.
Kursuncu, U., Gaur, M., Lokala, U., Thirunarayan, K.,
Sheth, A., and Arpinar, I. B. (2019). Predictive analy-
sis on twitter: Techniques and applications. In Emerg-
ing Research Challenges and Opportunities in Com-
putational Social Network Analysis and Mining, pages
67–104. Springer.
Lin, T.-Y., Maire, M., Belongie, S., Hays, J., Perona, P.,
Ramanan, D., Doll
´
ar, P., and Zitnick, C. L. (2014).
Microsoft coco: Common objects in context. In Euro-
pean conference on computer vision, pages 740–755.
Springer.
Losada, D. E., Crestani, F., and Parapar, J. (2018).
Overview of erisk: early risk prediction on the in-
ternet. In International Conference of the Cross-
Language Evaluation Forum for European Lan-
guages, pages 343–361. Springer.
Moussavi, S., Chatterji, S., Verdes, E., Tandon, A., Pa-
tel, V., and Ustun, B. (2007). Depression, chronic
diseases, and decrements in health: results from the
world health surveys. The Lancet, 370(9590):851–
858.
Nolan, R. F., Dai, Y., and Stanley, P. D. (1995). An inves-
tigation of the relationship between color choice and
depression measured by the beck depression inven-
tory. Perceptual and motor skills, 81(3
suppl):1195–
1200.
Reece, A. G. and Danforth, C. M. (2017). Instagram pho-
tos reveal predictive markers of depression. EPJ Data
Science, 6(1):15.
Ren, S., He, K., Girshick, R., and Sun, J. (2015). Faster
r-cnn: Towards real-time object detection with region
proposal networks. In Advances in neural information
processing systems, pages 91–99.
Schwartz, H. A., Eichstaedt, J. C., Kern, M. L., Dziurzyn-
ski, L., Ramones, S. M., Agrawal, M., Shah, A.,
Kosinski, M., Stillwell, D., Seligman, M. E., et al.
(2013). Personality, gender, and age in the language
of social media: The open-vocabulary approach. PloS
one, 8(9):e73791.
Segalin, C., Cheng, D. S., and Cristani, M. (2017). So-
cial profiling through image understanding: Person-
ality inference using convolutional neural networks.
Computer Vision and Image Understanding, 156:34–
50.
Segalin, C., Perina, A., Cristani, M., and Vinciarelli, A.
(2016). The pictures we like are our image: contin-
uous mapping of favorite pictures into self-assessed
and attributed personality traits. IEEE Transactions
on Affective Computing, 8(2):268–285.
Shatte, A. B., Hutchinson, D. M., and Teague, S. J. (2019).
Machine learning in mental health: a scoping review
of methods and applications. Psychological medicine,
49(9):1426–1448.
Stankevich, M., Latyshev, A., Kuminskaya, E., Smirnov, I.,
and Grigoriev, O. (2019). Depression detection from
social media texts. In Selected Papers of the XXI In-
ternational Conference on Data Analytics and Man-
agement in Data Intensive Domains (DAMDID/RCDL
2019), pages 279–289.
Valdez, P. and Mehrabian, A. (1994). Effects of color on
emotions. Journal of experimental psychology: Gen-
eral, 123(4):394.
Widiger, T. A. and Mullins-Sweatt, S. N. (2010). Clini-
cal utility of a dimensional model of personality disor-
der. Professional Psychology: Research and Practice,
41(6):488.
Wieloch, M., Kabzi
´
nska, K., Filipiak, D., and Filipowska,
A. (2018). Profiling user colour preferences with bfi-
44 personality traits. In International Conference on
Business Information Systems, pages 63–76. Springer.
Wongkoblap, A., Vadillo, M. A., and Curcin, V. (2017). Re-
searching mental health disorders in the era of social
media: systematic review. Journal of medical Internet
research, 19(6):e228.
Yazdavar, A. H., Al-Olimat, H. S., Ebrahimi, M., Bajaj, G.,
Banerjee, T., Thirunarayan, K., Pathak, J., and Sheth,
A. (2017). Semi-supervised approach to monitoring
clinical depressive symptoms in social media. In Pro-
ceedings of the 2017 IEEE/ACM International Con-
ference on Advances in Social Networks Analysis and
Mining 2017, pages 1191–1198. ACM.
ICPRAM 2020 - 9th International Conference on Pattern Recognition Applications and Methods
240
