
ECG based Human Identification using Short Time Fourier
Transform and Histograms of Fiducial QRS Features
Abdullah Biran
1
and Aleksandar Jeremic
2
1
Department of Biomedical Engineering, McMaster University, Hamilton, Canada
2
Department of Electrical Engineering, McMaster University, Hamilton, Canada
Keywords: Biomedical Signal Processing, Biometrics, Electrocardiogram, QRS Segmentation, Short Time Fourier
Transform.
Abstract: Human identification from the biological signal the Electrocardiogram (ECG) has been demonstrated in
several studies. In this paper, we present a new technique for personal identification using short time Fourier
transform (STFT) and histograms of four fiducial QRS features. We examined the applicability of our
methodology on 162 ECG records of 81 subjects from the publicly available ECG ID data base. Our
experiments show that the normalized Euclidean STFT distance can identify individuals with 95 % accuracy.
Hence, with fusing six histogram distances computed from the QRS fiducial features and applying majority
voting, the identification accuracy increases up to 100 %. These findings indicate that ECG is sufficiently
unique signal and can be useful as biometric identifier.
1 INTRODUCTION
Biometrics are potentially helpful to recognize any
identity as they rely on the individual intrinsic
characteristics and they require the physical
appearance of the person. However, with increasing
demand on security requirements of biometrics, where
the main focus here is to consider a biometric that
cannot be stolen, ECG is an emerging biometric
modality and it achieves such goal as it is a vital sign.
In addition, it has robust advantages including
universality, hidden nature and simple acquisition
(Joao, S. Cardoso, & Lourenco, 2018)
Existing ECG based human identification systems
are generally divided into two groups: fiducial points
based and non-fiducial feature based (Joao, S. Cardoso,
& Lourenco, 2018). Fiducial based systems depend on
locating heartbeat waveform points, onsets and offsets,
and then it extracts different amplitude and distance
features. Whereas in non-fiducial methods, features are
extracted without relying on fiducial points such as
using autocorrelation and wavelet coefficients
algorithms (Chun Chi , Peng Tzu, & Pie Lun, 2019).
Adrian et al. have proposed a method for human
identification using wavelet-based distance measure
(D.C. Chan, M. Hamdy, Badre, & Badee, 2008). Saiful
et al. proposed another method based on heartbeat
morphology features (Islam, Alajlan, Bazi, & S.
Hichri, 2012). Lin et al developed an algorithm based
on non-linear Lyapunov exponents, root mean square
(RMS) and support vector machine (SVM) (Lin, Chen,
Lin, Yang, & Chiang, 2014). Furthermore, Gutta and
Cheng applied discrete cosine transform (DCT) and
autocorrelation techniques for extracting non-fiducial
ECG features (Gutta & Cheng, 2016). In contrast,
Arteaga-Falconi et al proposed a numerical based
algorithm to extract fiducial based time and amplitude
features (Arteaga-Falconi, Al Osman, & El Saddik,
2016).
Liu et al. proposed a multi scale autoregressive
model method (MSARM) for human identification
using ECG (Liu, et al., 2018). Moreover, Sidek et al.
examined the feasibility of ECG signal as biometric
modality in abnormal cardiac conditions (Sidek,
Khalil, & F. Jelinek, 2014). Furthermore, Odinaka et
al. presented a multibiometric identification system
based on combining both the electrical originating
signal, the ECG, and the laser Doppler vibrometry
(LDV) (Odinaka, A. O’Sullivan, J. Sirevaag, & W.
Rohrbaugh, 2015).
In this paper, we present a method which identifies
individuals from their ECGs. To illustrate, the main
identification process starts by calculating the
normalized Euclidian STFT distance. Then, six
histogram distances computed from four fiducial QRS
features are fused to create multi-channel identification
324
Biran, A. and Jeremic, A.
ECG based Human Identification using Short Time Fourier Transform and Histograms of Fiducial QRS Features.
DOI: 10.5220/0009168303240329
In Proceedings of the 13th International Joint Conference on Biomedical Engineering Systems and Technologies (BIOSTEC 2020) - Volume 4: BIOSIGNALS, pages 324-329
ISBN: 978-989-758-398-8; ISSN: 2184-4305
Copyright
c
2022 by SCITEPRESS – Science and Technology Publications, Lda. All rights reserved
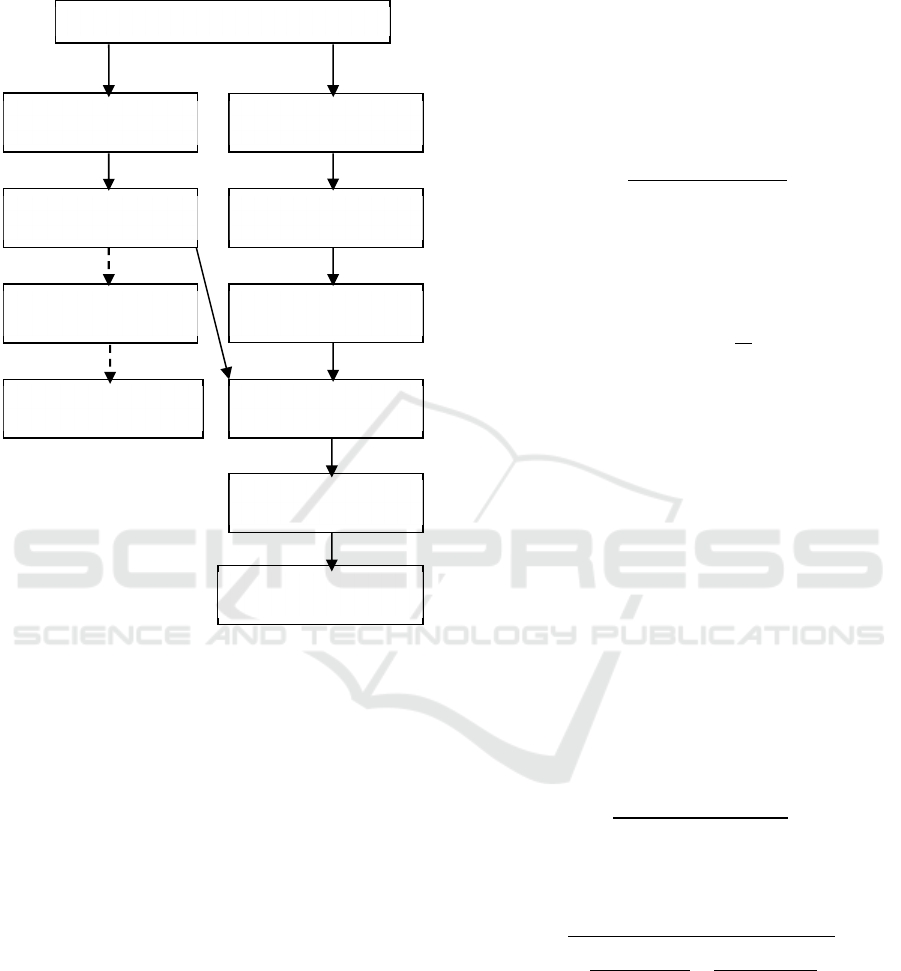
process. Finally, majority voting is applied. Figure 1
shows the block diagram of this work.
Figure 1: Block diagram of the proposed methodology.
2 PROPOSED METHODOLOGY
2.1 Short Time Fourier Transform
(Non-fiducial Technique)
Short Time Fourier Transform (STFT) converts the
time segment of any signal to its frequency
components. It provides accurate results about all the
frequencies that exists in a signal. Its strength in the
signal processing field makes it excellent tool to
distinguish between different signals. Since ECG
signal is believed to be unique, its frequency
components should vary between different subjects (V.
Oppenheim & W. Schafer, 1989).
2.1.1 Calculating STFT
In a preprocessing stage, the main ECG signals of 81
subjects were normalized before applying STFT and
then each normalized ECG signal 𝑋∊𝑅
,𝑋=
[𝑋(1),𝑋(2),.,𝑋(𝑙)] was divided equally into two
types, the training set 𝑋𝑡∊𝑅
, 𝑋𝑡=
[𝑋(1),𝑋(2),….,𝑋(ℎ)] and test set 𝑋𝑒∊𝑅
, 𝑋𝑒=
[
𝑋
(
ℎ1
)
,𝑋
(
ℎ2
)
….,𝑋
(
2ℎ
)
]
, where ℎ = 𝑙/2 .
Signal normalization is the process of changing the
range of the amplitudes to simplify the analysis. The
selected range is 0 to 1 where 0 refers to the minimum
and 1 refers to the maximum amplitudes in the ECG.
Equation (1) is used to normalize the signal:
𝑋
(
𝑚
)
=
𝑋
(
𝑚
)
−𝑀𝑖𝑛(𝑋)
𝑀𝑎𝑥
(
𝑋
)
−𝑀𝑖𝑛
(
𝑋
)
(1)
where 𝑋
(
𝑚
)
is the ECG signal and 𝑚=1,2,3,.,𝑙 is
the sample number
Then, the STFT is calculated to find the frequency
components using Equation (2):
𝑋
(
𝑘
)
=𝑋
(
𝑛
)
𝑒
(2)
where 𝑁 is the window length of the STFT and 𝑘 is the
sampling frequency. In this work, we only considered
using magnitudes of the frequency components.
2.1.2 Finding Normalized Euclidian STFT
Distance
Following the commonly used algorithms in using
ECG for human identification, the intrinsic value that
is considered to distinguish between subjects using
their ECGs is the minimum distance between the
training set and test set. In other words, such distance
should be as large as possible when it is calculated
between data sets of different subjects. However, it
should be the smallest distance when both the training
and test tests belong to the same subject.
The Euclidian distance is defined in Equation (3)
as.
𝐷=
∑(𝑋𝑡(𝑖𝑟) − 𝑋𝑒(
𝑗
𝑟))
(3)
Where, 𝑖=1,2,3,.,81 and 𝑗=1,2,,.,81 are subject
indices, and r is the record number.
However, we propose to use normalized signal:
𝐷=
∑(
𝑋𝑡(𝑖𝑟)
𝑠𝑡𝑑(𝑋𝑡(𝑖𝑟))
−
𝑋𝑒(
𝑗
𝑟)
𝑠𝑡𝑑(𝑋𝑒(
𝑗
𝑟))
)
(4)
where 𝑠𝑡𝑑 refers to the standard deviation based on the
results presented in (Li & Jeremic, 2017). This will
further enhance the identification process as there
might be some individuals who have similar frequency
components. Thus, by normalizing the values, such
similarity decreases and the performance of the
identification process increases.
Calculating STFT
Finding Normalized
STFT Distance
STFT based Decision
Makin
g
Identification Accuracy
b
ased on STFT
N
ormalized ECG Signal
QRS Complex Peaks
Detection
Feature Extraction
(
Hei
g
hts and Slo
p
es
)
Computing Histogram
Distances
Fusing All Distances
Final Decision using
Ma
j
orit
y
Votin
g
Identification Accuracy
ECG based Human Identification using Short Time Fourier Transform and Histograms of Fiducial QRS Features
325
2.1.3 STFT Decision Making
The STFT based identification process depends on
finding the distance between a test set to the training
set of all subjects using Equation (4). Then, the
decision is made when the minimum distance is found
where the expectations are that the shortest distance is
between the test and the training sets of the same
person.
2.2 QRS Peaks and Features (Fiducial
Technique)
Fiducial points refer to finding the maxima, minima,
onsets and offsets of the ECG waveform (Chun Chi ,
Peng Tzu, & Pie Lun, 2019). Since most of the
information are found in the QRS complex, which is
the largest wave in the heart beat, we developed an
algorithm to extract the Q, R and S peaks. After these
points are determined, a number of features can be
extracted including heights or slopes between these
peaks.
2.2.1 QRS Complex Peaks Detection
The R peaks are commonly-known to be the highest
peaks in the normal ECGs. Thus, if a specific threshold
is optimized, they can be localized. However, such
threshold differs between subjects as well as it also
depends on the heart rate. Therefore, the R peaks
extraction process starts by finding all peaks of
amplitudes above 0.5 in a range of thresholds 𝑇∊
𝑅
, 𝑇=𝑡1,𝑡2,𝑡3,.,𝑡𝑔. Then the R-R intervals be-
Figure 2: Automatic detection of the R peaks. In the top
image, all the possible thresholds are found, at the middle
image, only one optimized thresold is selected, in the bottom
image, all the R peaks are extracted.
Figure 3: Automatic detection of the Q and S peaks. In the
top image, the normalized ECG is shown, in the bottom
image, Q,R and S peaks are detected.
Figure 4: Automatic detection of the QRS complex peaks. In
the top image, the normalized ECG is shown, in the bottom
image, Q, R and S peaks are detected.
tween the extracted peaks in each threshold is
computed. In order to find the proper threshold 𝑡𝑜𝑝𝑡,
the algorithm automatically selects the threshold that
has the lowest standard deviation between R-R
intervals. Figure 2 shows an example of the automatic
detection of R peaks. Regarding the Q and S peaks,
there were located as the minimum peaks in right and
left of each R peak. Figure 3 shows an example of the
Q and S peaks detection.
However, 19 of the subjects from the ECG ID
database have different ECG shape, in which the T
wave is the highest wave. To this purpose we
developed a different method to detect the QRS
complex peaks in these cases. The second method
BIOSIGNALS 2020 - 13th International Conference on Bio-inspired Systems and Signal Processing
326

depends on finding the minimum peaks, S peaks, in a
defined sliding window. Then, each R is determined by
the highest peak left of each S peak while each Q is
determined by the lowest peak left of each R peak.
Figure 4 shows an example of QRS complex peaks
detection of an ECG where T wave is higher the QRS
Complex.
2.2.2 Feature Extraction
Features are special properties that describe how
signals are distinctive. For, instance, the time delay
between ECG peaks or waves, the distance between
QRS complexes and the frequency components can
provide particular details about any signal to
investigate its uniqueness.
In this work, we arbitrarily propose four features:
1) the amplitude difference between Q and R peaks, 2)
the amplitude difference between R and S peaks, 3) the
rate of time change between Q and R peaks and 4) the
rate of time change between R and S peaks.
Let 𝑐 be the total number of beats, so, 𝑄∊𝑅
,
𝑅∊𝑅
and 𝑆∊𝑅
, where 𝑄=
[𝑞
(
1
)
,𝑞
(
2
)
,……𝑞
(
𝑐
)
] , 𝑅 = [𝑟
(
1
)
,𝑟
(
2
)
,……𝑟
(
𝑐
)
]
, and 𝑆=
[
𝑠
(
1
)
,𝑠
(
2
)
,……𝑠
(
𝑐
)
]
. The four features are
then calculated using Equations (5), (6), (7) and (8)
respectively.
𝑄𝑅(𝑏)
=𝑋𝑅
(
𝑏
)
−𝑋𝑄
(
𝑏
)
(5)
𝑅𝑆
(
𝑏
)
=𝑋𝑅
(
𝑏
)
− 𝑋𝑆
(
𝑏
)
(6)
𝑄𝑆(𝑏)
=
𝑋(𝑅
(
𝑏
)
)−𝑋(𝑄
(
𝑏
)
)
𝑅
(
𝑏
)
−𝑄(𝑏)
(7)
𝑅𝑆(𝑏)
=
𝑋(𝑆
(
𝑏)
)
−𝑋(𝑅
(
𝑏
)
)
𝑆
(
𝑏
)
−𝑅(𝑏)
(8)
where 𝑏=1,2,…,𝑐 refers to the beat number.
2.2.3 Computing Histogram Distances
We have combined the four extracted features in
groups of two resulting in a total of six pairs. All the
Table 1: Pairing the four features.
Combination Features
C1
𝑄𝑅
, 𝑅𝑆
C2
𝑄𝑅
, 𝑅𝑆
C3
𝑄𝑅
, 𝑄𝑅
C4
𝑅𝑆
, 𝑅𝑆
C5
𝑄𝑅
, 𝑅𝑆
C6
𝑅𝑆
, 𝑄𝑅
feature pairs are shown in Table 1. Then using
Equation (3), the distance between each pair in the test
set and its corresponding training sets were calculated.
Therefore, a total of six histogram distances were
measured. Similarly, to what we discussed in the STFT
section, the minimum distance is expected to be when
the two pairs belong to the same subject.
2.2.4 Fusing All Distances
The normalized STFT based distance has shown
excellent performance in individual recognition.
Hence, to enhance the identification process, the
fiducial based histogram distances were fused to create
multi-channel-based identification process. Therefore,
a total of seven decisions were made when every test
set were examined to find its relevant identity.
2.2.5 Decision Making by Majority Voting
The final decision for every test set is made using
majority voting algorithm, where the subject who has
more votes from the seven decisions will be recognized
as the correct or incorrect identity. For every test
sample, if the smallest distance occurs between the
training sample and test sample of equal subject
indices, i = j, at each of the distance measurements, a
subject is correctly identified, and a correct vote is
obtained. In contrast, if the smallest distance happens
between the training sample and test sample of unequal
subject indices i ≠ j, at each of the distance
measurements, a subject is incorrectly identified and a
false vote is obtained. Then, the algorithm makes a
final decision based on the maximum number of true
votes and it determines if it is a right or wrong decision.
3 RESULTS
The publicly available ECG ID database from Physio
Net were used to test the performance of the proposed
methodology. The ECG records were measured using
single lead for a duration of 20 seconds at 500 Hz
sampling frequency from 44 men and 46 women whom
age was between 13 to 75 years.
In this work, we selected 81 subjects and for every
subject, two different records (𝑟) were chosen. In the
non-fiducial technique, each single record was divided
equally into two sets where the first half is the training
set and the second half is the test set. However, the
fiducial based technique required higher training.
Thus, each record was divided into 70% of 𝑛 as
training set and 30% of 𝑛 as test set when the algorithm
runs through the fiducial bath of the methodology.
ECG based Human Identification using Short Time Fourier Transform and Histograms of Fiducial QRS Features
327
3.1 Identification using the Normalized
STFT Distance
The ECG is aperiodic signal as the time interval
changes between its cycles. Thus, the STFT
normalized distance measure performance depends on
choosing the proper window size and the overlap
percentage. In this work, we used a sliding window of
500 samples with a 75 % overlap.
Most importantly, human recognition based on the
STFT normalized distance has shown excellent results
with up to 95% of identification accuracy which is
shown in Figure 5. As a result, we successfully
identified 77 out of the 81 subjects. However, the
remaining 4 subjects were not identified. This is
because every subject may have an optimal window
size. Although we repeated the experiment on the
second record for all the subjects, the same
identification accuracy is obtained.
3.2 Identification using QRS Complex
Features
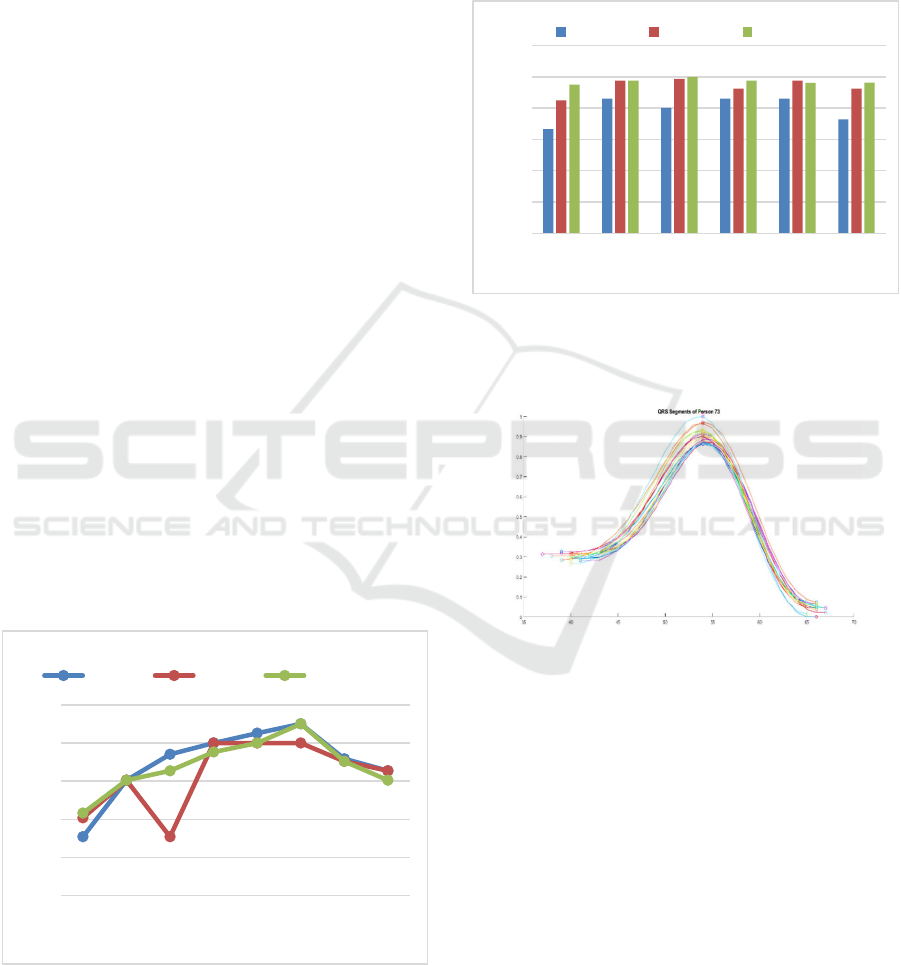
The six decisions based on the histogram distances are
labelled as D1, D2, D3, D4, D5 and D6 as shown in
Figure 6. These numbers stand for their corresponding
feature combinations (C1 to C6). The identification
process through these six decisions have shown good
results. However, such technique requires larger
training samples. This was expected as a result of the
heart rate variability even within the same record
which causes changes specially in the height features.
As seen in Figure 7, the QRS complex peaks can vary
within the same record. However, the change in the
Figure 5: Identification accuracy curve based on the
normalized STFT distance at different window sizes ranging
from 100 to 800 samples at three different overlaps including
70%, 75% and 80%.
slope features is slight. For instance, the combination
of slope features (C2) have the best performance as
shown in Figure 6. It is also observed that at 80%
training all the subject are correctly identified (D2)
whereas in the combination of height features (C1)
even at the same higher training percentage, the
identification accuracy is 80% (D1).
Figure 6: Identification accuracy based on the six histogram
distances at different training percentages (Tr). The
combination of the slope features has the best performance
(D2).
Figure 7: An example of the change in the QRS complex
dimensions in the same record.
3.3 Fusing All Decisions and Applying
Majority Voting
The non-fiducial based algorithms generally perform
better than the fiducial techniques. However, the later
methods can help in some cases to identify people who
cannot be identified by the non-fiducial algorithms.
Thus, all the seven measured distances are fused and
majority voting is applied. As a result, the QRS
complex features helped in identifying the four
subjects who are not identified by the STFT
normalized distance using majority voting. Therefore,
the identification accuracy has increased from 95%
(using only non-fiducial technique) to 100%, at 70%
training set for the fiducial technique and 50% training
set for the non-fiducial.
75
80
85
90
95
100
100 200 300 400 500 600 700 800
Identification Accuracy (%)
Window Size (Smples)
OV=70% OV=75% OV=80%
0
20
40
60
80
100
120
D1 D2 D3 D4 D5 D6
Identification Accuracy (%)
Histogram Distances
Tr=70% Tr=75% Tr=80%
BIOSIGNALS 2020 - 13th International Conference on Bio-inspired Systems and Signal Processing
328

4 CONCLUSIONS
ECG based human identification has shown promising
results (David, Silva, Gamboa, Fred, & Figueiredo,
2013), (Zhang , Zhou, & Zeng, 2017), (Odinaka, et al.,
2012). In this paper, we applied both fiducial and non-
fiducial algorithms. Our preliminary results indicate
that by measuring the STFT normalized distance,
individuals can be identified with high accuracy.
Furthermore, the identification accuracy increases after
fusing histograms distances. Thus, features of QRS
complex can play an effective role.
However, the size of training samples differs
between the two techniques. Hence further algorithm
development is needed in order to reduce it.
Nonetheless, the height and slope features depend on
the heart rate; therefore, QRS complex classification is
needed to select the most effective beats which have an
impact on the identification process. In contrast,
finding the optimal window size is an important factor
in the STFT based human identification.
ACKNOWLEDGEMENTS
The biomedical engineering department at King Faisal
University (KFU), and the Saudi Arabian Cultural
Bureau in Ottawa (SACB) are the main supporters of
this study. The authors gratefully thank KFU and
SACB for financially supporting their research
REFERENCES
Arteaga-Falconi, J., Al Osman, H., & El Saddik, A. (2016,
March). ECG Authentication for Mobile Devices. IEEE
Transactions onInstrumentation and Mesurement, 65,
591-600.
Chun Chi , W., Peng Tzu, C., & Pie Lun, H. (2019, May).
Cancelable Biometric Recognition With ECGs:
Subspace-Based Approaches. IEEE Transactions on
Forensics and Security, 14, 1323-1336.
D.C. Chan, A., M. Hamdy, M., Badre, A., & Badee, V. (2008,
February). Wavelet Distance Measure for Person
IdentificationUsing Electrocardiograms. IEEE
Transactions on Instrumentation, 57, 248-253.
David, C., Silva, H., Gamboa, H., Fred, A., & Figueiredo, M.
(2013, February). Novel fiducial and non-fiducial
approaches to electrocardiogram-based biometric
systems. Institution of Engineering Technology, 2, 64-75.
Gutta, S., & Cheng, Q. (2016, March). Joint Feature
Extraction and Classifier Design for ECG-Based
Biometric Recognition. IEEEJournal of Biomedical and
Health Informatics, 20, 460-468.
Islam, S., Alajlan, N., Bazi, Y., & S. Hichri, H. (2012, May).
HBS: A Novel Biometric Feature Based onHeartbeat
Morphology. IEEEtransactions on Information
Technology in Biomedicine, 16, 445-453.
Joao, R. P., S. Cardoso, J., & Lourenco, A. (2018, June ).
Evolution, Current challenges, and Future Possibilities in
ECG Biometrics. IEEE Access, 6, 34746-34776.
Li, H., & Jeremic, A. (2017). Semi-supervised Distributed
Clustering for Bioinformatics - Comparison Study. 10th
International Joint Conference on Biomedical
Engineering Systems and Technologies, 4, 259-264.
Lin, S.-L., Chen, C.-K., Lin, C.-L., Yang, W.-C., & Chiang,
C.-T. (2014). Individual identification based on chaotic
electrocardiogram signals during muscular exercise. The
Institution of Engineering.
Liu, J., Yin, L., He, C., Wen, B., Hong, X., & Li, Y. (2018).
A Multiscale Autoregressive Model-Based
Electrocardiogram Identification Method. IEEE Access,
18251-18263.
Odinaka, I., A. O’Sullivan, J., J. Sirevaag, E., & W.
Rohrbaugh, J. (2015, January). Cardiovascular
Biometrics: Combining Mechanical and Electrical
Signals. IEEE Transactions on Information on Forensics
and Security, 10, 16-27.
Odinaka, I., Lai, P.-H., D. Kaplan, A., A. O’Sullivan, J., J.
Sirevaag, E., & W. Rohrbaugh, J. (2012, December).
ECG Biometric Recognition: A Comparative Analysis.
IEEE Transactions on Information on Forensics and
Security, 7, 1812-1824.
Sidek, K., Khalil, I., & F. Jelinek, H. (2014, November). ECG
Biometric with Abnormal Cardiac Conditions in Remote
Monitoring System. ECG Biometric with Abnormal
Cardiac Conditions, 44, 1498-1509.
V. Oppenheim, A., & W. Schafer, R. (1989). Discrete-Time
Signal Processing. New Jersey: Prentie-Hall, Inc.
Zhang , Q., Zhou, D., & Zeng, X. (2017). HeartID: A
Multiresolution Convolutional Neural Network for ECG-
Based Biometric Human Identification in Smart Health
Applications. IEEE Access, 5, 11805-11816.
ECG based Human Identification using Short Time Fourier Transform and Histograms of Fiducial QRS Features
329
