
Predicting Function Related Pain Outcomes using Comorbidity and Age
Dependent Model
Aleksandar Jeremic
1
, Dejan Nikolic
2,3
, Milena Kostadinovic
4
and Milena Santric Milicevic
2,5
1
Department of Electrical and Computer Engineering, McMaster University, Hamilton, ON, Canada
2
Faculty of Medicine, University of Belgrade, Belgrade, Serbia
3
Physical Medicine and Rehabilitation Department, University Children’s Hospital, Belgrade, Serbia
4
Clinical Center of Serbia, Belgrade, Serbia
5
Institute of Social Medicine, Faculty of Medicine, University of Belgrade, Belgrade, Serbia
Keywords:
Pain Prediction, Logistic Regression.
Abstract:
Effective pain management can significantly improve quality of life and outcomes for various types of patients
(e.g. elderly, adult, young). In order to improve our understanding of patients’ response to pain we need to
develop adequate signal processing techniques that would enable us to understand underlying interdependen-
cies. To this purpose in this paper we develop several different algorithms that can predict function related
pain outcomes using a large database obtained as a part of the national health survey. As a part of the survey
the respondents provided detailed information about general health care state, acute and chronic problems as
well as personal perception of pain associated with performing two simple talks: walking on the flat surface
and walking upstairs. We model the correspondent responses using parametric and non-parametric models and
use health indicators (both chronic and acute) as explanatory variables. For the binomial model we propose
parametric age dependent model and then compare its performance to the performance of the multinomial and
histogram models.
1 INTRODUCTION
The presence of pain is associated with various de-
grees of disability, leading to an impaired quality
of life(McCarberg, 2008). It affects both mental
and physical aspects of the quality of life (Carma-
ciu, 2007), leading to the deconditioning, gait ab-
normalities, accidents and cognitive decline (Kaye,
2010). In a sample of elderly persons in aged care
rehabilitation units only chronic physical pain, and
not the intensity of pain, has an independent associa-
tion with a decrease in performance (Pereira, 2014)],
while in a sample of older adults attending primary
health care centers, pain intensity is associated with
both performance-based disability and self-reported
disability (Silva, 2014). The impact of pain in older
individuals may limit functioning due to the fact that
activity may exacerbate the pain or the elderly are
afraid of repeated injuries and falling (Molton, 2014).
In (McCarberg, 2008), above 80% of older veterans
with chronic pain reported that the pain has an influ-
ence on one or more higher order physical activities,
while 3% reported the influence of pain on basic ac-
tivities.
It is of great importance to timely assess the
proper management of pain, since it has numerous
consequences namely in aged population, with dys-
functions in different degrees of functional, social and
cognitive dimensions (Schofield, 2007), deteriorating
individual’s overall health, with the increase of the ne-
cessity for institutionalization, and thus increasing the
health care costs. Therefore, the complexity of pain
suggests an interdisciplinary approach both in diag-
nosis and treatment.
The survey outcomes are often modelled using the
logistic (logit) models which are commonly used for
statistical modelling of survey data consisting of de-
pendent data (outcomes of the survey) and explana-
tory data. We propose age dependent logit model in
which the regression coefficients are modelled as age
dependent and apply this model to the third national
study data set of Serbia. We then evaluate the perfor-
mance of the proposed model by using a half of the
data for training the model and using the other half as
testing. We compare the performance of the proposed
model to the empirical model based on the multivari-
Jeremic, A., Nikolic, D., Kostadinovic, M. and Milicevic, M.
Predicting Function Related Pain Outcomes using Comorbidity and Age Dependent Model.
DOI: 10.5220/0009167403190323
In Proceedings of the 13th International Joint Conference on Biomedical Engineering Systems and Technologies (BIOSTEC 2020) - Volume 4: BIOSIGNALS, pages 319-323
ISBN: 978-989-758-398-8; ISSN: 2184-4305
Copyright
c
2022 by SCITEPRESS – Science and Technology Publications, Lda. All r ights reserved
319

ate histogram estimation of the conditional probabili-
ties.
2 SIGNAL MODEL
2.1 Data Set
The performed investigation included participants
from the third national study in Serbia “National
Health Status Survey in 2013” that was performed
by the Ministry of Health of the Republic of Ser-
bia (Silva, 2014). It followed the methodology and
instruments of the European Health Interview Sur-
vey wave 2 (EHIS wave 2) (Silva, 2014), (Molton,
2014). For the purpose of this study, chronic dis-
eases and conditions were grouped in seven groups:
cardiovascular diseases (myocardial infarct, stroke
and coronary artery disease); pulmonary disease
(chronic bronchitis and asthma); diseases of muscu-
loskeletal system (lower back disorder, neck disor-
der, arthrosis); diabetes; hyperlipidemia; hyperten-
sion and other chronic diseases (depression, cancer,
urinary incontinence, kidney problems and liver cir-
rhosis) (Schofield, 2007). We used SF-36 version 2.0
(SF-36v2) in evaluation of pain presence and its de-
gree (Hawker, 2019). We classified pain in four cate-
gories (none; mild; moderate and severe) (Schofield,
2007). The walking difficulty was assessed by dif-
ficulty in walking up or down 12 steps. The asked
question was: Do you have difficulty walking up or
down 12 steps?; and proposed answers were: no dif-
ficulty, some difficulty, a lot of difficulty and cannot
do at all/unable to do ((Molton, 2014),(Kostadinovic,
2019)). According to the age of participants they were
grouped into three age groups (65–74 years; 75–84
years and older than 85 years) (Radosavljevic, 2013).
2.2 Age Dependent Binary Logit Model
First we define the outcome variables y
j
as pain eval-
uation variables and propose to model them using sur-
vey responses related to chronic pain questions as ex-
planatory variables X
i
. Then we model the outcome
probabilities using the odds ratio (Engel, 1988)
log
p
j
1− p
j
=
6
∑
j=0
c
ij
(θ)x
i
(1)
where p
j
= Pr{y
j
= 1} and the unknown regression
coefficients are modelled using age dependent poly-
nomial basis functions
c
ij
(θ) =
n
∑
l=1
α
i,l,l
θ
l−1
(2)
and α
i, j,l
are the unknown polynomial coefficients
that will be estimated.
Then the unknown parameters are obtained by fit-
ting the above model with the empirical counts using
by minimizing the mean square error i.e. using a least
squares estimates. The probabilities of pain outcomes
are then estimated as
ˆp
j
|(x
1
, . . . , x
m
) =
e
∑
j=0
6
c
ij
(
ˆ
θ)x
i
1+ e
∑
j=0
6
c
ij
(
ˆ
θ)x
i
(3)
2.3 Age Independent Multinomial Logit
Model
Note that the functional pain outcomes in the afore-
mentioned study include measurements of respon-
dents’ pain for two tasks: walking on the flat surface
and walking upstairs. These outcomes are most likely
correlated i.e. the respondents experiencing pain
when walking on a flat surface are expected to ex-
perience even higher pain when walking upstairs. In
order to account for possible correlation we propose
to model the join probability density (mass) function
by combining the pain outcomes into a single vector
consisting of two binary scalar components. There-
fore our lumped vector y has four possible states. Al-
though one of the states is not very likely ( flat walk
pain 0, upstairs walk pain 1) we keep it for the com-
pleteness of the model as well as a semi-validation as
the probability of that state is expected to be low.
Then the proposed logit model is given by (Dar-
roch and Ratcliff, 1972)
log
p
01
p
00
= β
T
01
x+ z
01
(4)
log
p
11
p
00
= β
T
01
x+ z
11
(5)
log
p
10
p
00
= β
T
01
x+ z
10
(6)
p
00
= 1− p
01
− p
10
− p
11
(7)
where probability of outcome (0,0) was chosen as
pivot variable and β
ij
and z
ij
are unknown model co-
efficients. Similarly to the previous case using empir-
ical estimates of probability mass function based on
the event frequency we estimate the unknown coef-
ficients using the least squares fit. Using these esti-
mates we estimate the probabilities as
ˆp
00
=
1
1+ β
T
01
x+ z
01
+ β
T
01
x+ z
11+β
T
01
x+z
10
(8)
ˆp
01
= ˆp
00
ˆ
β
T
01
x+ ˆz
01
(9)
ˆp
11
= ˆp
11
ˆ
β
T
11
x+ ˆz
11
(10)
ˆp
10
= ˆp
10
ˆ
β
T
10
x+ ˆz
10
(11)
BIOSIGNALS 2020 - 13th International Conference on Bio-inspired Systems and Signal Processing
320
10 20 30 40 50 60 70 80 90 100
0
200
400
600
800
1000
1200
1400
Figure 1: Age Histogram.
2.4 Empirical Histogram
Finally, for comparison purposes we propose to esti-
mate the pain outcomes using so called ”naive” esti-
mator in which conditional probabilities are obtained
from the corresponding frequency counts. Namely,
let n
ij
|x
1
, . . . , x
6
be the number of instances for which
y
1
= i and y
2
= j when x = [x
1
, . . . , x
6
]. Then we esti-
mate conditional probability
ˆp(y
1
= i, y
2
= j|X
1
= x
1
, . . . X
6
= x
6
) =
n
ij
|x
1
, . . . , x
6
∑
i, j
n
ij
|x
1
, . . . , x
6
(12)
Note that each of the explanatory variables has
one of 4 possible states and hence our explanatory
vector has maximum of 64 possible values. In our
data set we have all the possible combinations and
hence can use the aforementioned empirical estima-
tor without any adjustments. In general, it is possible
that some of the possible combinations will not ap-
pear in the training data set. In these cases, it is pos-
sible to perform estimation of conditional probabili-
ties using a basis functions approach similar to kernel
smoothing of the probability density function estima-
tion. Namely the pmf estimates have confidence inter-
vals and missing data could be interpolated based on
the estimates and confidence intervals of the nearest
neighbours.
3 RESULTS
In order to evaluate the performance we divide the
available data set in two parts. We use the first part for
estimating the unknown coefficients in the parametric
models and conditional pmfs in the non-parametric
model. Then we count the number of incorrect classi-
fications i.e. for each respondent we calculate model
based prediction of the most likely pain outcomes and
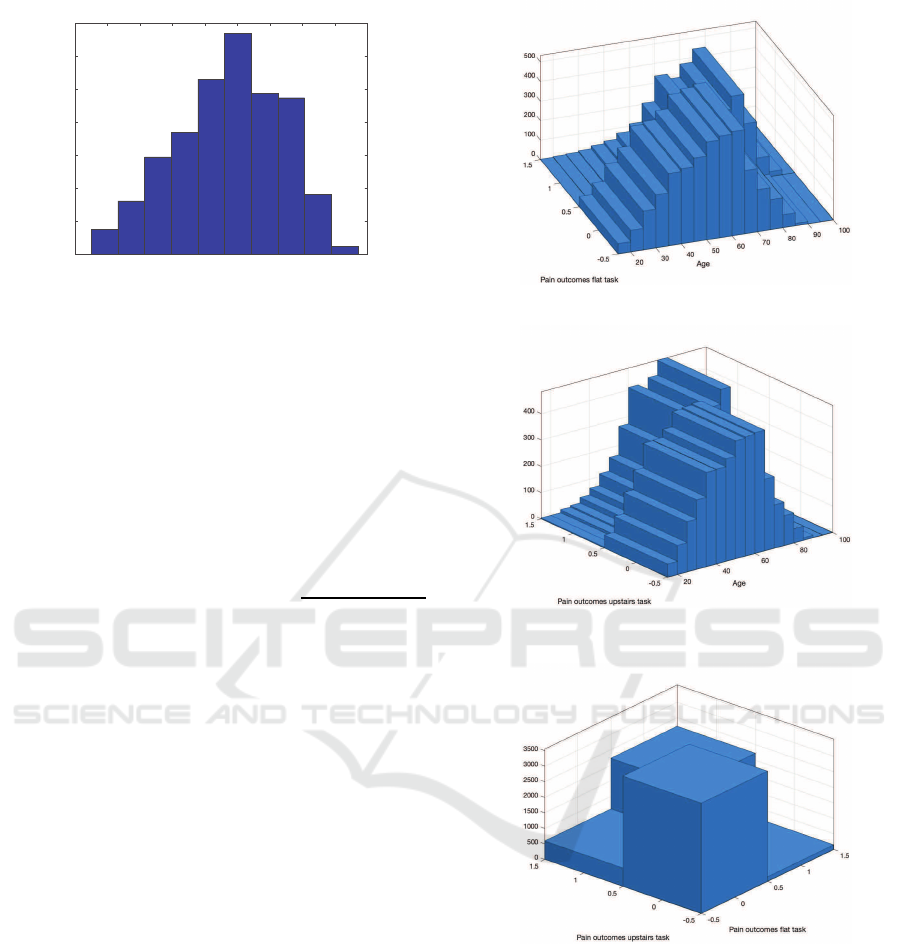
Figure 2: Histogram of age and pain outcome - flat task.
Figure 3: Histogram of age and pain outcome - upstairs
task.
Figure 4: Histogram of pain outcomes.
compare it to the actual outcomes. Using these counts
we calculate so called probabilities of anomalies ε
ij
for age dependent model and ε
ij,i
′
j
′
for multinomial
and empirical histogram models where ij refers to the
binomial vector estimate and i
′
j
′
to the observed vec-
tor. In order to make results comparable, we calculate
the corresponding overall probability of error.
In Figures 2-4 we illustrate the statistical proper-
ties of the data using the histograms. As expected the
Figure 4 illustrates correlation between the pain out-
comes. We removed all the patients who failed to at
least one of the questions which resulted in the final
Predicting Function Related Pain Outcomes using Comorbidity and Age Dependent Model
321

Table 1: Goodness of fit - parametric models.
Binomial Multinomial model
Group 1 0.141 0.163
Group 2 0.121 0.134
Group 3 0.101 0.987
Group 4 0.098 0.081
Table 2: Probabilities of error binomial model.
flat task upstairs task
Group 1 0.101 0.143
Group 2 0.087 0.076
Group 3 0.075 0.081
Group 4 0.072 0.061
Table 3: Probabilities of error multinomial model.
flat task upstairs task
Group 1 0.121 0.152
Group 2 0.101 0.92
Group 3 0.082 0.115
Group 4 0.088 0.072
Table 4: Probabilities of error histogram model.
flat task upstairs task
Group 1 0.132 0.141
Group 2 0.085 0.094
Group 3 0.099 0.101
Group 4 0.102 0.098
number of respondents being equal to 6524.
In Table 1 we illustrate the goodness-of-fit for two
parametric models and all age groups. As it can be
seen the parametric models seem to perform better
for older patients. In Tables 2 - 4 we illustrate the
overall probabilities of errors for all of the proposed
models. The performance of the proposed models in-
creases with the age of respondents and as expected
this improvementis best for the age dependent model.
4 CONCLUSIONS
In this paper we proposed several models that can be
used to predict pain outcomes using health indicators
and demonstrated their performance using a real data
set obtained from the national health survey. From the
academic standpoint the proposed models can provide
additional insight into intricate multidimensional de-
pendencies between pain and health indicators. From
the clinical standpoint it could enable practicians to
attempt to manage pain effectively by focusing on the
parameters of interest. Therefore, further studies are
advised on multidimensional levels of pain and its ef-
fects on physical functioning in patients with param-
eters that could have effects not only on pain severity
degree but disability degree as well. Furthermore, ad-
equate detection of potential patients with this model
will effect decision making policies for diagnosis and
treatment of both components of disability (pain and
physical functioning). An effort should be placed on
defining similarity measures that would enable us to
create homogeneous groups of patients and then eval-
uate our ability to predict the pain within those ho-
mogenous groups. To this purpose we also plan to
develop fully multinomial models including both ex-
planatory and outcome variables. Since perception of
pain is rather subjective, this model would enable us
to identify parameters of interest and thus design sur-
veys that will be focused on particular groups of pa-
tients. Ultimately we expect that it would create mod-
els that would enable us to study personal biases and
potentially remove them from outcomes thus enabling
health care system to deliver optimized pain manage-
ment to the general population.
In addition we plan to compare our results to the
performance of machine learning techniques such as
support vector machines (SVM) and random forrest
(RF). Since the accuracy of these techniques depend
on availability of large data sets we expect to be able
to obtain a good benchmark. Furthermore, since the
number of respondents is large we expect to be able to
define a deep learning model by by using more than
half of the data for the neural network training. We
plan to compare the performance as a function of the
training set size.
REFERENCES
Carmaciu, C. (2007). Health risk appraisal in older people
3: Prevalence, impact and context of pain and their
implications for gps. Br. J. Gen. Pract, 1(57):630–
635.
Darroch, J. and Ratcliff, D. (1972). Generalized iterative
scaling for log-linear models. The Annals of Mathe-
matical Statistics., 43(5):1470–1480.
Engel, J. (1988). polytomous logistic regression. Statistica
Neerlandica, 42(1):233–252.
Hawker, G. (2019). Measures of adult pain: Visual analog
scale for pain (vas pain), numeric rating scale for pain
(nrs pain), mcgill pain questionnaire (mpq), short-
form mcgill pain questionnaire (sf-mpq), chronic pain
grade scale (cpgs), short form-36 bodily pain scale (sf-
36 bps), and measure of intermittent and constant os-
teoarthritis pain (icoap). Arthritis Care R, 9(2):47.
Kaye, A. (2010). Pain management in the elderly popula-
tion: A review. Ochsner J., 10:179–187.
Kostadinovic, M. (2019). A national health survey. Int J
Environ Res Public Health, 19(1):37.
BIOSIGNALS 2020 - 13th International Conference on Bio-inspired Systems and Signal Processing
322

McCarberg, B. (2008). The impact of pain on quality of
life and the unmet needs of pain management: Results
from pain sufferers and physicians participating in an
internet survey. Am. J. Ther, 15(1):213–220.
Molton, I. (2014). Overview of persistent pain in older
adults. Am. Psychol., 69:197–207.
Pereira, M. (2014). Self-reported chronic pain is associated
with physical performance in older people leaving
aged care rehabilitation. Clin. Interv. Aging, 9:259–
265.
Radosavljevic, N. (2013). Estimation of functional recovery
in patients after hip frac-ture by berg balance scale re-
garding the sex, age and comorbidity of participants.
Geriatr Gerontol Int, 13(1):365–371.
Schofield, P. (2007). Pain in older adults: Epidemiology,
impact and barriers to management. Rev. Pain, 1:12–
14.
Silva, A. (2014). Pain intensity is associated with both
performance-based disability and self-reported dis-
ability in a sample of older adults attending primary
health care centers. Disabil. Health J., 7:457–465.
Predicting Function Related Pain Outcomes using Comorbidity and Age Dependent Model
323
