Classification of Hand Movement in EEG using ERD/ERS and
Multilayer Perceptron
Pavel Mochura and Pavel Mautner
Department of Computer Science and Enginnering, University of West Bohemia, 22 Univerzitn
´
ı, Pilsen, Czech Republic
Keywords:
Electroencephalography, ERD/ERS, Neural Network, EEG Signal Classification, Feature Vectors.
Abstract:
Continuous EEG activity in the measured subjects includes different patterns depending on what activity the
subject performed. ERD and ERS are examples of such patterns related to movement, for example of a hand,
finger or foot. This article deals with the detection of motion based on the ERD/ERS patterns. By linking
ERD/ERS, feature vectors which are later classified by neural network are created. The resulting neural
network consists of one input and one output layer and two hidden layers. The first hidden layer contains
3,000 neurons and the second one 1,500 neurons. A training set of feature vectors is used for the training of
this neural network and the back-propagation algorithm is used for the subsequent adjustment of the weights.
With this setting and training, the neural network is able to classify motion in an EEG record with an average
accuracy of 79.92%.
1 INTRODUCTION
Since the beginning of time humanity has been
plagued by many diseases and medical conditions.
One of those medical conditions is a stroke, which
can be caused, for example, by high blood pressure.
People who have survived a stroke may be perma-
nently partially paralyzed and therefore have limited
limb mobility. This paper seeks to help these patients,
specifically ones with limited hand mobility.
Electroencephalography is commonly used as
a recording technique for non-invasive BCI (Brain-
computer interface) systems. BCI provides a connec-
tion between a human and an external device or ap-
plication using neurophysiolohical signals. BCI sys-
tems can be divided into two types, invasive and non-
invasive. Invasive BCI is directly implanted in brain
tissue, while non-invasive BCI uses electrophysiolog-
ical records.(Birbaumer and Cohen, 2007)
BCI technology can increase the effectiveness of
rehabilitation and thus improve muscle control for
stroke patients and other patients with limited mobil-
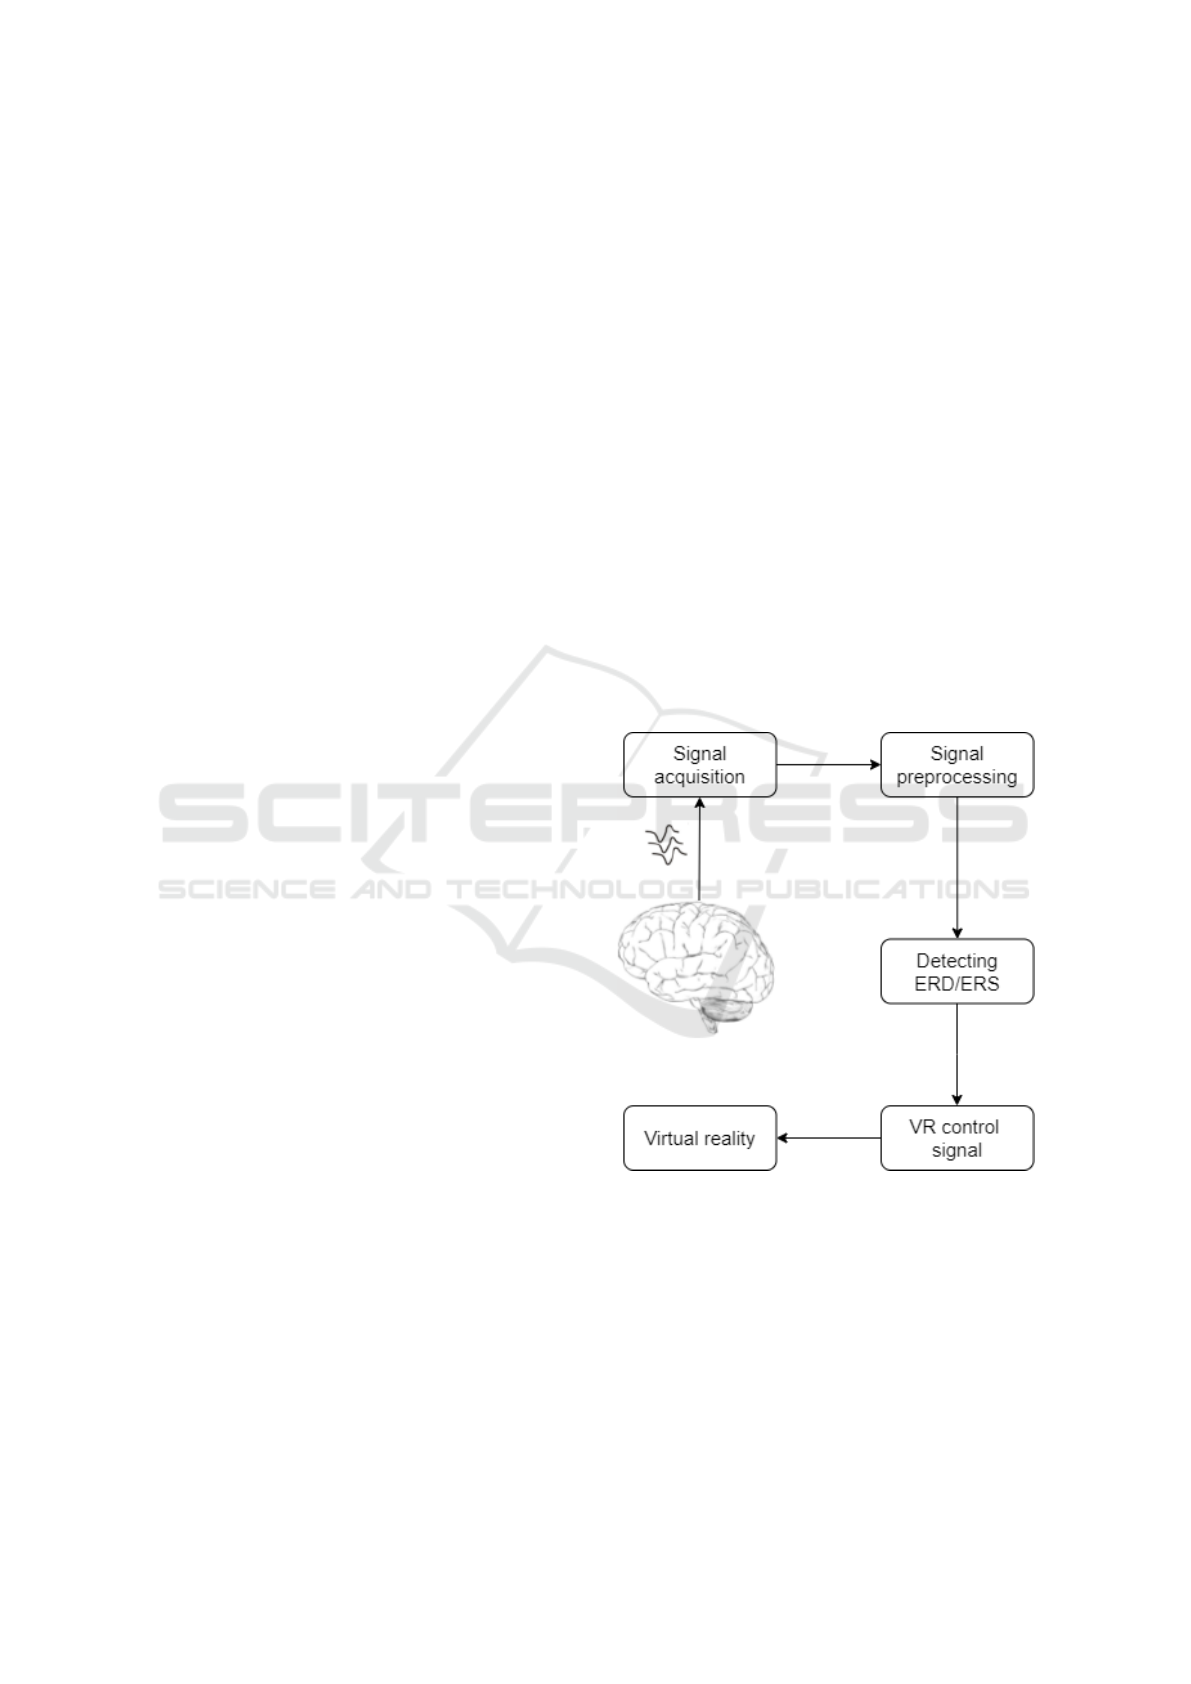
ity. This can be done by detecting ERD/ERS in the
brain activity and supply the patient’s impaired mus-
cle control, e. g. send trigger fig. 1.
Artifical neural network (ANN) was used for
classification of the movement. Accuracy of the
ERD/ERS pattern classification by this neural net-
work was aproximately 80% in our case. After a mi-
nor modification (converting the classifier to online
mode) it is possible to link the classifier to virtual re-
Figure 1: BCI system that is capable of detecting ERD/ERS
from spontaneous imaginary movements. The intended
movement will be induced by electrical stimulation.
ality (VR) kit. The affected patient will just put on
a VR kit, with a book loaded, in which the patient
will be able to browse at will only by thinking of hand
movement.
For data processing and neural network classifi-
cation, the Python programming language with MNE
and Keras tools was used.
The structure of this article is as following. Chap-
Mochura, P. and Mautner, P.
Classification of Hand Movement in EEG using ERD/ERS and Multilayer Perceptron.
DOI: 10.5220/0009167007130717
In Proceedings of the 13th International Joint Conference on Biomedical Engineering Systems and Technologies (BIOSTEC 2020) - Volume 5: HEALTHINF, pages 713-717
ISBN: 978-989-758-398-8; ISSN: 2184-4305
Copyright
c
2022 by SCITEPRESS – Science and Technology Publications, Lda. All rights reserved
713

Figure 2: This chart shows filtered, squared, averaged and
normalized epochs (54 epochs found). The X-axis indicates
the time that is defined from -2.5 to 0.5. The Y-axis indi-
cates the power of signal.
ter 3 describes what ERD/ERS is and how it can be
calculated. This chapter also describes the creation of
feature vectors from the obtained ERD/ERS. Chapter
4 describes in detail the scenario used in the measure-
ment, the course of the measurement and the hard-
ware used for the measurement. The chapter 5 de-
scribes the structure of the artificial neural network
and it’s configuration in detail. Obtained results are
also discused here. Conclusions and future work are
mentioned in the last chapter 6
2 STATE OF THE ART
The idea of BCI was originally proposed by Jaques
Vidal in (Vidal, 1973) where he proved that signals
recorded from brain activity could be used to effec-
tively represent a user’s intent.
The author of (Sepulveda, 7 05) used features
produced by Motor Imagery to control a robot arm.
Features such as the band power in specific fre-
quency bands (alpha: 8-12Hz and beta: 13-30Hz)
were mapped into right and left limb movements. In
addition, they used similar features with Motor Im-
agery, which are the ERD/ERS comparing the sig-
nal’s energy in specific frequency bands with respect
to the mentally relaxed state. It was shown in (Mo-
hamed, 2011) that the combination of ERD/ERS and
Movement-Related Cortical Potentials improves EEG
classification as this offers an independent and com-
plimentary information.
A single trial right/left hand movement classifica-
tion is reported in (Kim et al., 2003). The authors an-
alyzed both executed and imagined hand movement
EEG signals and created a feature vector consisting
of the ERD/ERS patterns of the mu and beta rhythms
and the coefficients of the autoregressive model. Arti-
ficial Neural Networks is applied to two kinds of test-
ing datasets and an average recognition rate of 93% is
achieved.(H. et al., 2013)
Linear Discriminant Analysis was used to clas-
sify ERD/ERS patterns associated with Motor Im-
agery. (Pfurtscheller et al., 2000) used brain oscilla-
tions (ERS) to control an electrical driven hand or-
thosis (open or close) for restoring the hand grasp
function. The subjects imagined left versus right
hand movement, left and right hand versus no spe-
cific imagination, and both feet versus right hand, and
chieved an average classification accuracy of approx-
imately 65%, 75% and 95%, respectively.
3 EVENT-RELATED
DESYNCHRONIZATION AND
EVENT-RELATED
SYNCHRONIZATION
Certain events can block or desynchronize the ongo-
ing alpha activity (Pfurtscheller and da Silva, 1999).
These types of changes are time-locked to the event
but not phase-locked, and thus cannot be extracted by
a simple linear method, but may be detected by a fre-
quency analysis or a Fourier Transform (Pfurtscheller,
1977). This means that these events may be either
decreases or increases of power in given frequency
bands.
The first case is called Event-related desynchro-
nization (or ERD) and the second one is called Event-
related synchronization (ERS). Of course both ERD
and ERS phenomena are not only found on EEG
recordings but also on MEG recordings (Pfurtscheller,
2001). ERD/ERS phenomena can be viewed as gener-
ated by changes in one ore more parameters that con-
trol oscillations in neuronal networks.
One of the basic features of ERD/ERS measure-
ments is that the EEG/MEG power within identified
frequency bands is displayed relative to the power of
the same EEG/MEG derivations recorded during the
stimulation or resting phases a few second before the
event occurs (Krause et al., 2008) (in our case move-
ment with left or right hand). Because event-related
changes in ongoing EEG/MEG need time to develop
and to recover, especially when alpha band rhythms
are involved, the interval between two consecutive
events should last at least 10 seconds.
3.1 Computing ERD/ERS
There are multiple ways to calculate ERD/ERS from
EEG data. I chose one of the simpler methods de-
scribed below.
To calculate ERD/ERS it is necessary to filter the
input EEG data. Because ERD is located at frequen-
cies from 8 Hz to 12 Hz and ERS at frequencies from
HEALTHINF 2020 - 13th International Conference on Health Informatics
714
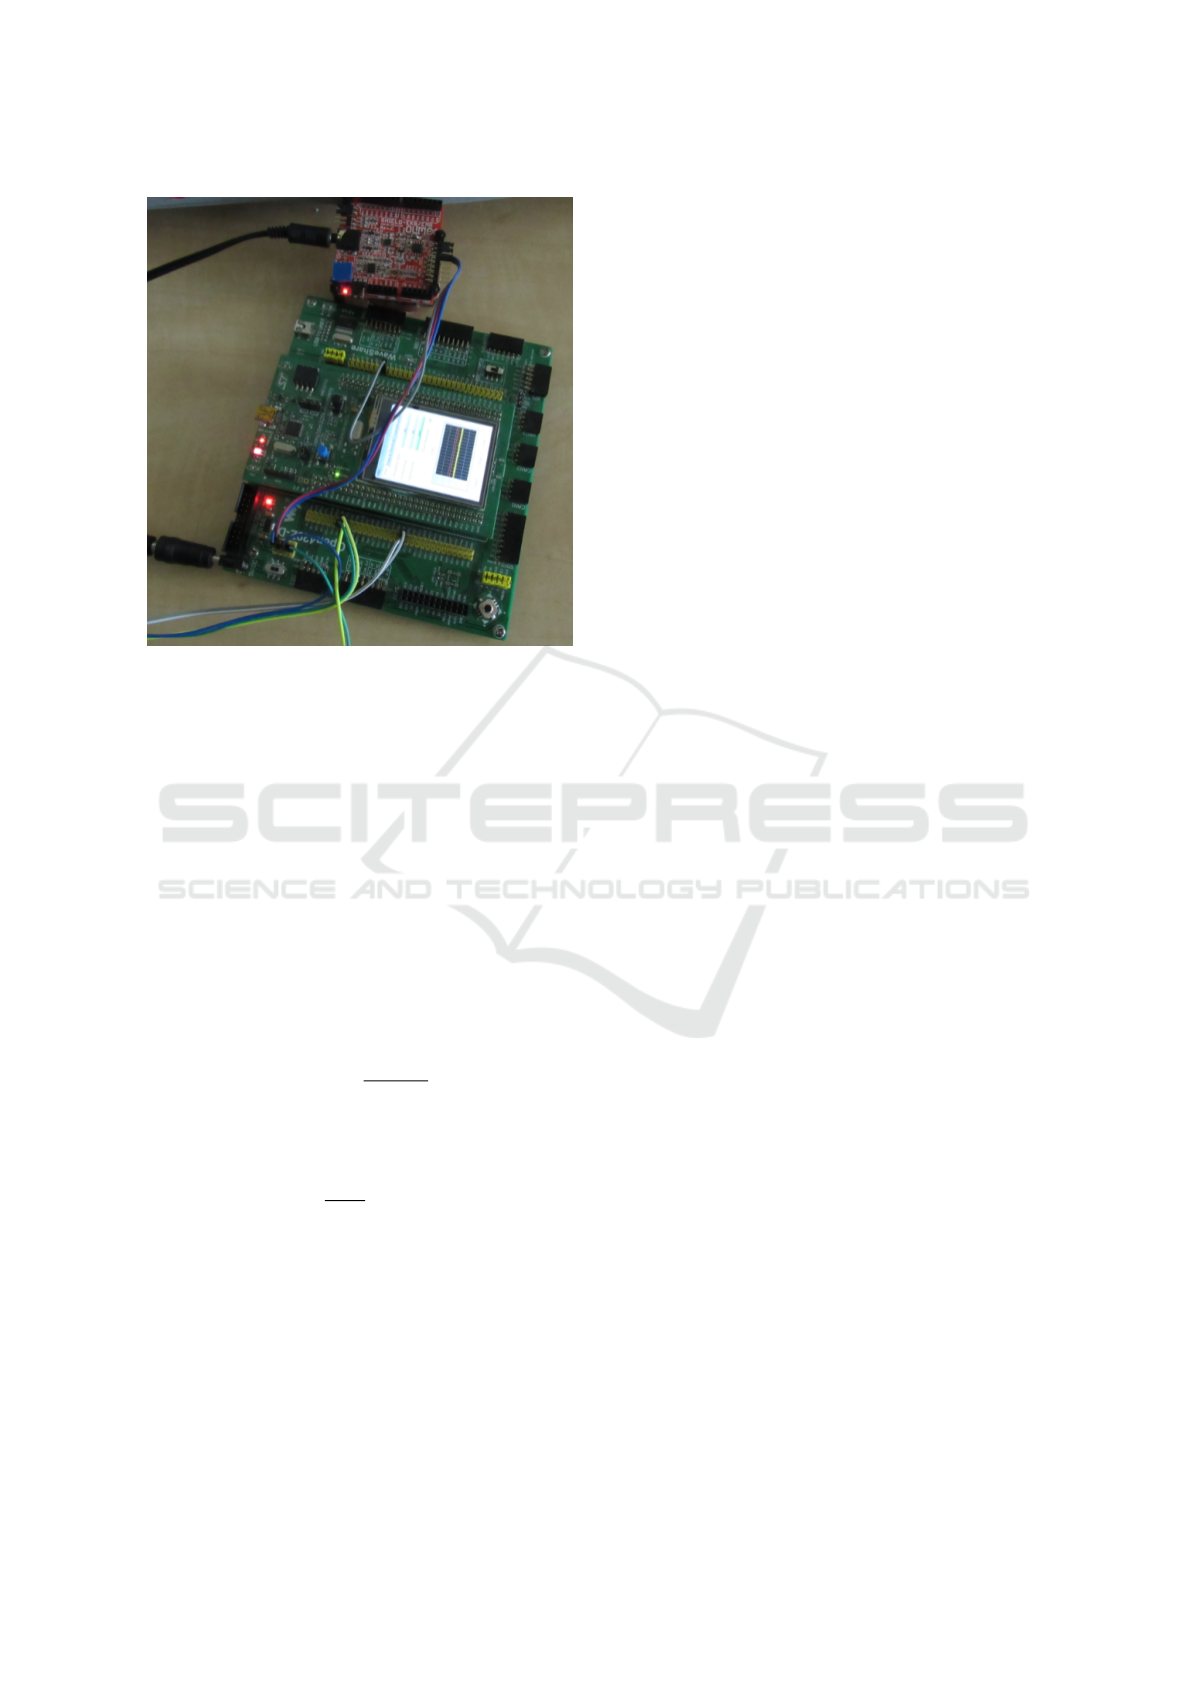
Figure 3: Microcontroller board STM324F429I-DISCO
and EKG/EMG shield from company Olimex.
14 Hz to 22 Hz, the coresponding bandpass filters are
applied to input data. Afterwards, the filtered data
are squared and coresponding epochs are found in this
data. The epochs are locked to synchronization marks
saved in EED. Each mark determines the beginning of
moving activity of the measured subject. The epochs
starts 2.5s before synchronization mark and the ends
0.5s after synchronization mark. It is important to
choose the correct EEG channel in which the data
for ERD/ERS calculation will be used. For right/left
hand movement the EEG channels C3/C4 was used.
In the next step the epoched data for channel are av-
eraged and ERD is evaluated by following expression
1. (Formaggio et al., 2013)
ERD
i
(%) =
Act
i
− R
R
100 (1)
Act represents the averaged epochs and R can be
calculated using eq. 2.
R =
1
k + 1
k+r
0
∑
i=r
0
Act
i
(2)
According to the equation we can say that R is
averaging of values in the interval [r
0
, r
0
+ k], which
r
0
is approximately two seconds before the event and
r
0
+ k is approximately 0.5 seconds after the event.
The result of this procedure for ERD can be seen
in the fig. 2 (MACHIDA and TANAKA, 2018)
3.2 Creating Feature Vectors
ERD / ERS can be imagined as two vectors contain-
ing just as many items as the given epoch contains
milliseconds. The easiest way to prepare EEG data
for classification is to create a vector with a size of the
sum of the ERD (2501 samples) and ERS (2501 sam-
ples) vector sizes. After creating the vector the ERD
vector is saved into it and the ERS vector is placed
behind ERD vector. This is a relatively simple way of
create feature vectors from the ERD and ERS, which
can then be used in most classifiers. This feature vec-
tor contains exactly 5002 items.
When ERD / ERS was calculated from the stim-
ulation phase, the number 1 was placed at the end of
the feature vectors. When ERD / ERS was calculated
from the resting phase, the number 0 was placed at
the end of the feature vectors.
4 MEASURING EEG
The whole EEG scenarion for measurement consists
of 4 cycles, each cycle containing a resting and stim-
ulating phase. At the start of each cycle, the sub-
ject is in the resting phase for one minute, where he
must sit completely at rest withnout any movement.
This includes reducing blinking to a minimum if his
eyes are open. After the resting phase, the subject en-
ters a stimulation phase that lasts 2 minutes, where
the subject moves wrist movement with left or right
hand. In the stimulation phase, the subject performs
the given task after a five second interval. The sub-
ject is notified of the phase change by a green LED
placed in front of the subject. When the LED is on,
the subject is in the stimulation phase and performs
the task. When the LED is off, the subject is in the
resting phase. The phases are then alternated this way
and each of them is repeated three times. This means
that each cycle lasts exactly 9 minutes.
As mentioned above, the whole measurement con-
sists of 4 cycles. The cycles differ from each other by
the task performed by the subject in the stimulation
phase, optionally combined with alternating open or
closed eyes. List of the cycles:
1. Movement with left hand with open eyes.
2. Movement with left hand with close eyes.
3. Movement with right hand with open eyes.
4. Movement with right hand with close eyes.
Classification of Hand Movement in EEG using ERD/ERS and Multilayer Perceptron
715

Figure 4: Structure of a multilayer binary perceptron that
contains one input and output layer and two hidden layers.
4.1 Measurement Process
To this day twelve healthy people were measured
(men of age 21-26 and women of age 18-23).
Before starting the measurement, it was explained
to each subject how the whole measurement will be
done and before each cycle it was specified how the
cycle will be done. Meanwhile the nurse attached an
EEG cap on the subject’s head, fitted with Ag / AgCl
electrodes according to a 10-20 system. Afterwards,
she attached 2 electrodes to the subject’s hand and one
ground electrode below the elbow, because the dis-
tance to the bone is smallest there. Lastly a reference
electrode of EEG cap was attached to the earlobe.
After finishing the preparation, the subject was
placed in a dark sound-proof chamber to avoid distur-
bance by the surroudings during measurement. Be-
fore closing the chamber all electrodes were checked
if their resistance is less than 5KΩ. This check was
followed by a quick reminder of what the subject
sould do in the stimulation phase. After that, the mea-
surement of the first cycle began. After each cycle,
the chamber door was opened and it was explained to
the subject what to do in the next cycle.
The EEG data were recorded by the BrainAmp
DC amplifier with BrainVision recorder software. For
EMG recording, synchronization pulses generation
and driving stimulation scenario the microcontroller
STM324F429I-DISCO board with EKG/EMG shield
of Olimex company were used. Fig. 3.
5 CLASSIFICATION RESULTS
To classify the created feature vectors, I chose an arti-
ficial neural network programmed in Python using the
Keras module.
Training and classification data are loaded from
files into arrays that represent the input layer.
The entire artificial neural network is made up of
the Sequential model, which is essentially a linear
stack of layers. This can be imagined as a layer list,
where each additional item in the list represents an
additional layer. After extensive testing a multilayer
perceptron was used, with one input layer, one out-
put layer and two hidden layers. The threshold used
was Keras default (0.5). This is a binary neural net-
work, which means that the output layer has only one
neuron.
A sigmoidal activation function is used in all the
hidden layers and in the output layer, defined by the
Eq. 3. Binary Cross-Entropy is used as a loss func-
tion.
f
s
(u) =
1
1 + e
−u
(3)
Next a back-propagation training algorithm is
used, with the number of iterations set to 100.
The biggest problem was to determine the opti-
mal number of neurons in hidden layers. The artificial
neural network was started a hundred times with each
setting and the results averaged. Testing has shown
that the best possible number of neurons for the first
hidden layer is 3 000 and 1 500 for the second hidden
layer. The accuracy of the classifier with this setting
ranged between 75.00 % - 85.42 %, where the aver-
age value of all measured results is 79.92 %. This
accuracy interval is determined by random setting of
weights when training artificial neural network. The
numbers of neurons and the resulting accuracy can be
seen in tab. 1
The resulting simplified network architecture can
be seen in Fig. 4.
Table 1: Adjusted parameters of artificial neural network
and their minimum, maximum and average accuracy. If the
number of neurons in the second layer is 0, it means that the
network had only one hidden layer.
Number of neurons in
hidden layers
Min.
acc.
Max.
acc.
Average
acc.
1. layer 2. layer
250 0 64.58% 83.33% 76.23%
500 0 70.83% 83.33% 77.35%
50 25 68.75% 85.42% 76.42%
100 50 68.75% 85.42% 77.42%
200 100 68.75% 87.50% 77,77%
500 250 70.83% 83.33% 77.35%
1 000 500 68.75% 85.42% 79.23%
2 500 1 250 75.00% 85.42% 79.90%
3 000 1 500 75.00% 85.42% 79.92%
HEALTHINF 2020 - 13th International Conference on Health Informatics
716

6 CONCLUSIONS AND FUTURE
WORK
The suggested ANN has proven to be suitable for
classification of movement in EEG data. As men-
tioned in the introduction, after a minor modification
it is possible to link the classifier to VR kit. The af-
fected patient will just put on a VR kit, with a book
loaded, in which the patient will be able to browse at
will only by thinking of hand movement.
Taking into account of the results of the other
works published in Chapter 2, we plan to do in the
future:
• Modification of ANN architecture and use of
Deep learning to improve the results of classifi-
cation.
• Complementing the scenario with the possibility
of measuring and detecting imagiantion of move-
ment.
• Connection with VR kit.
ACKNOWLEDGEMENTS
This work was supported by the University specific
research project SGS-2019-018 Processing of hetero-
geneous data and its specialized applications.
REFERENCES
Birbaumer, N. and Cohen, L. G. (2007). Brain-computer
interfaces. The Journal of Physiology, 579(3):621–
636.
Formaggio, E., Storti, S. F., Galazzo, I. B., Gandolfi, M.,
Geroin, C., Smania, N., Spezia, L., Waldner, A., Fi-
aschi, A., and Manganotti, P. (2013). Modulation
of event-related desynchronization in robot-assisted
hand performance. Journal of NeuroEngineering and
Rehabilitation, 10(1).
H., M., Samaha, A., and AlKamha, K. (2013). Automated
classification of l/r hand movement eeg signals us-
ing advanced feature extraction and machine learning.
International Journal of Advanced Computer Science
and Applications, 4(6).
Kim, J., Hwang, D., Cho, S., and Han, S. (2003). Sin-
gle trial discrimination between right and left hand
movement with eeg signal. Proceedings of the 25th
Annual International Conference of the IEEE Engi-
neering in Medicine and Biology Society (IEEE Cat.
No.03CH37439), pages 3321–3324.
Krause, C. M., Boman, P.-A., Sillanm
¨
aki, L., Varho, T., and
Holopainen, I. E. (2008). Brain oscillatory eeg event-
related desynchronization (erd) and -sychronization
(ers) responses during an auditory memory task are
altered in children with epilepsy. Seizure, 17(1):1–10.
MACHIDA, R. and TANAKA, H. (2018). Visualiza-
tion of erd/ers on leg motor imagery. International
Symposium on Affective Science and Engineering,
ISASE2018(0):1–6.
Mohamed, A.-K. (2011). Towards improved eeg interpre-
tation in a sensorimotor bci for the control of a pros-
thetic or orthotic hand. (p. 144).
Pfurtscheller, G. (1977). Graphical display and statistical
evaluation of event-related desynchronization (erd).
Electroencephalography and Clinical Neurophysiol-
ogy, 43(5):757–760.
Pfurtscheller, G. (2001). Functional brain imaging based on
erd/ers. Vision Research, 41(10-11):1257–1260.
Pfurtscheller, G. and da Silva, F. L. (1999). Event-
related eeg/meg synchronization and desynchroniza-
tion. Clinical Neurophysiology, 110(11):1842–1857.
Pfurtscheller, G., Guger, C., M
¨
uller, G., Krausz, G., and Ne-
uper, C. (2000). Brain oscillations control hand ortho-
sis in a tetraplegic. Neuroscience Letters, 292(3):211–
214.
Sepulveda, F. (2011-07-05). Brain-actuated control of robot
navigation. Advances in Robot Navigation.
Vidal, J. J. (1973). Toward direct brain-computer commu-
nication. Annual Review of Biophysics and Bioengi-
neering, 2(1):157–180.
Classification of Hand Movement in EEG using ERD/ERS and Multilayer Perceptron
717
