
Advancements in Red Blood Cell Detection using Convolutional Neural
Networks
Franti
ˇ
sek Kaj
´
anek and Ivan Cimr
´
ak
Cell-in-Fluid Biomedical Modelling and Computations Group, Faculty of Management Science and Informatics,
University of
ˇ
Zilina, Slovakia
Keywords:
Convolutional Neural Network, Red Blood Cells, Object Detection, Background Subtraction.
Abstract:
Extraction of data from video sequences of experiments is necessary for the acquisition of high volumes of
data. The process requires Red Blood Cell detection to be of sufficient quality, so that the tracking algorithm
has enough information for connecting frames and positions together. When holes occur in the detection, the
tracking algorithm is only capable of fixing a certain amount of errors before it fails. In this work we iterate
on existing frameworks and we attempt to improve upon the existing results of Convolutional Neural Network
solutions.
1 INTRODUCTION
Modeling of blood flow in microfludic devices is a
way of approaching tasks, which are hard to solve
using other means, like for example conducting real
world biological experiments. Computational mod-
elling helps to predict outcomes in circumstances that
are difficult to achieve in laboratory (Calder and et al.,
2018). It is an effective tool in optimization and de-
sign (Janacek et al., 2017; Kleineberg et al., 2017). In
order for simulations to provide valid results, fidelity
and quality of the simulation is critical for modeling
elasticity, interaction and motion of red blood cells
(RBC). This is due to, e.g. hematocrit of blood being
very high (45%), which means that realistic modeling
of RBCs is key for further improvement. RBC models
have been used to model processes inside microfluidic
devices (Cimr
´
ak et al., 2014; Jan
ˇ
cigov
´
a and Cimr
´
ak,
2015). The underlying model for cell’s membrane
is built upon the knowledge about real behaviour of
cells in biological experiments. To validate the mod-
els, experiments with single cells may be used to as-
sess the biomechanics of individual cells, such as in
(Dao et al., 2006), where the stretching of individual
cells is performed with optical tweezers. To validate
macroscopic phenomena such as cell-free layer, ex-
periments with many cells can be used. For reference
see (Fedosov et al., 2010) and references therein. In
the latter case, data extracted from video sequences
are crucial for the process of validating a model.
Validation of simulations can be done by compar-
ing them to real world biological experiments. Often,
it is possible to create videos of experiments when
conducting them. These can be analyzed manually,
but such manual processing of video data is time con-
suming. One possible way of improving the pro-
cessing time is using computer vision. Processing of
video data can then be analyzed by automated com-
puter vision algorithms. Videos provide a lot of infor-
mation about cells, for example velocity (which then
also provides information about fluid flow), shape in-
formation, count etc. As a result, the task is to create
a robust system which is capable of both detecting
and tracking cells across different videos, with as lit-
tle manual intervention as possible.
The focus of this article is to improve our exist-
ing detection methods for the task of detecting RBCs.
We take existing frameworks for object detection with
Convolutional Neural Networks (CNN), which we
previously evaluated in (Kaj
´
anek and Cimr
´
ak, 2019)
and attempt to improve their performance on our task.
CNNs have so far provided the best detection re-
sults, and as a result, improving their performance
will greatly help with cell tracking.In Section 2 we
briefly highlight the work done in this field. Then we
will go over our training and testing methodology in
Section 3 We will also evaluate the impact of amount
of data on our task, which is especially critical due to
the scarcity of usable videos (Section 4). We will go
over the existing configurations and their results, and
the suggested augmentations of the process that pro-
vide a performance uplift. After that, we will evaluate
206
Kajánek, F. and Cimrák, I.
Advancements in Red Blood Cell Detection using Convolutional Neural Networks.
DOI: 10.5220/0009165002060211
In Proceedings of the 13th International Joint Conference on Biomedical Engineering Systems and Technologies (BIOSTEC 2020) - Volume 3: BIOINFORMATICS, pages 206-211
ISBN: 978-989-758-398-8; ISSN: 2184-4305
Copyright
c
2022 by SCITEPRESS – Science and Technology Publications, Lda. All rights reserved

the impact of new data and new videos on our perfor-
mance and discuss the transferability of this detection
algorithm. The results are important for choosing the
next step for improving data processing automation.
2 RELATED WORK
Visual object detection is no new task in computer vi-
sion. Our current approach is composed of 3 exist-
ing methods, Hough transform (Illingworth and Kit-
tler, 1987)(Yuen et al., 1988), AdaBoost (Freund and
Schapire, 1999), and CNNs (Kaj
´
anek and Cimr
´
ak,
2019), which provide data for our tracking algorithm.
While Hough transform shows promise, due to be-
ing the only unsupervised method and only needs mi-
nor parametrization to function properly, it is also the
least performing method. As a result we most of-
ten resort to machine learning approaches. Machine
learning is quite common in computer vision, but is
generally used on much more complex tasks with dif-
ferent nuances. Lately, CNNs outperform a lot of tra-
ditional methods, especially when it comes to quality
of detection. CNNs are able to do a variety of tasks,
for example image classification (Krizhevsky et al.,
2017), object recognition (Donahue et al., 2013), de-
tection, segmentation (Girshick et al., 2013), or for
example region extrapolation (Ren et al., 2015). Ob-
ject detection specifically utilizes convolutions, which
represent important features in images very well. Es-
pecially in recent years, significant advances have
been made in the development of neural networks and
the propagation of information. As a result, improv-
ing existing CNN framework results is of value, since
we can expect further improvement of base perfor-
mance of these techniques in the near future. More
existing approaches are mentioned in (Kaj
´
anek and
Cimr
´
ak, 2019)
Most known CNN tasks are vastly different from
our task. General tasks on which CNNs tend to
be evaluated, may include hundreds of classes in a
varying environment and varying sizes, for example
COCO, PETS or ImageNet datasets. Our task of de-
tecting RBCs is relatively simple, it has only one class
(and background), and it has a relatively small size
variance of less than 20%. On the other hand, cell
detection has different issues. Some very common
problems are for example RBC rotation, RBC over-
lap, lighting differences and blurred motion of cells.
There is also the problem of image being 2D and cells
moving in fluid in 3D. This has an impact on their
sizes and how they stand out from the background.
The lower the cells, the more blurry their contour is.
All of these factors can make detection problematic.
There are some extreme scenarios, which make detec-
tion impossible. First such scenario is in the case of
a mismatch between the frames-per-second(FPS) of
the video and the speed of the cells, causing them to
be too blurry in the high-flow sections of the liquid.
Another such scenario is when the individual cells
are smaller than 5px in diameter. Last scenario we
observed was caused by too many cells in the video
sample, causing individual cells blurring cells around
them causing a performance downgrade even during
manual processing (Figure 1).
Figure 1: Example of blurred cells due to low FPS (Mazza.,
2017).
AdaBoost in comparison to our trained CNN
heavily underpeforms and as a result is only used as
a redundancy. This is likely underlined by not having
hand-crafted features specifically for cells, as the ex-
isting Haar Wavelet features (Viola and Jones, 2001)
do not describe our usecase very well.
3 EXPERIMENTS
For our testing methodology we need to elaborate
on our existing findings. In (Kaj
´
anek and Cimr
´
ak,
2019) we tested 3 known frameworks, Faster RCNN
(Ren et al., 2015), R-FCN (Dai et al., 2016) and
SSD(Liu et al., 2015). Faster RCNN and R-FCN pro-
vided similar results, whereas SSD underperformed
even our AdaBoost solution. These frameworks were
tested on a dataset comprised of 200 frames of a sin-
gle video, which amounted to about 8000 positives
RBC samples and about 80000 negative background
samples. We obtained best results using the Faster
RCNN framework which provided 98.3% precision
Advancements in Red Blood Cell Detection using Convolutional Neural Networks
207
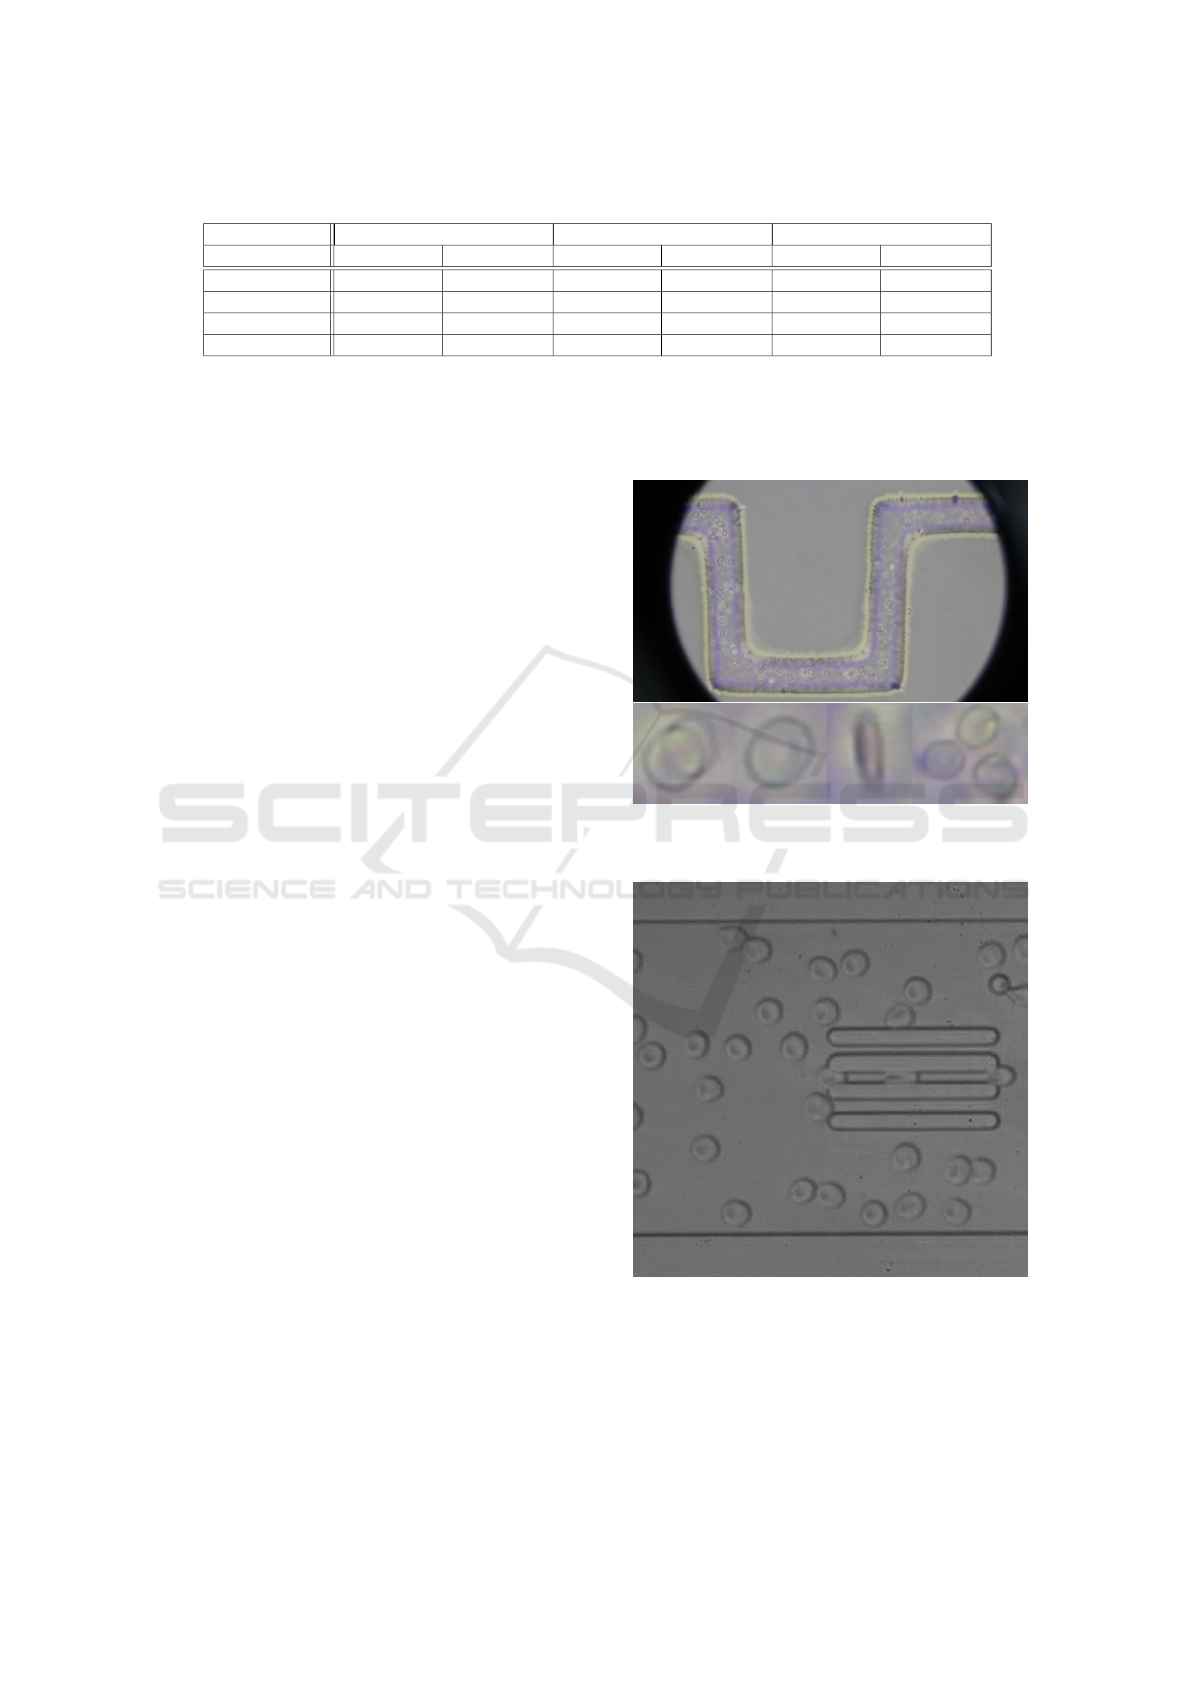
Table 1: CNN testing results.
200 frames 250 frames 250 and 50 frames
Precision/Recall First video Second Video First Video Second Video First Video Second Video
SSD 90.9%/66.3% 16.7%/11.0% 94.5%/68.0% 0.0%/0.0% 95.1%/68.7% 99.2%/93.3%
SSD - Adjusted - - - - 98.7%/88.0% 99.2%/95.1%
Faster R-CNN 99.6%/89.7% 0.0%/0.0% 99.3%/97.2% 1.4%/0.1% 99.5%/94.7% 98.7%/98.7%
R-FCN 99.2%/82.1% 2.7%/0.4% 99.6%/88.6% 10.0%/0.4% 82.5%/86.5% 95.5%/97.4%
First two columns ((Kaj
´
anek and Cimr
´
ak, 2019)) represent trained models on 200 frames of first video. Second two columns
represent trained models on 250 frames of our first video. Last 2 columns represent trained models on both videos with 250
and 50 frames respectively. The values in each column represent the Precision/Recall values of a given model. The models
were trained with 100 000 iterations each.
and 88.8% recall. Precision can be calculated as: true
positives/(true positives + false positives) and recall:
true positives/(true positives + false negatives). Com-
pared to common CNN performance, this is a partic-
ularly low recall.
For our previous evaluation, we used Intersection
over Union(IoU) of 0.5 and distance between dataset
sample and detected sample could be at most 0.3 *
width of dataset sample. After manual examination,
we noticed that some of our false positives with these
settings are within a margin of error and need to be
included in some form in the result metric. The issue
manifested as a cluster of cells being joined together
into one in our detection results, causing the analysis
algorithm to fail to pick up on them. This has lead
us to adjust our ”true positive” result bracket into 3
different values - IoU >0.5, 0.3 and 0.1 to provide
further information. We also adjusted our second pa-
rameter - center distance to also fall into 2 brackets
- 0.5 of the width of a dataset sample and 0.3. As a
result, more cells are evaluated as valid even if they
are not perfectly centered, and we also have more in-
formation about centering from our metric.
In addition to adjusting our evaluation, we also
added more annotations to our dataset. We now have
250 frames of our first video (Figure 2) and 50 frames
of our second video (Figure 3).
We would like to test the impact of additional data
of our first video, as well as the impact of our second
video on the end results. This is aimed towards ana-
lyzing how much data will be required when we are
presented with additional videos for data processing.
Due to adding more data we will also re-evaluate all
of our old experiments. Before we used 150 frames
for training, 50 frames for testing during the training
process and 50 frames for final evaluation. Now our
dataset is segmented into 200 training, 50 testing and
50 evaluation frames in the first video and 30 train-
ing, 20 testing and 50 evaluation frames in the second
video. We also want to take a look at the impact of
additional training time.
Next, we would like to reevaluate and fix our de-
Figure 2: First video in dataset and examples of cells in
video. Source: (Mazza., 2017).
Figure 3: Second video in dataset. Source: (et al., 2016).
tection problems encountered with the SSD detection
framework. This framework was designed for supe-
rior speed at the cost of using much smaller images
for detection. It uses an anchor system, which re-
stricts how many detections can be found in a single
BIOINFORMATICS 2020 - 11th International Conference on Bioinformatics Models, Methods and Algorithms
208

anchor. We want to adjust its anchor system so that it
provides representative results on our task.
Lastly, we wanted to evaluate the impact of back-
ground subtraction on the CNN performance. Our
Hough Transform solution benefited greatly from the
usage. We needed to craft a new background subtrac-
tion method as well, due to one of our videos hav-
ing a shift in camera direction. After reviewing ex-
isting thresholding methods used in common object
detection tasks, we found, that these methods do not
work well in our poor lighting conditions. As a result
we devised a simple temporal method with history of
10 frames. This method has some temporal artifacts,
but should work well on the task at hand. We will
also compare this new temporal method with the old
method, which created one background out of all the
images.
The testing workbench was comprised of Thread-
ripper 2950X and GTX 1080 Ti graphics card. The
training time for most of our models was around 12
hours, with some of our training taking up to 24h
each.
4 RESULTS
First we will look at the impact of additional trad-
ing data. The evaluation can be seen in Table 1. We
can see that across all neural networks we have a per-
formance uplift when comparing 200 frames vs 250
frames. While SSD still suffers from the same issues
with having a lower recall than R-FCN and Faster R-
CNN, we can still see an overall improvement. This
confirms our theory that our results were sub-par due
to lack of training data. The resulting precision and
recall are now sufficient for our tracking step.
Next, we wanted to evaluate the impact of our sec-
ond video. As we can see, the trained models which
were not trained on the second video provide very
poor results on this video, see column two and four
in Table 1. This means, that we need to introduce di-
versity to our dataset. By adding our second video
to the dataset and training with this data as well, we
achieved two goals. One, our results on the first video
stayed roughly the same in the case of Faster R-CNN
and SSD. For R-FCN however we can see a perfor-
mance regression. Going forward we need to closely
monitor R-FCN performance after adding more data.
We also tested a 200 frames and 50 frames config-
uration, which has also shown the same result, SSD
and Faster R-CNN staying roughly the same, and R-
FCN regressing even further. Second, we managed to
successfully detect cells in our second video, which
differed in many ways, and achieve even better re-
sults. The cells in the second video (Figure 3) are
more clearly visible and are bigger. As a side effect
of this, we can see that the SSD neural network pro-
vides respectable results on our second video. This
seems to imply that the anchor system is limiting its
performance on the first video due to the small cell
size vs. image size difference.
Table 2: Overtraining.
First Video
SSD 75.9%/59.4%
Faster R-CNN 92.9%/96.8%
R-FCN 95.4%/88.5%
250 frames trained with 200000 iterations
from first video - values represent Preci-
sion/Recall.
Next, we further trained our models with 200000
iterations, up from 100000. All 3 frameworks suf-
fer from overtraining and precision degradation. This
means, that our training is as good as it gets and will
only benefit from additional data and minor tweaking
using error rate during the testing step.
Figure 4: Example of false positives.
Before we go over our adjustments to the SSD
framework, we need to explain the impact of chang-
ing our metrics. First of all, our recall rose due to
us including 0.5 width distance difference bounding
boxes in the ”true positive” category. While these
suffer from worse localization, they are still valid de-
tections for our next step. This improved detection
across the board, but it improved recall of SSD on
our first video by 16%. This seems to imply, that be-
cause SSD works on much smaller images, this causes
some issues with pinpointing location. On the second
video, which has much smaller resolution, the differ-
ence was less than 0.5%. After tweaking the model
of SSD further, we achieved comparable results on
our first video. We achieved this through adjusting
anchor scaling of SSD model, as well as increasing
the working resolution of the model from 300px to
600px. This also fixed the localization issue of SSD
in the first video. It is to be noted however, that this
had an adverse effect on the speed of training of this
adjusted SSD model, causing it to train twice as slow.
Luckily this is not a concern for us.
Lastly, we looked at our background subtraction
evaluation. The goal here was to lessen the trans-
ferability of our models between videos with as lit-
Advancements in Red Blood Cell Detection using Convolutional Neural Networks
209

Table 3: Background Subtraction.
First Video Second Video
SSD 93.8%/66.7% 72.6%/98.4%
Faster R-CNN 99.3%/88.4% 5.5%/0.8%
250 frames trained from first video with background subtracted
from both - values represent Precision/Recall.
tle human intervention as possible. Here we illus-
trate Faster R-CNN and SSD (R-FCN behaved sim-
ilarly to Faster R-CNN) in Table 3. We can see that
in the case of SSD, background subtraction improved
transferability considerably at the cost of precision.
With additional data manipulation we can likely cre-
ate a model, which will be more robust towards light-
ing and color. Faster R-CNN on the other hand pro-
vided no noticable performance uplift and as a result
still needs training from the other video. When com-
paring our two background subtraction methods, tem-
poral and static image, both provided similar results.
Our first video has an accidental camera shift, and the
temporal method mitigated this issue after the frames
in mind going out of history.
Figure 5: Example of false negatives.
When analysing all of our results, specifically
false negatives (Figure 5), we came to a conclusion
that the CNN performance is starting to outperform
humans in certain cases. We took a closer look at
cells which caused a Precision downgrade and when
looking at multiple frames in a sequence, we noticed
that manual annotations for our dataset were missing
certain cells. After visualisation, this enabled us to
improve our dataset, further improving the results of
our trained CNNs.
As last verification, we performed 5-fold cross
validation on our test case of 250 images from first
video and 50 images from second video. The vari-
ance of Faster R-CNN precision was 99 % ± 1 % and
Recall 94 % ± 4 % with SSD and R-FCN giving very
similar results, with variance being within 1% of val-
ues from Faster R-CNN.
5 CONCLUSION
The presented results highlight the importance of pre-
processing and data acquiry for the performance of
CNNs. Their performance out of the box is already
very good, but with certain additions and alterations
they perform well enough to even challenge manual
human processing.
The detection step after careful evaluation is ro-
bust enough for us to use for data gathering. The next
step for evaluating this work is to use the output as
the input of a tracking algorithm to determine whether
the minor localisation issues are a problem for piecing
together tracks of cells. After evaluating the whole
pipeline, we will not only have concrete data for val-
idating simulation experiments, but we will also be
potentially able to improve detection further through
additional metrics.
ACKNOWLEDGEMENTS
This work was supported by the Slovak Research
and Development Agency (contract number APVV-
15-0751) and by the Ministry of Education, Science,
Research and Sport of the Slovak Republic (contract
number VEGA 1/0643/17).
REFERENCES
Calder, M. and et al. (2018). Computational modelling for
decision-making: where, why, what, who and how. R
Soc Open Sci, 5(6).
Cimr
´
ak, I., Gusenbauer, M., and Jan
ˇ
cigov
´
a, I. (2014).
An ESPResSo implementation of elastic objects im-
mersed in a fluid. Computer Physics Communications,
185(3):900 – 907.
Dai, J., Li, Y., He, K., and Sun, J. (2016). R-FCN: object de-
tection via region-based fully convolutional networks.
CoRR, abs/1605.06409.
Dao, M., Li, J., and Suresh, S. (2006). Molecularly based
analysis of deformation of spectrin network and hu-
man erythrocyte. Materials Science and Engineering
C, 26:1232–1244.
Donahue, J., Jia, Y., Vinyals, O., Hoffman, J., Zhang, N.,
Tzeng, E., and Darrell, T. (2013). Decaf: A deep con-
volutional activation feature for generic visual recog-
nition. CoRR, abs/1310.1531.
et al., C. T. (2016). An on-chip rbc deformability checker
significantly improves velocity-deformation correla-
tion. Micromachines,7,176.
Fedosov, D., Caswell, B., Popel, A., and Karniadakis, G.
(2010). Blood flow and cell-free layer in microvessels.
Microcirculation, 17:615–628.
Freund, Y. and Schapire, R. E. (1999). A short introduction
to boosting. In In Proceedings of the Sixteenth In-
ternational Joint Conference on Artificial Intelligence,
pages 1401–1406. Morgan Kaufmann.
Girshick, R. B., Donahue, J., Darrell, T., and Malik, J.
(2013). Rich feature hierarchies for accurate ob-
ject detection and semantic segmentation. CoRR,
abs/1311.2524.
BIOINFORMATICS 2020 - 11th International Conference on Bioinformatics Models, Methods and Algorithms
210

Illingworth, J. and Kittler, J. (1987). The adaptive hough
transform. IEEE Transactions on Pattern Analysis and
Machine Intelligence, PAMI-9(5):690–698.
Janacek, J., Kohani, M., Koniorczyk, M., and Marton, P.
(2017). Optimization of periodic crew schedules with
application of column generation method. Trans-
portation Research Part C: Emerging Technologies,
83:165 – 178.
Jan
ˇ
cigov
´
a, I. and Cimr
´
ak, I. (2015). A novel approach with
non-uniform force allocation for area preservation in
spring network models1). AIP Conference Proceed-
ings, 1648(1):–.
Kaj
´
anek, F. and Cimr
´
ak, I. (2019). Evaluation of detec-
tion of red blood cells using convolutional neural net-
works. In 2019 International Conference on Informa-
tion and Digital Technologies (IDT), pages 198–202.
Kleineberg, K.-K., Buzna, L., Papadopoulos, F., Bogu
˜
n
´
a,
M., and Serrano, M. A. (2017). Geometric correla-
tions mitigate the extreme vulnerability of multiplex
networks against targeted attacks. Phys. Rev. Lett.,
118:218301.
Krizhevsky, A., Sutskever, I., and Hinton, G. E. (2017). Im-
agenet classification with deep convolutional neural
networks. Commun. ACM, 60(6):84–90.
Liu, W., Anguelov, D., Erhan, D., Szegedy, C., Reed, S. E.,
Fu, C., and Berg, A. C. (2015). SSD: single shot multi-
box detector. CoRR, abs/1512.02325.
Mazza., G. (2017). in-house experiments for biological re-
search.
Ren, S., He, K., Girshick, R. B., and Sun, J. (2015). Faster
R-CNN: towards real-time object detection with re-
gion proposal networks. CoRR, abs/1506.01497.
Viola, P. and Jones, M. (2001). Robust real-time object de-
tection. International Journal of Computer Vision.
Yuen, H. K., Illingworth, J., and Kittler, J. (1988). Ellipse
detection using the hough transform. In Proc. AVC,
pages 41.1–41.8. doi:10.5244/C.2.41.
Advancements in Red Blood Cell Detection using Convolutional Neural Networks
211
