
Interactive System Architecture Exploration: Case Studies with the
IMiGEr Tool
Premek Brada
1
, Richard Lipka
1
, Lukas Holy
1
and Kamil Jezek
2
1
NTIS - New Technologies for the Information Society, Faculty of Applied Sciences, University of West Bohemia,
Univerzitni 8, 306 14 Pilsen, Czech Republic
2
The University of Sydney, City Road, Camperdown/Darlington, NSW 2006, Sydney, Australia
Keywords:
Large Graph Visualization, Architecture Exploration, Dependency Analysis.
Abstract:
Software systems of all kinds tend to be complex, easily comprising hundreds of components of various types
and many more interconnections. Understanding of their internal structure through appropriate visualiza-
tion is, therefore, a challenging task, especially when hierarchical decomposition is not possible. Among the
key hindrances in existing graph-based visualizations of such systems are visual clutter and the contradictory
requirements of ideally seeing the whole system context while showing enough details to analyze particular el-
ements. Addressing such issues to enable effective comprehension of large multi-modal graphs, we developed
a method of their exploration leaning on user interaction with the diagram and details on demand principle,
implemented in IMiGEr. In this paper, we show the key techniques it employs, explain their combination and
illustrate the benefits on the representative tasks in software architecture understanding.
1 INTRODUCTION
The static structure of software systems, in terms of
their constituent components and connectors, is an
important part of the system architecture. These sys-
tems tend to be complex, easily comprising hundreds
of components of various types and many more inter-
connections. Understanding the (static) architecture
means creating its mental map, in which the compo-
nent relationships, as well as their placement on a can-
vas (the layout), play important roles.
To create such a mental map, the architect needs
to repeatedly quickly find the desired information and
detect patterns in component diagrams which are es-
sentially graphs containing dozens to hundreds of el-
ements (nodes). Several issues make this a chal-
lenging task; cf. (Caserta and Zendra, 2010). First,
such a graph displayed on one canvas necessarily
exhibits a heavy visual clutter (Rosenholtz et al.,
2007) which, unless reduced, complicates graph un-
derstanding. Second, it leads to the contradictory
situations of either seeing the context (whole graph)
but no useful detail or showing enough detail to
analyze particular nodes (small sub-graph) without
context. Finally, in many domains including soft-
ware architecture, there are multiple types of both
nodes (e.g. library, executable, configuration file) and
edges (e.g. dependency, containment), and such mul-
timodal graphs further add complexity to the visu-
alized information. To combat the resulting infor-
mation overload, the architect needs effective tools
(Chaudron et al., 2012) providing architecture anal-
ysis and exploration techniques (Arleo et al., 2018;
van den Elzen and van Wijk, 2014). Focusing on fac-
tors enabling effective comprehension of multi-modal
graphs, we developed a method of their interactive ex-
ploration aiming to be better suited than e.g. UML for
uncovering component clusters and tracing dependen-
cies in complex graphs (Holy et al., 2015). In this pa-
per, we show its key aspects as implemented in the
IMiGEr tool, applied on representative tasks in soft-
ware architecture understanding.
2 BACKGROUND AND RELATED
WORK
Visual clutter can be reduced by many techniques,
such as bundling (Holten and Van Wijk, 2009), sam-
pling (Rafiei, 2005), clustering (Chen and Liu, 2003)
etc. The whole taxonomy of these techniques has
been described by many surveys, such as (Beck et al.,
2017), (Vehlow et al., 2017), (von Landesberger et al.,
288
Brada, P., Lipka, R., Holy, L. and Jezek, K.
Interactive System Architecture Exploration: Case Studies with the IMiGEr Tool.
DOI: 10.5220/0009164002880293
In Proceedings of the 15th International Joint Conference on Computer Vision, Imaging and Computer Graphics Theory and Applications (VISIGRAPP 2020) - Volume 3: IVAPP, pages
288-293
ISBN: 978-989-758-402-2; ISSN: 2184-4321
Copyright
c
2022 by SCITEPRESS – Science and Technology Publications, Lda. All rights reserved
2011), (Ellis and Dix, 2007). A short description of
those techniques related to our work is provided.
The clutter caused by the lines is often reduced
by edge bundling (Holten, 2006). Although this ap-
proach reduces the clutter, it makes it difficult to trace
the dependencies between connected nodes leading
through the edge bundles. Some of the edge aspects
could be analyzed by showing dependencies as bipar-
tite graphs (Abuthawabeh et al., 2013).
The visual clutter can be also lowered by using
node clustering, where one cluster usually represents
multiple nodes. Thus the number of nodes in the
whole diagram is lowered, though the connections
among components are usually still present. Clusters
can either be marked manually, in an automated way
(Chiricota et al., 2003), (Mancoridis et al., 1998) or
by a combination of those approaches (McGee and
Dingliana, 2012). There is also quite large group of
visualizations showing the node clusters as geograph-
ical blocks (Pinzger et al., 2008), (Wettel et al., 2011).
Another influencing factor is the chosen layout al-
gorithm, which can ease orientation in both clustered
graphs (Feng, 1997) and non-clustered ones (Hachul
and J
¨
unger, 2007).
Existing tools related to this domain were de-
scribed in our previous paper (Holy et al., 2012).
One of the related tools is SoftVision. It is a soft-
ware visualization framework described in (Telea and
Voinea, 2004) which is able to interactively explore
relations between data structures. It is a desktop ap-
plication that offers a generic interface for describing
a particular parser.
3 THE IMiGEr TOOL OVERVIEW
The approach we apply to address the issues dis-
cussed above uses interactivity and the “details on
demand” principle in combination with information
hiding (Holt, 2001). It is embodied in the implemen-
tation of the IMiGEr tool, which has a Java-based
server backend for managing data and storing user
sessions and a JavaScript front-end application (run-
ning in a web browser and developed using custom UI
implementation) which visualizes the graph and han-
dles user interaction. JSON structures with the simple
custom format are used for input and to transfer data
between the application and the backend. The tool
source code and additional materials are available at
online
1
as an open-source.
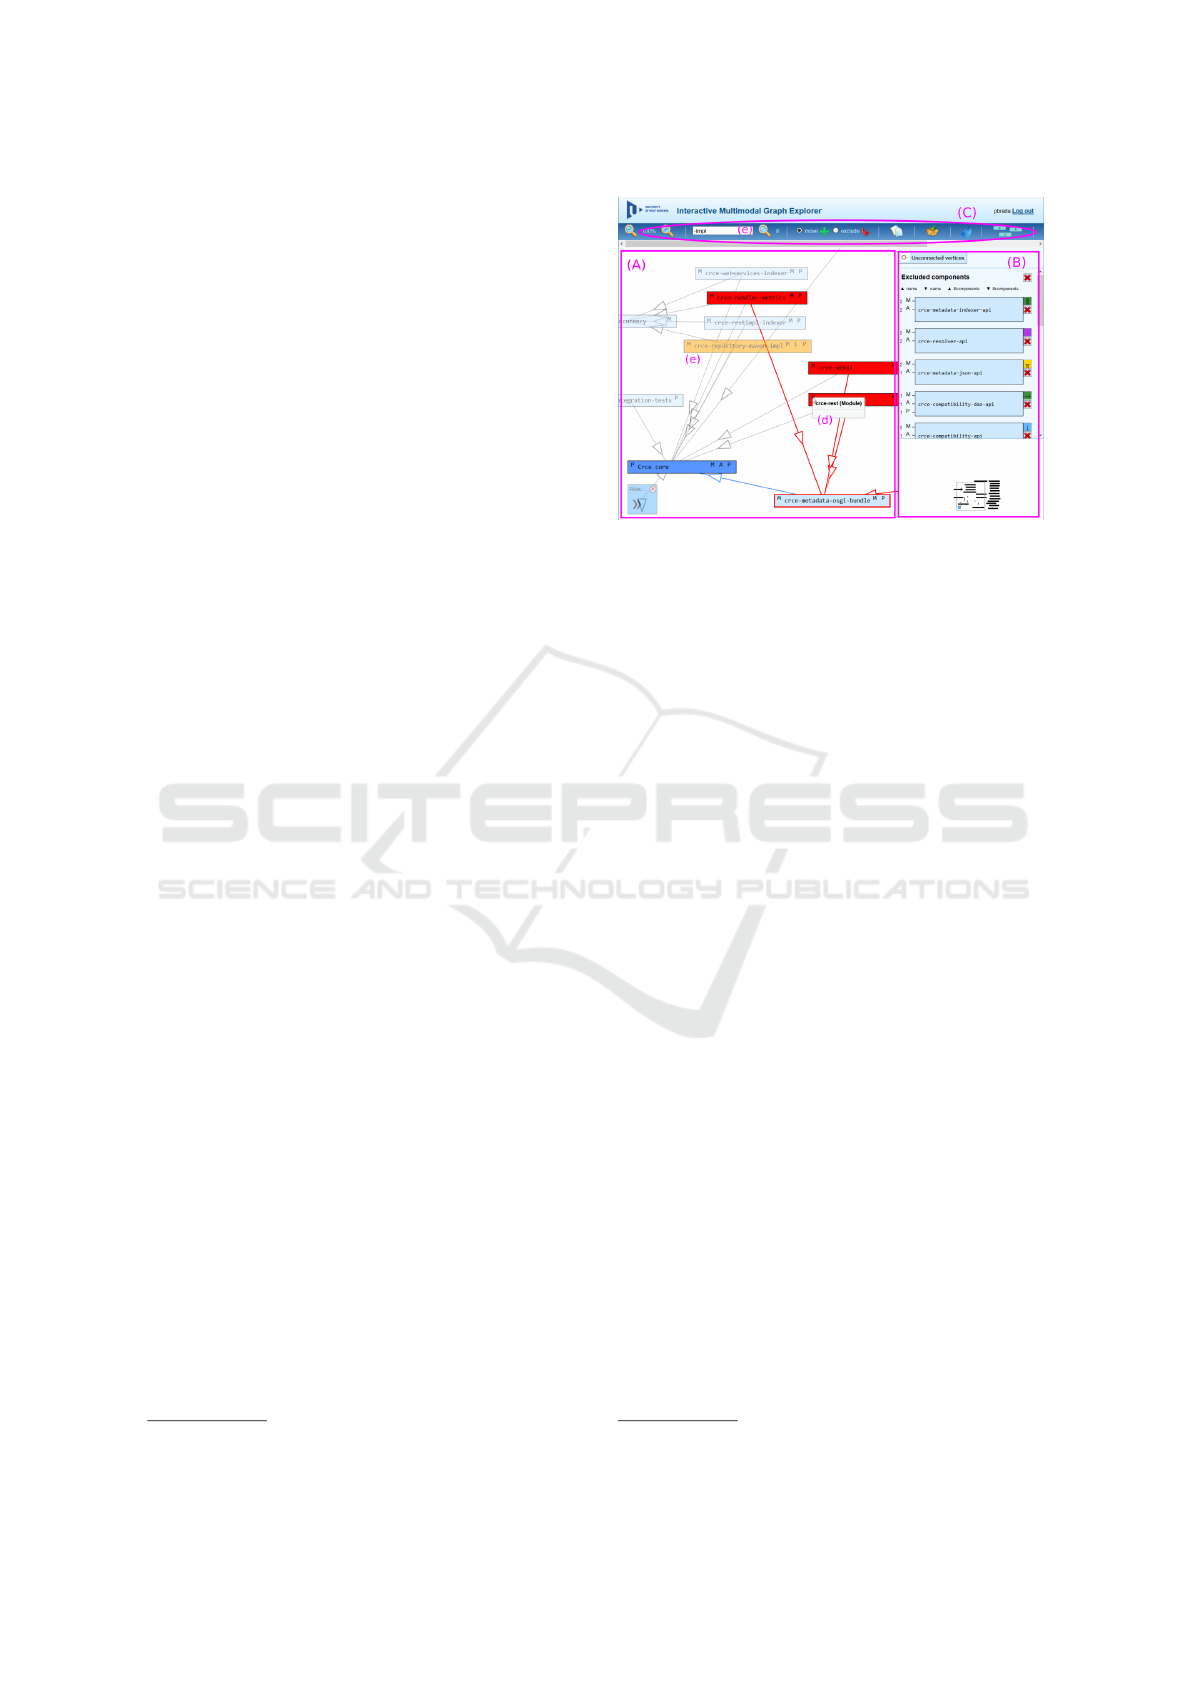
The user interface of IMiGEr features an interac-
tive graph area (canvas, ‘A’ in Figure 1) and a sidebar
1
https://github.com/ReliSA/IMiGEr
Figure 1: The basic design and features of IMiGEr.
’B’, complemented by a toolbar ’C’. The canvas dis-
plays the node-edge graph, the sidebar contains a list
of nodes picked by the user (excluded from the graph)
plus a birds-eye view. The toolbar is used to invoke
actions like loading new data, storing user’s session
or initiating layout change.
For nodes, only their names and types are shown.
Edges display only their direction. Details like arti-
fact attributes or edge type are provided on demand by
hovering over or clicking on a symbol within the in-
dividual element (cf. the pop-up ‘d’). For nodes with
relations to others, the types of relation is shown as
well (cf. the letters in upper-right of the rectangles).
As a key part of IMiGEr interactivity features, the
selection of an element (node or edge) highlights not
only the element itself but the connected nodes are
highlighted as well. The rest of the nodes are sup-
pressed using transparency. The blue colour is used
for outgoing connections of a node, red colour for in-
coming ones (in the figure, the bottom-right compo-
nent has been selected). Colour coding is also used to
visually highlight search results, cf. labels ’e’.
3.1 Clutter Reduction
IMiGEr uses several interactive and visual features
to reduce the excessive information shown to the
user. The initially loaded graph usually contains many
nodes and connections. These create a visual clutter
as there is such a high density of the lines that the
user is unable to track the dependencies. An exam-
ple of edge visual clutter is illustrated in Figure 2,
which shows part of component dependencies among
202 components of Nuxeo system
2
.
One of the solutions for the visual clutter reduc-
tion is removing “suitable” nodes and connections
2
https://www.nuxeo.com
Interactive System Architecture Exploration: Case Studies with the IMiGEr Tool
289
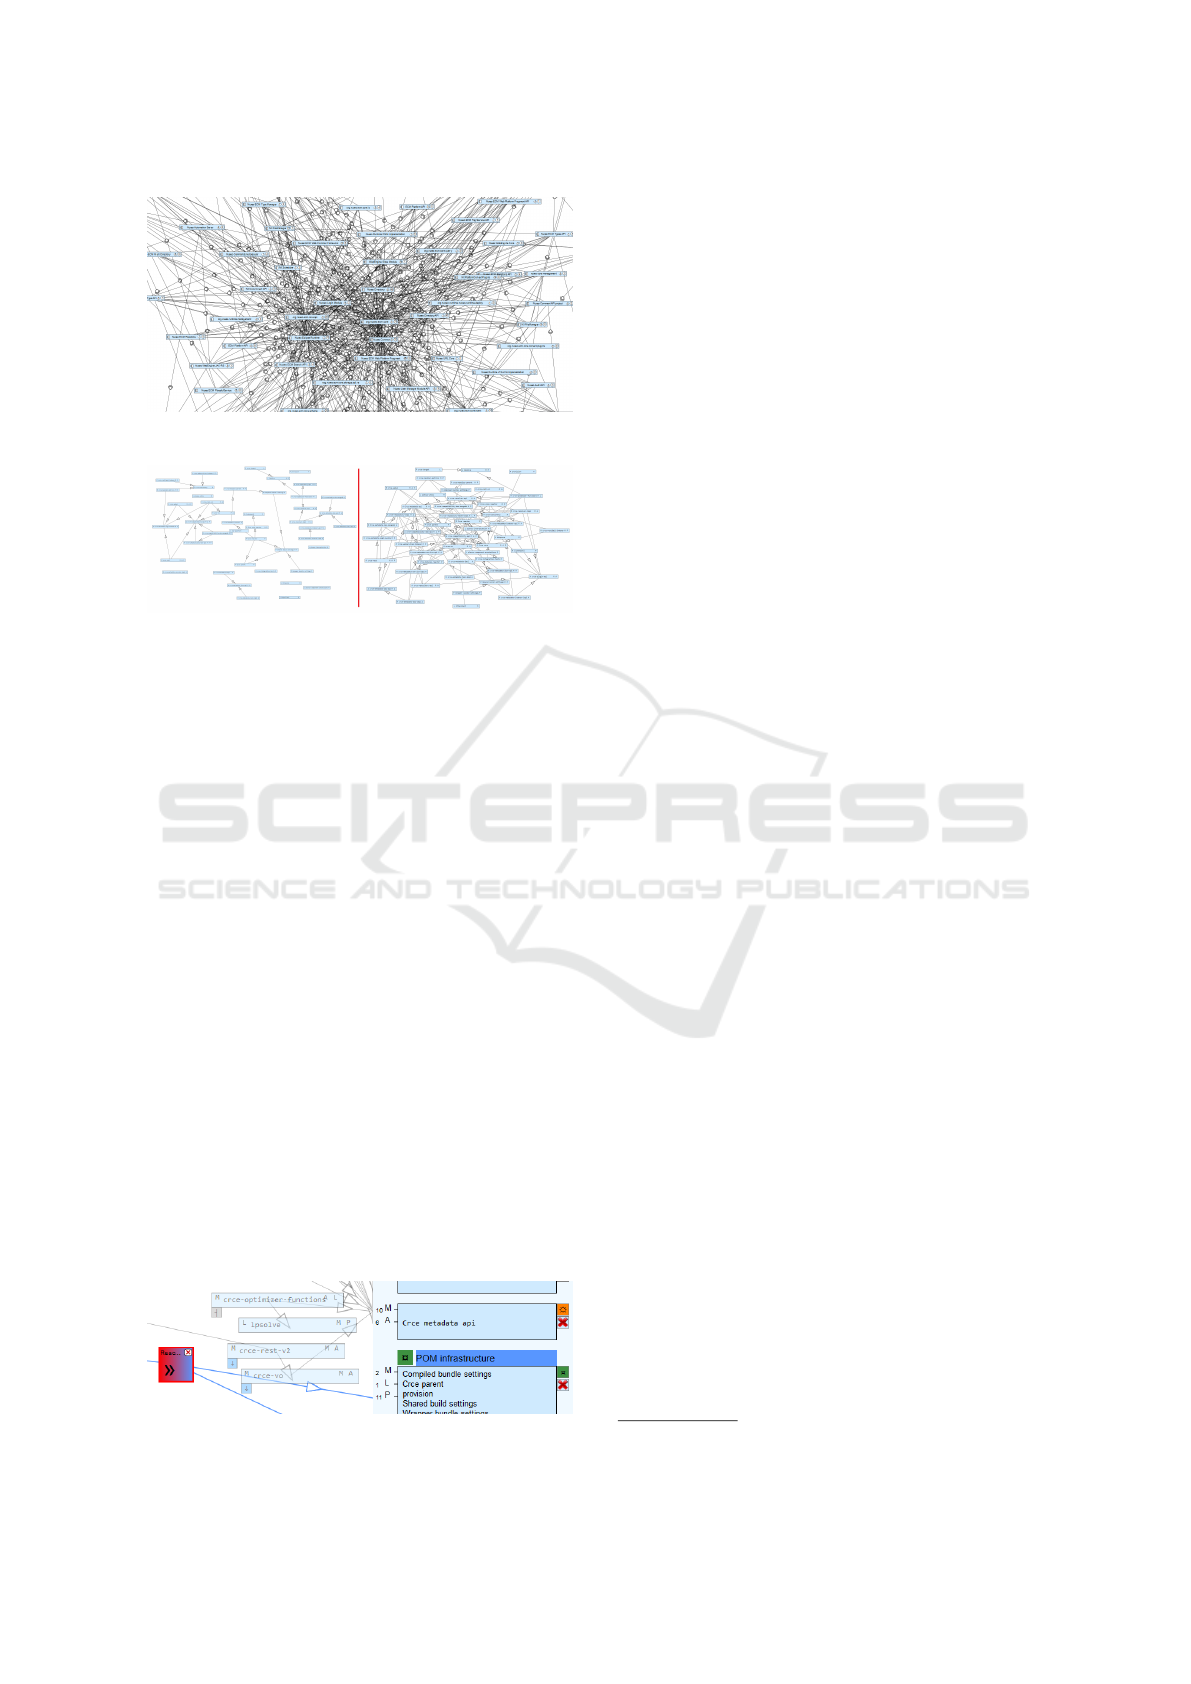
Figure 2: Edge Visual Clutter Demonstration.
Figure 3: Visual Clutter Reduction Comparison.
from the graphs. This is activated via the “Exclude”
toolbar radio button, which causes a clicked node to
be moved from the canvas to the sidebar. The most
connected graph components are the best candidates
for the removal as their removal will also eliminate
many lines from the graph area. Removal of uncon-
nected components from the graph may also reduce
visual clutter initially.
However, if the removed nodes completely disap-
pear from the user’s perception it may lead to prob-
lems because nodes are needed for mental map cre-
ation. Therefore, IMiGEr features the sidebar which
is showing the nodes excluded (removed) from the
graph, essentially marking them as “familiar ones”.
For such nodes, there are no edges shown in the
graph area by default, but they can be shown on de-
mand to enable tracking their connections. The grey
edges leading to the Crce metadata api component
in Figure 4 sidebar area is an example of the amount
of edge clutter eliminated by excluding this compo-
nent only. In Figure 3, we can see the visual clutter
reduction (diagram on the left side) after removing the
7 most connected nodes from the much denser dia-
gram on the right side to the sidebar.
Another option introduced in the IMiGEr is to use
so called proxy symbols instead of the edges. These
Figure 4: Excluded nodes, Proxy symbols and Groups.
symbols form easily recognizable keys which indicate
connection between a node in the side area and a node
in the graph area – cf. the symbols right of the ex-
cluded components and those attached bottom-left to
the canvas nodes in Figure 4.
To further reduce the visual clutter and simplify
the graph by introducing abstractions, the concept
of groups is used. These are created in the sidebar,
representing multiple nodes by one element (cf. POM
infrastructure in Figure 4). The user adds a node
to a group by right-clicking the node, selecting the
target group by name or proxy symbol. Each group
can also be shown back in the graph area as one node,
cf. the left-most node in Figure 4, with the edges inci-
dent with all group’s nodes leading to/from the group
node.
4 INTERACTIVE
ARCHITECTURE
EXPLORATION WITH IMiGEr
While IMiGEr is designed to work with multimodal
graphs in general, it is well suited for exploring and
understanding specifically software architecture dia-
grams of larger and/or more complex systems. In this
section, we present its use on several tasks occurring
in this context.
For the case study, we use a diagram of the static
architecture of CRCE, a modular repository tool in-
tended to work with meta-data of software compo-
nents and services
3
. It comprises 50 components
of three types: “Module” implementing logic in Java
with OSGi framework use, “API” providing Java in-
terface definitions and “POM” containing only Maven
files. The diagram of CRCE in IMiGEr – with the
right-hand part of Figure 3 showing its slightly edited
default layout for newly loaded data – is isomorphic
to its UML component diagram which was obtained
by analysing the components and their Maven depen-
dencies in a recent CRCE build. The graph data for
IMiGEr visualization were created by a transforma-
tion of the UML model’s XMI representation.
The exploration examples below loosely follow
a scenario in which a software architect is given an
architecture diagram lacking any “reasonable” lay-
out and grouping, e.g. as when analyzing reverse-
engineered information of a poorly documented sys-
tem. The overall goal is to understand the system
structure and create a diagram which would reflect
this understanding, for future documentation.
3
https://github.com/ReliSA/CRCE
IVAPP 2020 - 11th International Conference on Information Visualization Theory and Applications
290
4.1 Basic Tasks
Exploring architectural diagrams entails some rela-
tively simple tasks which are repeated many times in
the process.
(A1) A common need in a “messy” diagram is
to disentangle the dependencies. For this, itera-
tively seeking a component’s collaborators (clients
and providers) can be combined with relocating them,
e.g. closer together if they belong to a common sub-
system. Therefore, seeing a component’s collabora-
tors and being able to move them around while the
component is still in focus is desirable.
In IMiGEr, clicking on the component selects it,
and the selection persists throughout panning, zoom
and node move operations. Even if some collabora-
tor(s) are far away from current viewport, using these
operations while the selection is active helps locate
(and re-locate, if needed) the collaborators.
(A2) The need to discover components of a certain
kind is behind questions like “Are there any API com-
ponents in CRCE?”. In many cases, names of compo-
nents provide good hints in this regard. Search func-
tionality, a common feature of most tools, can then
help. In IMiGEr additionally, the node types can pro-
vide additional guidance.
We provide search results’ visual presentation in
the diagram itself, in the form of highlight colour
which persists as long as the search string is un-
changed (see Figure 5 with results of search for
“api”). The highlighted components can again be
moved around or subject to other operations. In the
example, the user further interacted with the right-
most component to show its collaborators of the
“API” type.
Figure 5: Working with Search Results in the Diagram.
(A3) The ability to hide unwanted components
from view addresses the need to simplify the diagram
for its better clarity, augmenting the component re-
location and layout change features. Prime examples
are components with high fan-in/fan-out, e.g. libraries
or front controllers, with a large number of relation-
ships. These relationships make it difficult to place
such components in the diagram without introduc-
ing the clutter of relationship lines (intersecting other
components or edges) or, when using edge routing
to avoid the intersections, complicating dependency
tracking.
Figure 6: Excluding Known Components to the Sidebar.
In IMiGEr, the ability to exclude such components
to the sidebar cleans up the diagram (sometimes sub-
stantially) while still keeping them visible to the ar-
chitect. In the CRCE case, the API components are
heavily referenced by other ones, and the result of ex-
cluding them is illustrated by Figure 6 – it shows ex-
actly the same diagram part as the previous figure, in-
cluding the tracking of API-type collaborators of the
selected component, but with the API components ex-
cluded.
Hiding components while indicating their pres-
ence is also supported by group manipulation as
shown on Figure 4 above. This provides a mecha-
nism for creating abstractions for sets of components
related by whatever suitable criterion.
4.2 Patterns and Queries
Understanding system architecture leads to more in-
volved analytical queries as well as pattern detection
tasks. Here we sample the role of IMiGEr visualiza-
tion in three such scenarios.
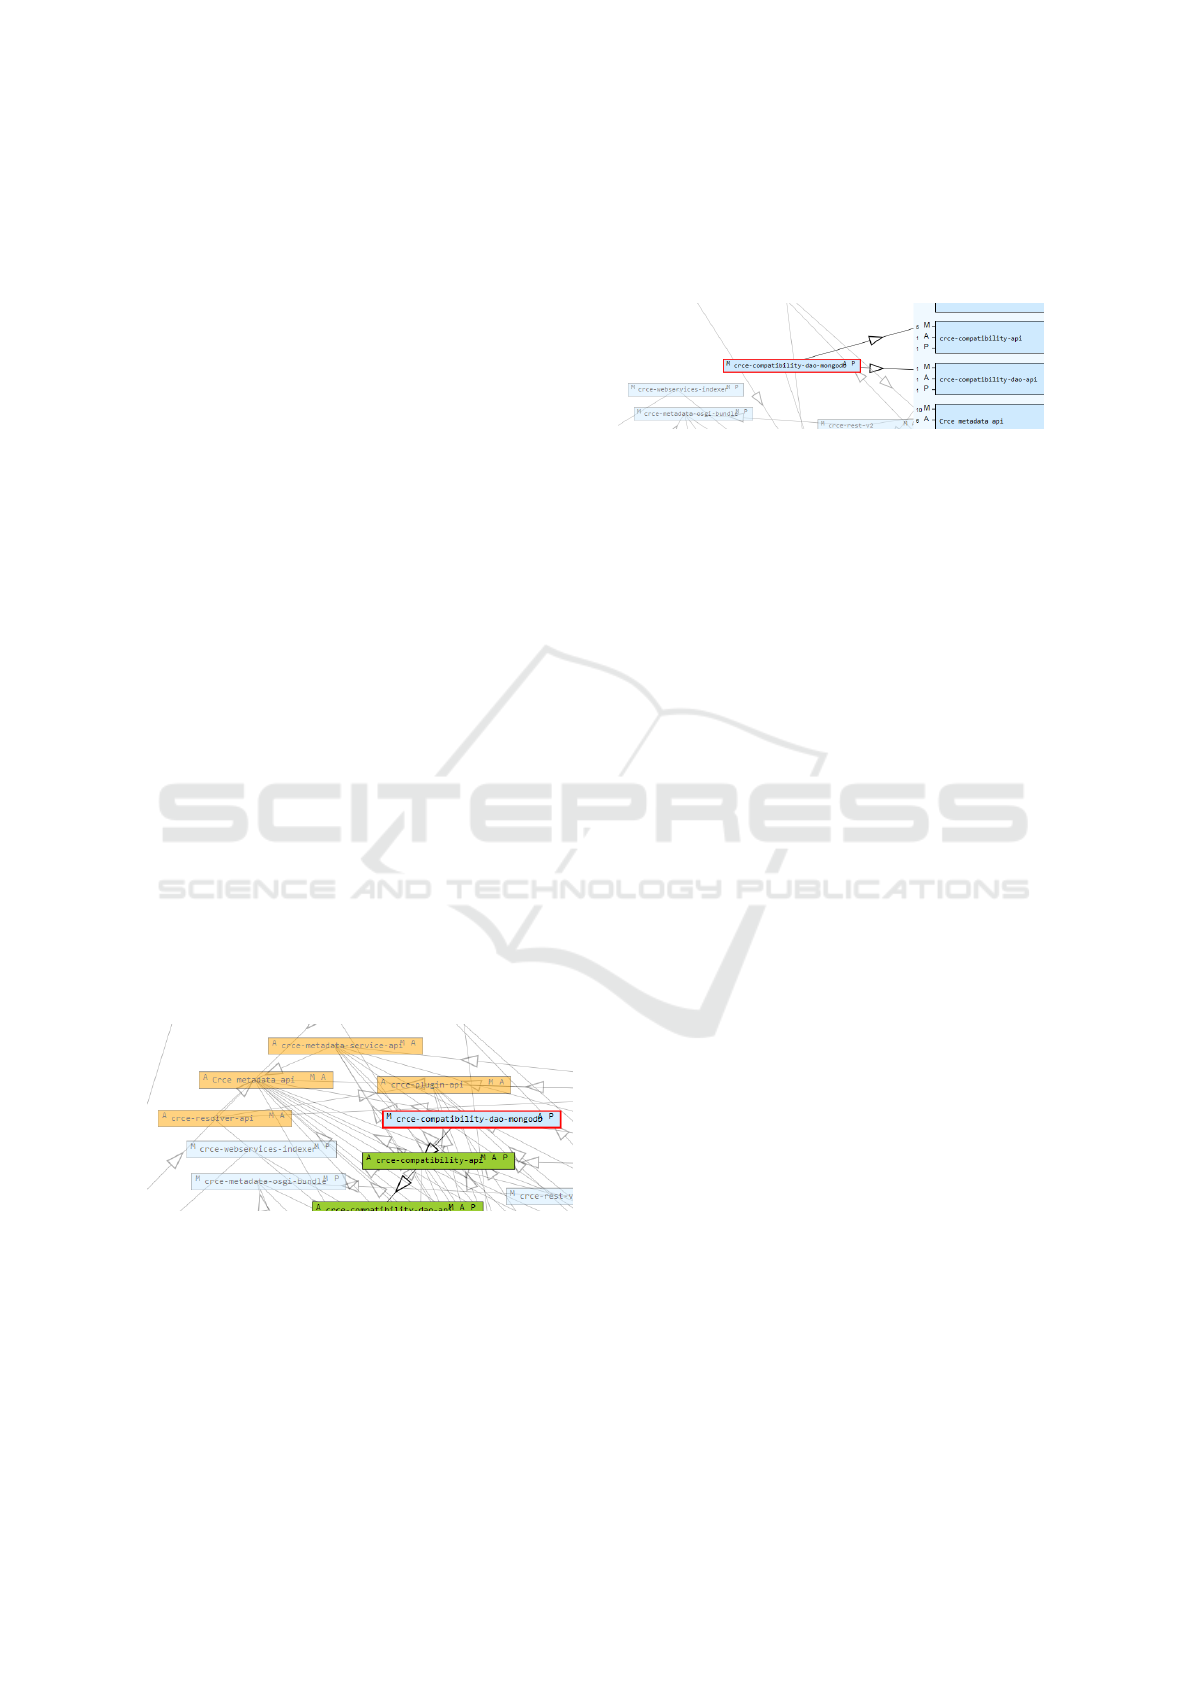
(B1) Finding API Providers. The APIs have been
separated, but which components use them? Can
we discriminate the users either as implementation
providers or as clients? The first question is easy to
answer: selecting (clicking) an API component in the
sidebar highlights its relationships, and the incoming
dependencies trace to the using components. The sec-
ond question is harder, and only the component names
(e.g. via search) can be used to get some hints; to get
a precise answer requires analysis of the component
implementations.
By tracing dependencies with IMiGEr, the API
users can be found and put together. Then the
proxy symbol for a chosen API component, e.g. the
metadata-service-api, in combination with the
highlight for “impl” search match, hints on the poten-
tial API implementors as opposed to clients – com-
pare the two components at the bottom of Figure 7.
Interactive System Architecture Exploration: Case Studies with the IMiGEr Tool
291
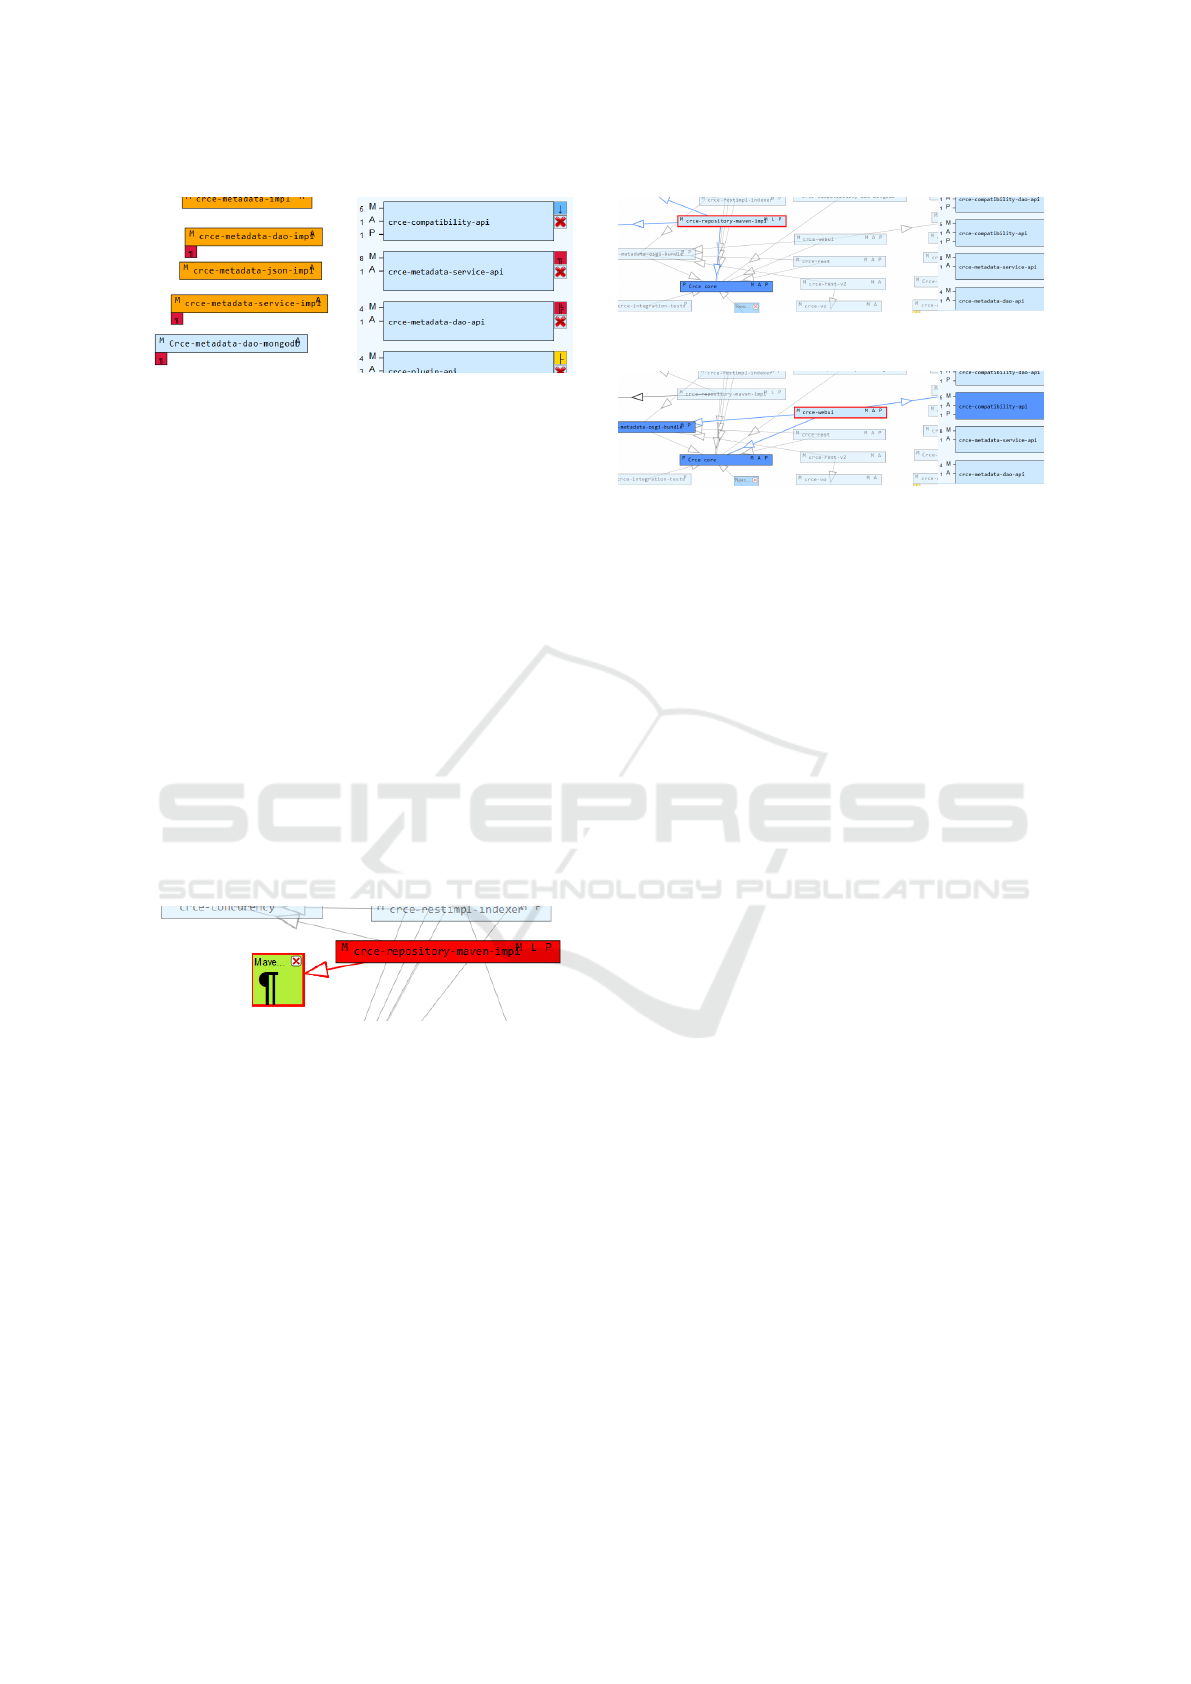
Figure 7: Hinting on implementors of a given API.
(B2) Separating Helper Libraries. System archi-
tecture often contains highly cohesive clusters of
components that are closely related together, with lit-
tle coupling to the rest of the system. While exploring
the CRCE diagram, the architect, for example, dis-
covers – thanks to dependency highlighting (task A1)
– that the repository component for Maven repository
access crce-repository-maven-impl is linked to
an unusually high number of other (non-API) com-
ponents. The question is whether these components
form a cohesive local cluster, an anomalous structure,
or are a part of some kind of a shared layer in the sys-
tem?
Dependency highlighting is used in the first place
to visualize and layout the linked components around
the center component. Secondly, the component types
displayed in the component rectangles indicate that
many of the components are in fact plain libraries
rather than domain components, not corresponding to
the “anomalous structure” hypothesis.
Figure 8: Use of groups for finding local clusters.
To efficiently answer the question of a shared
layer, the architect abstracts the libraries into a group,
with the side benefit of increased diagram clarity.
When the group element is placed in the diagram area
and selected as in Figure 8, the single relationship
of the group clearly shows that the grouped libraries
are indeed local to the center component only; thus
they are not part of a shared layer but rather form a
local cluster in the tool implementation. The group
representation therefore efficiently reduces diagram
complexity while retaining the key information on the
component-library dependencies.
(B3) Detecting Patterns in the Architecture.
Components and parts of the architecture are some-
times difficult to classify into a particular layer, sub-
Figure 9: Pattern Detection: Plugin components.
Figure 10: Pattern Detection: Core components.
system or other higher-level structure. This is com-
mon in the “big ball of mud” architectures but can
occur even in systems conforming to an architectural
style, hinting at potential architectural erosion.
In the case of CRCE, there are several compo-
nents for which it is unclear whether they are part of
the core of the system or rather represent a “plugin”.
The combination of IMiGEr features, in particular de-
pendency highlighting and sidebar, helps uncover pat-
terns which clarify the component purpose and clas-
sification in such cases.
In Figures 9 and 10, two components are inves-
tigated in an example case. The top image shows
a pattern recurring for cases when a component is a
plugin – it depends on the “core” and local non-API
components only. The pattern in the bottom image on
the other hand is typical for components which were
eventually classified as “to be moved into the core” –
these have both the core and API components among
their dependencies.
5 CONCLUSIONS
The IMiGEr tool presented in this paper implements a
combination of several techniques of interactive graph
data visualization, including non-standard ones like
node exclusion to sidebar with the possibility to rep-
resent them in main diagram by proxy symbols. Fo-
cused on effective exploration of large graphs, it is
designed to make the task of creating a mental map of
a system easier for a software architect. It can be con-
trasted to many advanced UML tools, in which even
the relatively straightforward task of tracking compo-
nent dependencies requires a lot of steps and often re-
sults in losing the original context of the exploration.
The future work with IMiGEr includes both tech-
nical and research goals. We would like to enhance
the tool by implementing the concept of “viewports”
IVAPP 2020 - 11th International Conference on Information Visualization Theory and Applications
292

(zooming into a group within the diagram) and im-
proving its performance. We also want to evaluate the
benefits of the approaches implemented in IMiGEr by
controlled studies of exploring software architectures
and other complex graph structures.
ACKNOWLEDGEMENTS
This research was partially supported by Ministry of
Education, Youth and Sports of the Czech Republic
project PUNTIS (LO1506) under the program NPU I.
REFERENCES
Abuthawabeh, A., Beck, F., Zeckzer, D., and Diehl, S.
(2013). Finding structures in multi-type code cou-
plings with node-link and matrix visualizations. In
2013 First IEEE Working Conference on Software Vi-
sualization (VISSOFT), pages 1–10.
Arleo, A., Didimo, W., Liotta, G., and Montecchiani,
F. (2018). GiViP: A visual profiler for distributed
graph processing systems. In Lecture Notes in Com-
puter Science, volume 10692 LNCS, pages 256–271.
Springer, Cham.
Beck, F., Burch, M., Diehl, S., and Weiskopf, D. (2017). A
taxonomy and survey of dynamic graph visualization.
Comput. Graph. Forum, 36(1):133–159.
Caserta, P. and Zendra, O. (2010). Visualization of the
Static Aspects of Software: A Survey. IEEE trans-
actions on visualization and computer graphics, 17.
Chaudron, M. R. V., Heijstek, W., and Nugroho, A. (2012).
How effective is UML modeling? Software & Systems
Modeling, 11(4):571–580.
Chen, K. and Liu, L. (2003). A visual framework invites
human into the clustering process. In Scientific and
Statistical Database Management, 2003. 15th Inter-
national Conference on, pages 97 – 106.
Chiricota, Y., Jourdan, F., and Melanc¸on, G. (2003). Soft-
ware components capture using graph clustering. In
Proceedings of the 11th IEEE International Workshop
on Program Comprehension, IWPC ’03, pages 217–.
IEEE Computer Society.
Ellis, G. and Dix, A. (2007). A taxonomy of clutter
reduction for information visualisation. Visualiza-
tion and Computer Graphics, IEEE Transactions on,
13(6):1216 –1223.
Feng, Q. (1997). Algorithms for drawing clustered graphs.
Hachul, S. and J
¨
unger, M. (2007). Large-graph lay-
out algorithms at work: An experimental study.
http://jgaa.info/ vol. 11, no. 2, pp. 345-369.
Holt, R. (2001). Software Architecture as a Shared Mental
Model. ASERC Workshop on Software Architecture,
University of Alberta.
Holten, D. (2006). Hierarchical edge bundles: Visualiza-
tion of adjacency relations in hierarchical data. IEEE
Transactions on Visualization and Computer Graph-
ics, 12(5):741–748.
Holten, D. and Van Wijk, J. J. (2009). Force-directed edge
bundling for graph visualization. Computer Graphics
Forum, 28(3):983–990.
Holy, L., Maly, I., Cmolik, L., Jezek, K., and Brada, P.
(2015). An interactive UML-like visualization for
large software diagrams. Research Journal of Applied
Sciences, Engineering and Technology, 11:355–371.
Holy, L., Snajberk, J., and Brada, P. (2012). Evaluat-
ing component architecture visualization tools - cri-
teria and case study. In GRAPP & IVAPP 2012:
Proceedings of the International Conference on Com-
puter Graphics Theory and Applications and Interna-
tional Conference on Information Visualization The-
ory and Applications, Rome, Italy, 24-26 February,
2012, pages 737–742.
Mancoridis, S., Mitchell, B. S., and Rorres, C. (1998). Us-
ing automatic clustering to produce high-level system
organizations of source code. In In Proc. 6th Intl.
Workshop on Program Comprehension, pages 45–53.
McGee, F. and Dingliana, J. (2012). Visualising small world
graphs - agglomerative clustering of small world
graphs around nodes of interest. In GRAPP & IVAPP
2012: Proceedings of the International Conference on
Computer Graphics Theory and Applications and In-
ternational Conference on Information Visualization
Theory and Applications, Rome, Italy, 24-26 Febru-
ary, 2012, pages 678–689.
Pinzger, M., Graefenhain, K., Knab, P., and Gall, H. C.
(2008). A tool for visual understanding of source code
dependencies. In 2008 16th IEEE International Con-
ference on Program Comprehension, pages 254–259.
Rafiei, D. (2005). Effectively visualizing large networks
through sampling. In Visualization, 2005. VIS 05.
IEEE, pages 375 – 382.
Rosenholtz, R., Li, Y., and Nakano, L. (2007). Measuring
visual clutter. Journal of Vision, 7(2).
Telea, A. and Voinea, L. (2004). A framework for inter-
active visualization of component-based software. In
Proceedings of the 30th EUROMICRO Conference,
pages 567–574, Washington, DC, USA. IEEE Com-
puter Society.
van den Elzen, S. and van Wijk, J. J. (2014). Multivariate
Network Exploration and Presentation: From Detail
to Overview via Selections and Aggregations. IEEE
Transactions on Visualization and Computer Graph-
ics, 20(12):2310–2319.
Vehlow, C., Beck, F., and Weiskopf, D. (2017). Visualizing
group structures in graphs: A survey. Comput. Graph.
Forum, 36(6):201–225.
von Landesberger, T., Kuijper, A., Schreck, T., Kohlham-
mer, J., van Wijk, J. J., Fekete, J., and Fellner, D. W.
(2011). Visual analysis of large graphs: State-of-the-
art and future research challenges. Comput. Graph.
Forum, 30(6):1719–1749.
Wettel, R., Lanza, M., and Robbes, R. (2011). Software
systems as cities: a controlled experiment. In Pro-
ceedings of the 33rd International Conference on Soft-
ware Engineering, ICSE 2011, Waikiki, Honolulu , HI,
USA, May 21-28, 2011, pages 551–560.
Interactive System Architecture Exploration: Case Studies with the IMiGEr Tool
293
