
Classification of Histopathological Images using Scale-Invariant Feature
Transform
Andrzej Bukała
2
, Bogusław Cyganek
1,2
, Michał Koziarski
1,2
, Bogdan Kwolek
1,2
,
Bogusław Olborski
1
, Zbigniew Antosz
1
, Jakub Swad
´
zba
1,3
and Piotr Sitkowski
1
1
Diagnostyka Consilio Sp. z o.o., Ul. Kosynier
´
ow Gdy
´
nskich 61a, 93-357 Ł
´
od
´
z, Poland
2
Department of Electronics, AGH University of Science and Technology, Al. Mickiewicza 30, 30-059 Krak
´
ow, Poland
3
Department of Laboratory Medicine, Andrzej Frycz Modrzewski Krakow University,
Gustawa Herlinga-Grudzi
´
nskiego 1, 30-705 Krak
´
ow, Poland
Keywords:
SIFT, Classification, Histopathology, Computer Vision, Machine Learning.
Abstract:
Throughout the years, Scale-Invariant Feature Transform (SIFT) was a widely adopted method in the image
matching and classification tasks. However, due to the recent advances in convolutional neural networks, the
popularity of SIFT and other similar feature descriptors significantly decreased, leaving SIFT underresearched
in some of the emerging applications. In this paper we examine the suitability of SIFT feature descriptors in
one such task, the histopathological image classification. In the conducted experimental study we investigate
the usefulness of various variants of SIFT on the BreakHis Breast Cancer Histopathological Database. While
colour is known to be significant in case of human performed analysis of histopathological images, SIFT
variants using different colour spaces have not been thoroughly examined on this type of data before. Observed
results indicate the effectiveness of selected SIFT variants, particularly Hue-SIFT, which outperformed the
reference convolutional neural network ensemble on some of the considered magnifications, simultaneously
achieving lower variance. This proves the importance of using different colour spaces in classification tasks
with histopathological data and shows promise to find its use in diversifying classifier ensembles.
1 INTRODUCTION
Traditionally, algorithms used in the task of image
recognition relied on handcrafted features. Meth-
ods such as Scale-Invariant Feature Transform (SIFT)
(Lowe, 1999) and Histograms of Oriented Gradi-
ents (HOG) (Dalal and Triggs, 2005) were success-
fully used throughout the years to provide a concise
and robust feature representations, enabling classifi-
cation with general learning algorithms, such as Sup-
port Vector Machines (SVMs). However, in the re-
cent years the convolutional neural networks (CNNs)
started dominating the field of computer vision due
to their outstanding performance. In contrast to the
classification approaches based on the handcrafted
features, CNNs are capable of automatically learn-
ing high-level data representations from provided im-
ages. Various architectures of CNNs (Krizhevsky
et al., 2012; Simonyan and Zisserman, 2014; He et al.,
2016) achieved state-of-the-art performance on nu-
merous image recognition tasks, including cancer de-
tection (Han et al., 2017; Bardou et al., 2018; Wang
et al., 2016; Albarqouni et al., 2016; Esteva et al.,
2017; Gandomkar et al., 2018). However, despite
their high recognition capabilities, CNNs can be dif-
ficult to train: they require large quantities of data to
achieve satisfactory performance, and the training it-
self is usually very time consuming, even when using
potentially costly graphics processing units (GPUs).
Using handcrafted features, such as SIFT, usually re-
quires less training data, and as a result can be prefer-
able approach for data-constrained problems (Khan
and Yong, 2016). Also, classifiers operating with im-
age descriptors can increase diversity when used to-
gether with neural networks and other classifiers in
ensembles. In this paper we experimentally evaluate
the performance of the SIFT feature descriptors in the
task of histopathological image recognition. We in-
vestigate different variants of SIFT, strategies of com-
bining and extracting the descriptors, as well as the
algorithms used for classification. As a benchmark
dataset the BreakHis Breast Cancer Histopathologi-
cal Database is used. Experimental results show that
the proposed method can outperform state-of-the-art
506
Bukała, A., Cyganek, B., Koziarski, M., Kwolek, B., Olborski, B., Antosz, Z., Swad´zba, J. and Sitkowski, P.
Classification of Histopathological Images using Scale-Invariant Feature Transform.
DOI: 10.5220/0009163405060512
In Proceedings of the 15th International Joint Conference on Computer Vision, Imaging and Computer Graphics Theory and Applications (VISIGRAPP 2020) - Volume 5: VISAPP, pages
506-512
ISBN: 978-989-758-402-2; ISSN: 2184-4321
Copyright
c
2022 by SCITEPRESS – Science and Technology Publications, Lda. All rights reserved
solutions. Therefore, it can be considered as a viable
contribution in the domain of cancer recognition.
The remainder of this paper is organized as fol-
lows: in Section 2 we discuss the related work in
histopathological image recognition using SIFT. In
Section 3 different variants of the used SIFT feature
descriptors are discussed. In Section 4 the experimen-
tal set-up is presented. Section 5 reports the achieved
results. Finally, in Section 6 we present our conclu-
sions.
2 RELATED WORKS
SIFT method combined with bag-of-feature (BOF)
models has been tested with a large variety of data
during recent years. In particular, in the case of
histopathological data, Blue Histology and ADL
Histopathological image datasets have been used in
(Pal and Saraswat, 2019). Main focus of that arti-
cle was set on introducing spiral biogeography based
optimization to find the optimal BOF, which out-
performed other similar methods in terms of speed
and classification accuracy. Similar approach has
been taken with BreakHis database in (Gheisari et al.,
2018). This time however no additional optimisation
methods were used for finding BOF. The effect of
scale and rotation invariance in SIFT + BOF models
has been analyzed on Renal Cell Carcinoma images in
(Raza et al., 2011). Color normalization prior to SIFT
detection on breast cancer tissues have proved to im-
prove classification accuracy in (Mhala and Bhandari,
2016).
The novelty of our article is in taking advantage
of such SIFT variants, that utilize additional color in-
formation for descriptor calculation. While most re-
search focus on SVM for classification, we test dif-
ferent classifiers as well as classifier ensembles for
improved accuracy.
3 FEATURE DESCRIPTORS
Considering our task, that is distinction between im-
ages containing tissues with benign and malignant
cancer cells, we needed to transform images to the set
of features, that are robust to a number of variations
that can occur. Those consist of changes in scale, ro-
tation, and illumination. Depending on a descriptor,
different levels of resilience can be obtained, as will
be discussed.
By default, the SIFT method works only with
the grayscale images. Its variant, called PCA-SIFT,
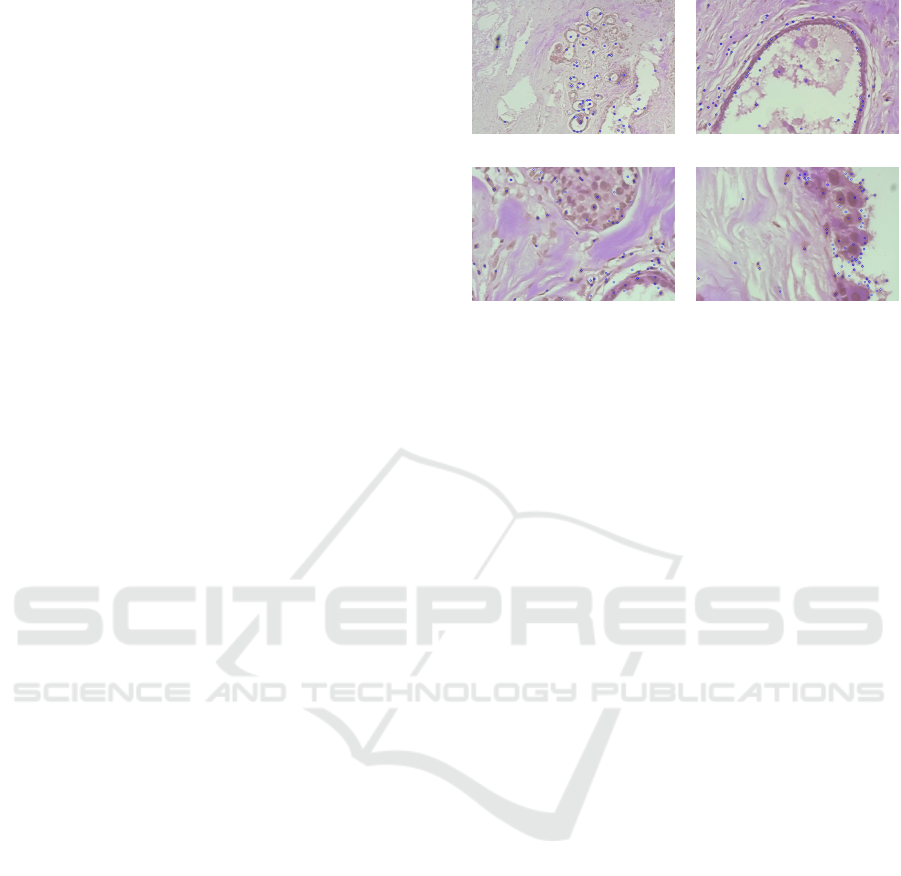
(a) 40× (b) 100×
(c) 200× (d) 400×
Figure 1: Exemplary histopathological images at various
magnification factors and detected SIFT keypoint locations.
which was also evaluated, allows for shorter descrip-
tors related to only few principal components (Ke
et al., 2004). However, to take advantage of full color
spectrum, the color variants of SIFT, as proposed in
(Van De Sande et al., 2009), were also evaluated.
These are outlined in the following subsections.
3.1 Scale-Invariant Feature Transform
The SIFT method, originally proposed by Lowe
(Lowe, 1999), actually refers to two processes. First
one is detection of the representative keypoint loca-
tions in an image. The second one, consists of com-
putation of image descriptors, i.e. features, located at
the keypoints. Hence, the method describes an image
by a collection of feature vectors, which are invariant
to image translation, scaling and rotation. Resulting
descriptors convey information on local shape of a re-
gion using edge orientation histograms. On the other
hand, the keypoints can be computed with help of the
scale-space and Harris-Laplace operator, as proposed
in (Lowe, 1999), or they can be just set on a regu-
lar grid at fixed positions in an image. An example
of keypoint alignment for histopathological images is
shown in Figure 1.
3.2 HSV-SIFT
The base version of the SIFT algorithm operates on
monochrome signals only. However, there are SIFT
versions which take advantage of the avaialble colour
information. One of them is the HSV-SIFT. In this ap-
proach, keypoints and their descriptors are computed
in the HSV color space. Bosch et al. proposed com-
puting descriptors over all three channels of the HSV
color model (Bosch et al., 2008). This results in 128-
dimensional vectors for each channel. Such features
Classification of Histopathological Images using Scale-Invariant Feature Transform
507

are scale-invariant and shift-invariant with respect to
signal intensity in each channel separately. However,
the resulting vector, being the combination of HSV
channels, has no invariance properties.
3.3 Hue-SIFT
Van de Weijer et al. proposed a concatenation of the
hue histogram with the SIFT descriptor (Van de Wei-
jer et al., 2006). Comparing to HSV-SIFT, weighed
hue histogram is used to address the instability of the
hue near the grey axis. Similarly to the hue histogram,
the Hue-SIFT descriptor is scale and shift invariant.
3.4 Opponent-SIFT
The Opponent-SIFT takes advantage of opponent
color space to calculate SIFT descriptors (Van
De Sande et al., 2009) . The information in the third
channel is equal to the intensity information, while
the other channels describe the color information in
the image. Due to the normalization of the SIFT de-
scriptor the other channels gain invariance to changes
in light intensity.
3.5 C-SIFT
In the opponent color space, used by the Opponent-
SIFT, as described in subsection 3.4, channels 1 and
2 still contain some intensity information. To add
invariance to the intensity, Geusebroek et al. pro-
posed the C-invariant method which eliminates the
remaining intensity information from these channels
(Geusebroek et al., 2001). This invariance can be
seen as the normalized opponent color space O
1
× O
2
and O
2
×O
3
. Resulting descriptors are scale-invariant
with respect to light intensity.
3.6 RG-SIFT & RGB-SIFT
For the RG-SIFT (Van De Sande et al., 2009), de-
scriptors are added for the r and g chromaticity com-
ponents of the normalized RGB color, which is scale-
invariant. RGB-SIFT (Van De Sande et al., 2009) de-
scriptor is a concatenation of SIFT descriptors calcu-
lated in all three channels of the RGB color space.
3.7 PCA-SIFT
Principal Component Analysis (PCA) is commonly
used method for dimensionality reduction and has
been applied to a broad class of computer vision prob-
lems. In our case, as described in (Ke et al., 2004), the
PCA algorithm is used on image patches. Namely, the
eigenspace is pre-computed from a selected set of rep-
resentative patches. Then, this eigenspace is used to
project other patches extracted around the keypoints.
The keypoint detection part is the same as in the orig-
inal algorithm. However, the length of the descriptors
is greatly reduced to only 36 bytes, which convey in-
formation generalized to the principal components.
4 EXPERIMENTAL SET-UP
4.1 Image Database
Experiments described in this article were conducted
on the BreakHis Breast Cancer Histopathological
Database, originally described in (Spanhol et al.,
2016b). The database contains microscopic biopsy
images of benign and malignant breast tumors. It
contains 2480 benign and 5429 malignant samples
(700 × 460 pixels, 3-channel RGB). Based on the
magnification factor, the images are separated into
four categories. For classification tasks, we assumed
two classes, i.e. malignant and benign tumors respec-
tively. For comparison, data was divided into training
and testing sets with 70%-30% ratio, respectively, in
the same way as reported in (Spanhol et al., 2016b).
4.2 Balancing the Data
BreakHis database, as described in section 4.1, has a
noticeable disproportion in class distribution, with ap-
proximately twice as much images of malignant than
benign tissues. Class imbalance has previously been
shown to negatively affect the performance of convo-
lutional neural networks in the histopathological im-
age recognition task (Koziarski et al., 2018). How-
ever, its impact was even more severe during SIFT-
based classification, leading to a failure in conver-
gence for some of the considered classifiers. To miti-
gate this issue we performed a random undersampling
of the data up to the point of achieving balanced class
distributions.
4.3 Feature Processing
Calculating feature descriptors, as described in Sec-
tion 3, leaves us with a set of vectors for each labelled
image. Each of them was further processed to obtain
better data representation. In this paper we present
three strategies of using feature descriptors: (i) clas-
sification on the level of an individual descriptor, (ii)
aggregation of all image descriptors into its average,
and (iii) computing Bag of Words, later referred as
BoW.
VISAPP 2020 - 15th International Conference on Computer Vision Theory and Applications
508

4.3.1 Individual Descriptors
In baseline case, classifiers are trained with unpro-
cessed set of all descriptor vectors extracted from
the training data, inheriting class labels from the im-
ages of origin. For each image a limited number
of descriptors is taken into account. Descriptors are
ranked by the cornerness parameter, calculated on
the basis of Harris-Laplace corner detector. A num-
ber of tested descriptors per image is expressed by
n ∈ {20, 50, 100, 200}. Predicted class probabilities
for the whole image are then calculated as the ratio
of the descriptors classified as either malignant or be-
nign points to the total number of descriptors.
4.3.2 Average Descriptor
Spanhol et al. (Spanhol et al., 2016b) proposed rep-
resenting images by averaging of their descriptors.
Main advantage of this method is its low demand
for CPU resources. We compare all types of fea-
tures, mentioned in Section 3, with this approach,
for comparison with the results presented in (Span-
hol et al., 2016b). For this strategy, the number n ∈
{100, 200, 400, 800} of descriptors per image were
taken for each test.
4.3.3 Bag of Words
In this approach we used k-means clustering al-
gorithm to prepare dictionaries based on the train-
ing data. These dictionaries are later used to
calculate BoW as final representation of an im-
age. We considered the values of k in the range
{10, 20, 50, 100, 200, 400}, resulting in k-dimensional
vectors (keywords) for each image. Also for each
k value, a different number of descriptors per image
n ∈ {10, 20, 50, 100, 200, 500} was evaluated.
4.4 Classification
We based the classification on three different learning
algorithms: the support vector machine (SVM), the
k-nearest neighbors classifier (KNN) and the random
forest classifier (RFC). Furthermore, we considered
different strategies of building the ensembles, both by
merging different model types, as well as by using
bagging (Breiman, 1996) on a single model type.
4.4.1 SVM-KNN-RFC Ensemble
In this approach we individually trained one of each
of the considered classifiers and afterwards fused their
predictions. We considered three different fusion
strategies: averaging the output probabilities, taking
the maximum probability of the malignant class, as
well as the majority voting (Kittler et al., 1998).
4.4.2 One Model Type Bagging Ensemble
In this approach we trained 10 instances of a single
model using bagging, or in other words using only
one type of a classifier, each fed with a portion of
training data. In our experiment we considered SVM
classifier. Each classifier was trained on 10% of the
original data, sampled without replacement. The pre-
viously described fusion strategies were applied as
outlined in 4.4.1.
4.4.3 Hyperparameter Tuning
For each descriptor type, feature processing, and
number of bins in the BoW models, optimal classi-
fier hyperparameters were chosen based on the re-
sults of a grid-search. For this task only images of
40× magnification factor were used. Grid search
was performed using the 10-fold cross-validation
method. For the SVM classifier, we considered the
rbf kernel and parameters C ∈ {0.01, 0.1, 1, 10, 100},
γ ∈ {10
−6
, 10
−5
, ..., 10
−2
}. For KNN we checked
k ∈ {1, 3, 5, 7, 9, 11}, whereas for the RFC the
number of estimators was in this set n
est
∈
{50, 100, 200, 400, 600, 800}.
5 RESULTS
The first part of the experiment used only basic SIFT
descriptors, and was aimed at finding the general
trends and best working feature processing strate-
gies. It should be noted that since the BreakHis
database has a noticeable over-representation of ma-
lignant class in its data, the prediction accuracy of
about 67% should be treated as baseline level, at
which a classifier fails to correctly discriminate the
individual classes.
5.1 Comparison of Feature Processing
Strategies
We began by analysing the impact of the choice
of feature processing strategy. In this experiment
the basic SIFT feature descriptor was used with the
three previously described strategies, that is, using
the unprocessed vectors (BARE), average descriptors
(AVG) and bag of words histograms (BOW). The re-
sults are presented in Table 1.
Classification of unprocessed SIFT descriptors re-
sulted in accuracy around guessing level in most
Classification of Histopathological Images using Scale-Invariant Feature Transform
509
Table 1: Comparison of different processing methods com-
bined with basic SIFT descriptors.
Strategy Clf.
Magnification
40× 100× 200× 400×
BARE
KNN 68.8 ± 1.7 67.4 ±1.2 68.7 ± 0.8 68.2 ± 5.3
RFC 69.6 ± 7.8 69.0 ±8.6 74.6 ± 8.8 69.0 ± 5.3
SVM 75.0 ± 8.3 67.4 ± 7.2 73.6 ± 9.2 68.3 ± 5.7
AVG
KNN 70.7 ± 1.8 68.0 ± 3.8 71.9 ± 1.8 66.9 ± 4.7
RFC 75.9 ± 2.7 72.3 ± 2.5 74.6 ± 2.1 70.4 ± 3.4
SVM 72.1 ± 0.7 68.2 ± 0.5 71.9 ± 1.8 69.1 ± 1.3
BOW
KNN 76.6 ± 3.6 70.5 ± 2.4 70.9 ± 1.3 68.8 ± 2.2
RFC 76.5 ± 2.8 72.9 ± 2.3 74.6 ± 2.1 73.6 ± 3.3
SVM 79.8 ± 3.2 71.9 ± 0.9 75.2 ± 3.5 73.2 ± 3.2
cases. On the other hand, balancing the data improved
accuracy for RFC and 200× magnification factor, as
well as for 40× and 400× images classified with the
SVM, reaching its peak result of 75%. Classifying
mean average of SIFT descriptor shows significant
improvement comparing to the unprocessed vectors.
In this case, the best results were obtained for 40×
magnification factor. Increasing the number of fea-
tures per image did not reveal a reliable trend to-
wards increasing accuracy scores. This did happen
on 100× and 200× magnification factors, which only
performed above 68% for 200 features or more. How-
ever the same increase gave an opposing trend on the
40× images.
Fig. 2 shows impact of increasing a number of
features per image, as well as of changing the number
of bins in BoW on the classification scores. Increas-
ing the number of features per image improves classi-
fication accuracy, with the trend of flattening with big-
ger numbers. Increasing the number of bins in BoW
also improved accuracy. However this trend was more
visible in lower values of bins, saturating around 200
of them. At some magnification factors, using 400
bins histograms further improved the results, though.
5.2 Ensemble Comparison
Table 2 presents results obtained with the ensem-
ble of three different classifiers (Ensemble), the bag-
ging based ensemble with one type member classifier
(SVM10), as discussed in subsection 4.4.2, in respect
to each single classifiers (SVM, KNN, RFC). The avg
and max suffixes in the first column refer to aver-
age and maximum probability, respectively, while mv
stands for the majority voting, see subsection 4.4.1.
In all magnification factors the SVM-KNN-RFC en-
semble improves classification accuracy, while pro-
viding lower standard deviation throughout the folds.
For this type of an ensemble, a rule of taking the clas-
sifier predicting a class with the maximum probability
as prediction of the whole ensemble, proved to be the
most efficient.
Table 2: Comparison of single classifiers, ensemble built
from 10 instances of SVM trained with smaller data
batches, and ensemble built from SVM, KNN and Random
Forest classifiers. Images are represented by BoW created
with SIFT features.
Classifier
Magnification
40× 100× 200× 400×
SVM 79.8 ± 3.2 71.9 ± 0.9 75.2 ± 3.5 73.2 ± 3.2
KNN 76.6 ± 3.6 70.5 ± 2.4 70.9 ± 1.3 68.8 ± 2.2
RFC 76.5 ± 2.8 72.9 ± 2.3 74.6 ± 2.1 73.6 ± 3.3
Ensemble-avg 79.4 ± 3.1 73.2 ± 1.8 75.2 ± 3.2 73.6 ± 2.3
Ensemble-max 79.8 ± 2.9 72.9 ± 1.5 75.6 ± 3.3 73.3 ± 2.1
Ensemble-mv 78.3± 2.8 72.6 ± 1.7 75.2 ± 2.8 73.7 ± 2.4
SVM10-avg 78.9 ± 2.2 72.3 ± 2.2 73.2 ± 3.1 71.2 ± 1.5
SVM10-max 78.0 ± 2.9 71.5 ± 2.3 73.5 ± 3.1 71.1 ± 2.5
SVM10-mv 79.4 ± 2.4 72.2 ± 2.2 73.2 ± 3.4 71.5 ± 2.3
Table 3: Performance comparison of different features with
BoW. The ensemble column contains scores from SVM-
KNN-RFC ensemble with the best models of a given feature
type.
Descriptor SVM KNN RFC Ensemble
SIFT 75.0 ± 4.2 71.7 ± 3.9 74.4 ± 3.0 75.4 ± 2.5
Hue-SIFT 86.5 ± 3.6 84.7 ± 2.9 86.8 ± 3.5 87.4 ± 2.7
HSV-SIFT 83.5 ± 2.3 81.4 ± 2.3 84.6 ± 3.2 84.4 ± 2.3
Opponent-SIFT 71.4 ± 2.4 68.9 ± 3.6 71.5 ± 3.1 72.4 ± 2.2
RG-SIFT 74.5 ± 3.3 74.6 ± 3.0 74.1 ± 3.0 75.4 ± 2.3
C-SIFT 72.3 ± 3.1 69.8 ± 3.4 73.0 ± 3.8 74.0 ± 2.1
RGB-SIFT 72.0 ± 2.7 68.9 ± 3.7 71.7 ± 2.6 72.6 ± 1.9
PCA-SIFT 71.7 ± 2.2 69.4 ± 3.0 71.3 ± 2.3 71.7 ± 1.9
5.3 Determining Best Models
When comparing different models, a single measure
for the whole dataset provides cleaner results. To
achieve that, we take average score through 5 folds
and 4 magnification factors as a reference value.
Hence, a model consists of a feature type, num-
ber of features per image, a feature processing strat-
egy, and a number of bins in the BoW. In this ap-
proach we compared the performance of different fea-
ture vectors, with results shown in Table 3. The
Hue-SIFT significantly outperformed other descriptor
types, with HSV-SIFT coming second with slightly
worse results. Also in this experiment, the SVM-
KNN-RFC ensemble, rather than a single classifier,
achieves better mean accuracies in all cases.
5.4 Comparison with Reference
Methods
Table 4 presents comparison of results obtained with
our proposed methods in respect to other published
approaches. As a reference, we took the PFTAS de-
scriptor, which was the best method in (Spanhol et al.,
2016b), as well as the convolutional neural network
which results were reported in (Spanhol et al., 2016a).
Our proposed Hue-SIFT proves to reach much better
VISAPP 2020 - 15th International Conference on Computer Vision Theory and Applications
510
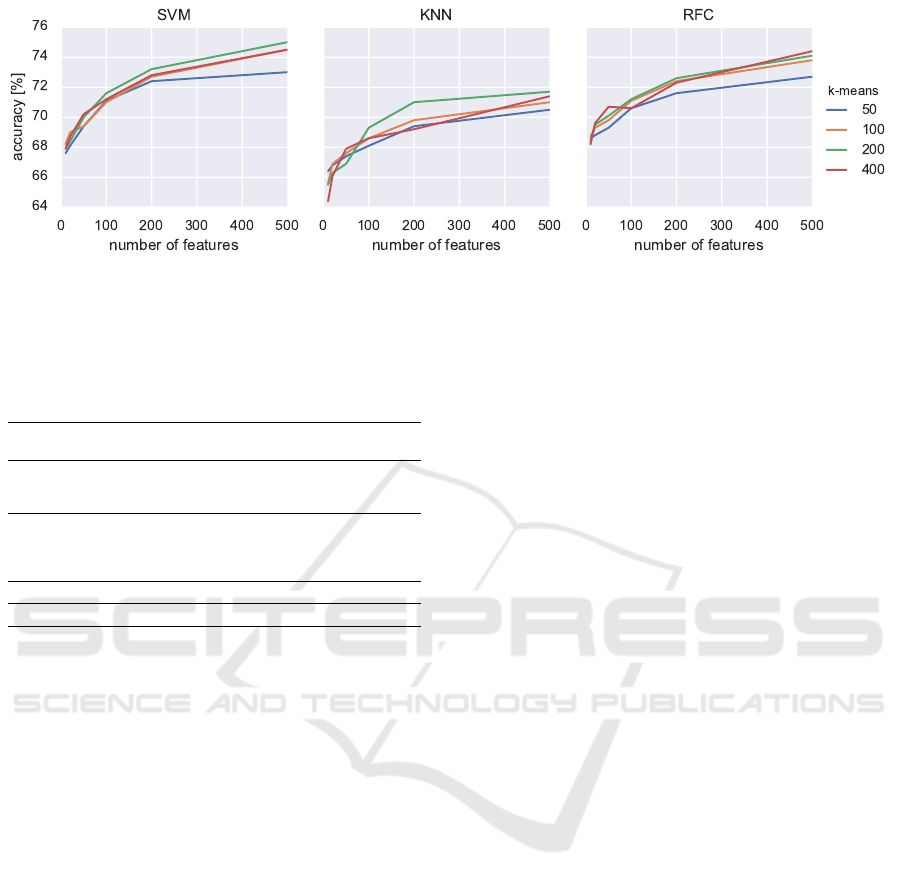
Figure 2: Classification results of the Bag of Words model calculated from the SIFT descriptors.
Table 4: Comparison of best results obtained in our works
and best methods from (Spanhol et al., 2016b) and (Spanhol
et al., 2016a). Clf. stands for applied classifier or convolu-
tional neural network (CNN), while column Desc. contains
descriptor which was used in each case.
Clf. Desc.
Magnification
40× 100× 200× 400×
KNN
PFTAS
80.9 ± 2.0 80.7 ± 2.4 81.5 ± 2.7 79.4 ± 3.9
RFC 81.8 ± 2.0 81.3 ± 2.8 83.5 ± 2.3 81.0 ± 3.8
SVM 81.6 ± 3.0 79.9 ± 5.4 85.1 ± 3.1 82.3 ± 3.8
KNN
Hue-SIFT
84.4 ± 1.8 87.4 ± 1.3 85.6 ± 1.2 81.4 ± 2.9
SVM 88.7 ± 3.4 87.9 ± 1.9 87.4 ± 1.4 82.2 ± 2.9
RFC 88.2 ± 3.7 87.8 ± 2.4 87.9 ± 2.4 83.3 ± 2.5
Ens. 88.5 ± 3.4 89.2 ± 2.3 88.4 ± 2.0 83.6 ± 3.7
CNN 88.6 ± 5.6 84.5 ± 2.4 83.3 ± 3.4 81.7 ± 4.9
CNN-Ensemble 90.0 ± 6.7 88.4 ± 4.8 84.6 ± 4.8 86.1 ± 6.2
accuracy than other sparse features in this task, espe-
cially when considering 3-classifier ensemble. This
model also outperformed results obtained by a sin-
gle convolutional neural network, only coming sec-
ond on 40× and 400× magnification factors to the
CNN-Ensemble. What is also noticeable, models uti-
lizing feature vectors tend to have lower standard de-
viation on the BreakHis image database.
6 CONCLUSIONS
Using the bag of words model for representation of
histopathological images proved to provide best re-
sults in classification tasks with SIFT descriptors. An
influence of a number of features on classification ac-
curacy can be observed in Figure 2. That is, increas-
ing the number of features, as well as increasing the
number of bins improves classification up to a certain
saturation level. However, increasing these two pa-
rameters comes at the cost of longer computations.
One of the important results shown in this paper
is that various color variants of the SIFT method al-
lowed to obtain better results. That is especially no-
ticeable with the Hue-SIFT approach operating with
the BoW which outperformed other models, includ-
ing PFTAS descriptors, reported as the best method
in (Spanhol et al., 2016b). This model also out-
ranked accuracy reached by the convolutional neural
networks, as published in (Spanhol et al., 2016a).
We demonstrated experimentally that connecting
the KNN, Random Forest and SVM into one ensem-
ble further improves mean accuracy rates, comparing
to a single classifier. Namely, an ensemble composed
of the Hue-SIFT descriptors outperformed the ensem-
ble of the convolutional neural networks at 100× and
200×, and coming close to the results at 40× and
400× magnification factors, respectively. Also, the
standard deviation of the accuracy tends to be much
smaller with our proposed ensemble, as compared to
the single CNN and CNN-Ensemble. On the other
hand, our ensemble model relied on the simple fu-
sion strategy. Hence, using other more advanced ap-
proaches, such as the weighted fusion, leaves room
for further improvements. Also an interesting direc-
tion of further research is composition of more robust
ensemble, for example with competence regions and
employing CNNs.
ACKNOWLEDGMENTS
This research was co-financed by the European Re-
gional Development Fund in the Intelligent Devel-
opment 2014-2020 Programme, within the grant
“The system of automatic analysis and recognition
of histopathological images” supported by the Na-
tional Center for Research and Development: grant
no. POIR.01.01.01-00-0861/16-00, and Diagnostyka
Consilio.
REFERENCES
Albarqouni, S., Baur, C., Achilles, F., Belagiannis, V.,
Demirci, S., and Navab, N. (2016). Aggnet: deep
learning from crowds for mitosis detection in breast
Classification of Histopathological Images using Scale-Invariant Feature Transform
511

cancer histology images. IEEE transactions on medi-
cal imaging, 35(5):1313–1321.
Bardou, D., Zhang, K., and Ahmad, S. M. (2018). Clas-
sification of breast cancer based on histology images
using convolutional neural networks. IEEE Access,
6:24680–24693.
Bosch, A., Zisserman, A., and Mu
˜
noz, X. (2008). Scene
classification using a hybrid generative/discriminative
approach. IEEE transactions on pattern analysis and
machine intelligence, 30(4):712–727.
Breiman, L. (1996). Bagging predictors. Machine learning,
24(2):123–140.
Dalal, N. and Triggs, B. (2005). Histograms of Oriented
Gradients for human detection. In international Con-
ference on computer vision & Pattern Recognition
(CVPR’05), volume 1, pages 886–893. IEEE Com-
puter Society.
Esteva, A., Kuprel, B., Novoa, R. A., Ko, J., Swetter, S. M.,
Blau, H. M., and Thrun, S. (2017). Dermatologist-
level classification of skin cancer with deep neural net-
works. Nature, 542(7639):115.
Gandomkar, Z., Brennan, P. C., and Mello-Thoms, C.
(2018). Mudern: Multi-category classification of
breast histopathological image using deep residual
networks. Artificial intelligence in medicine, 88:14–
24.
Geusebroek, J.-M., Van den Boomgaard, R., Smeulders, A.
W. M., and Geerts, H. (2001). Color invariance. IEEE
Transactions on Pattern analysis and machine intelli-
gence, 23(12):1338–1350.
Gheisari, S., Catchpoole, D., Charlton, A., Melegh, Z.,
Gradhand, E., and Kennedy, P. (2018). Computer
aided classification of neuroblastoma histological im-
ages using scale invariant feature transform with fea-
ture encoding. Diagnostics, 8(3):56.
Han, Z., Wei, B., Zheng, Y., Yin, Y., Li, K., and Li,
S. (2017). Breast cancer multi-classification from
histopathological images with structured deep learn-
ing model. Scientific reports, 7(1):4172.
He, K., Zhang, X., Ren, S., and Sun, J. (2016). Deep resid-
ual learning for image recognition. In Proceedings of
the IEEE conference on computer vision and pattern
recognition, pages 770–778.
Ke, Y., Sukthankar, R., et al. (2004). PCA-SIFT: A more
distinctive representation for local image descriptors.
CVPR (2), 4:506–513.
Khan, S. and Yong, S.-P. (2016). A comparison of deep
learning and hand crafted features in medical image
modality classification. In 2016 3rd International
Conference on Computer and Information Sciences
(ICCOINS), pages 633–638. IEEE.
Kittler, J., Hatef, M., Duin, R. P., and Matas, J. (1998). On
combining classifiers. IEEE Trans. Pattern Analysis
and Machine Intelligence, 20(3):226–239.
Koziarski, M., Kwolek, B., and Cyganek, B. (2018).
Convolutional neural network-based classification of
histopathological images affected by data imbal-
ance. In Video Analytics. Face and Facial Expression
Recognition, pages 1–11. Springer.
Krizhevsky, A., Sutskever, I., and Hinton, G. E. (2012). Im-
ageNet classification with deep convolutional neural
networks. In Advances in neural information process-
ing systems, pages 1097–1105.
Lowe, D. G. (1999). Object recognition from local scale-
invariant features. In Computer vision, 1999. The pro-
ceedings of the seventh IEEE international conference
on, volume 2, pages 1150–1157. IEEE.
Mhala, N. C. and Bhandari, S. H. (2016). Improved ap-
proach towards classification of histopathology im-
ages using bag-of-features. In 2016 International
Conference on Signal and Information Processing
(IConSIP), pages 1–5. IEEE.
Pal, R. and Saraswat, M. (2019). Histopathological image
classification using enhanced bag-of-feature with spi-
ral biogeography-based optimization. Applied Intelli-
gence, pages 1–19.
Raza, S. H., Parry, R. M., Moffitt, R. A., Young, A. N.,
and Wang, M. D. (2011). An analysis of scale
and rotation invariance in the bag-of-features method
for histopathological image classification. In Inter-
national Conference on Medical Image Computing
and Computer-Assisted Intervention, pages 66–74.
Springer.
Simonyan, K. and Zisserman, A. (2014). Very deep con-
volutional networks for large-scale image recognition.
arXiv preprint arXiv:1409.1556.
Spanhol, F. A., Oliveira, L. S., Petitjean, C., and Heutte,
L. (2016a). Breast cancer histopathological image
classification using convolutional neural networks. In
2016 international joint conference on neural net-
works (IJCNN), pages 2560–2567. IEEE.
Spanhol, F. A., Oliveira, L. S., Petitjean, C., and Heutte, L.
(2016b). A dataset for breast cancer histopathological
image classification. IEEE Transactions on Biomedi-
cal Engineering, 63(7):1455–1462.
Van De Sande, K., Gevers, T., and Snoek, C. (2009). Eval-
uating color descriptors for object and scene recogni-
tion. IEEE transactions on pattern analysis and ma-
chine intelligence, 32(9):1582–1596.
Van de Weijer, J., Gevers, T., and Bagdanov, A. D. (2006).
Boosting color saliency in image feature detection.
IEEE transactions on pattern analysis and machine
intelligence, 28(1):150–156.
Wang, D., Khosla, A., Gargeya, R., Irshad, H., and Beck,
A. H. (2016). Deep learning for identifying metastatic
breast cancer. arXiv preprint arXiv:1606.05718.
VISAPP 2020 - 15th International Conference on Computer Vision Theory and Applications
512
