
Solution Concentration and Temperature Measurements by
Long-path Optical Coherence Tomography
Tatsuo Shiina
Graduate School of Engineering, Chiba University, 1-33 Yayoi-cho, Inage-ku, Chiba-shi, 263-8522, Japan
Keywords: OCT, Industrial, Temperature, Concentration.
Abstract: Long path time domain OCT was developed and applied to evaluate a certain solution under the consideration
of concentration and temperature. Long path TD-OCT has the measurement range of 100mm and the
resolution of position decision of 1m. Optical characteristics of the solution is represented as group
refractive index by Long path TD-OCT, and it depends on solution concentration and temperature. In this
study, the experimental result of the diluted alcohol solution was compared with the plural theoretical models.
As a result, the measurement accuracy was confirmed with the refractive index error of less than 0.0001. Long
path TD-OCT has potential to evaluate the target solution with volume, and the experiment was proceeded to
monitor the spatial fluctuation process. As a result, the unique phenomenon was observed in the model
experiment of partially different refractive index sample. The OCT signal had the change of knife-edge effect
at the boundary of refractive index. More fundamental experiment was conducted to observe the phenomenon
precisely. Now the theoretical approach was started to understand the phenomenon.
1 INTRODUCTION
In industrial scene, the transparent materials often
have needs to measure their exterior and interior
characteristics, that is, flatness, uniformity, thickness,
crack, void, structure and concentration. The
transparent materials are difficult to take a camera
image. Off course, up to now, various kinds of
measurement methods are invented for these
materials. By utilizing the polarization, birefringence,
and other optical characteristics are helpful to get
information of these transparent materials. Laser
devices are powerful tool to deduce these
characteristics. Furthermore, it has the highest
accuracy to get the precise measurement.
The traditional high-precision measurement
technology is optical interference technology in
industrial field.(Yoshizawa 2015) Laser inter-
ferometer, laser displacement meter, and white-light
interferometer have been commercialized. In these
high-precision optical measurement devices, long
path measurement is one of the industrial
applications. Combinational lens such as camera lens
is essential to evaluate and analyse their lenses
matching to optimize their performance. In the case
of crystal growth and material compounding
operation, the feedbacks from the interior condition
sensing to the temperature and concentration controls
are important. On the other hand, the long path
measurement on the laser and white-light
interferometers utilizes linear motion, and they are
lack of repeatability. Furthermore, these apparatuses
are large and expensive. As a result, they have
restriction to use.
The optical coherence tomography : OCT
technology is the low coherent interferometer and
obtains the cross-sectional image by non-invasive and
non-destructive measurement, Mainly it is used in
ophthalmology.(Danielson 1991, Huang 1991,
Brezinski 1999) It is developed and commercialized
in medical field at first, and recently it is adapted to
the industrial use.(Song 2012) The combination of
super luminescent diode : SLD and optical fiber
interferometer adds the flexibility of measurement to
the device and also compactness. In this study, a
portable OCT scanner has been developed for
industrial use. (Shiina 2003, 2009, 2014, Yoshizawa
2015) The long path TD-OCT was improved to take
a measurement range of up to 100mm with 5-digit
accuracy. In this study, this technique was applied to
the refractive index measurement of a solution. To
expand the measurement to the concentration change
and erratic distribution of solution due to the
temperature, the another material was inserted into
Shiina, T.
Solution Concentration and Temperature Measurements by Long-path Optical Coherence Tomography.
DOI: 10.5220/0009159801510156
In Proceedings of the 8th International Conference on Photonics, Optics and Laser Technology (PHOTOPTICS 2020), pages 151-156
ISBN: 978-989-758-401-5; ISSN: 2184-4364
Copyright
c
2022 by SCITEPRESS – Science and Technology Publications, Lda. All rights reserved
151
the solution. As a result, the unique diffraction-like
phenomenon from knife-edge was observed. In this
report, the high precision experiment was explained
and mentioned to the new approach for the spatial
fluctuation measurement of the solution, too.
2 EXPERIMENTAL SET-UP
2.1 OCT Setup
The SLD light source of 800nm-band is installed into
the long path TD-OCT. The low coherence
interferometer changes its reference path length, and
interior information of the specimen is visualized.
Therefore, it is important to scan precisely the optical
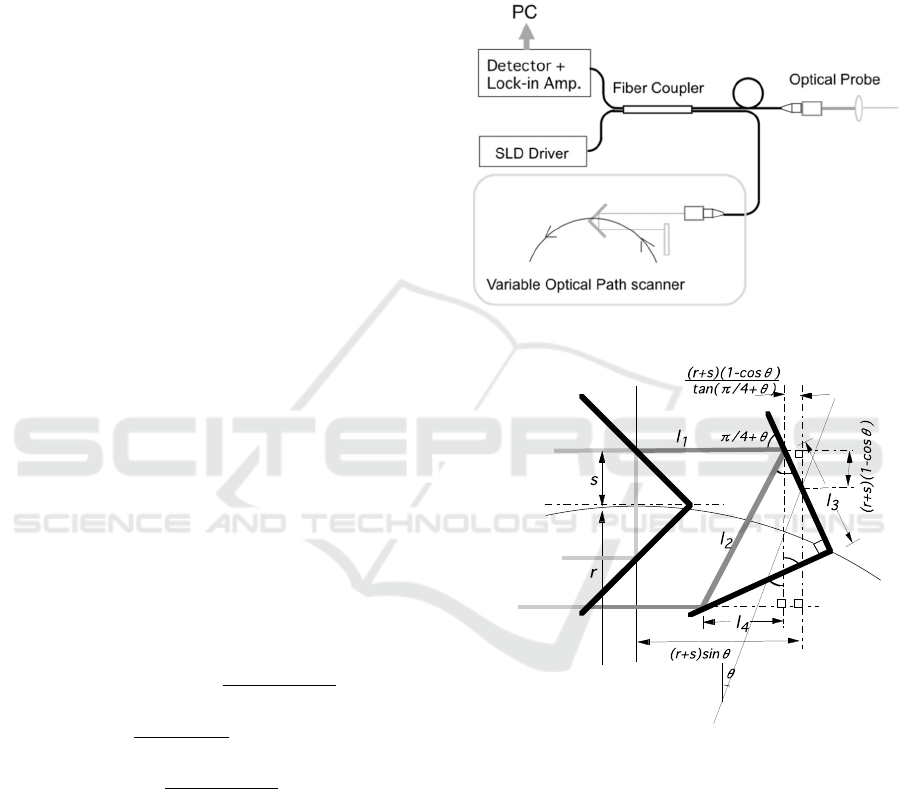
path change. The optical setup of the long path TD-
OCT is illustrated in Fig.1. The interferometer
consists of an optical fiber coupler. SLD beam
(Anritsu Co. Ltd) is divided by the coupler, one goes
to the reference path and the other goes to the
measurement path, which has the optical probe to
focus it to the specimen. Both of reflected beam are
combined and cause the interference within the same
coupler, and detected by the photodiode. The
interference signal is detected as the Gaussian
envelope through amplifiers and filter circuits.
The long path TD-OCT utilizes the rotational
optical path change mechanism. The rotation radius
and speed decide the measurement range and scan
rate, respectively. This scanning mechanism consists
of a rotating corner reflector and a fixed mirror. The
optical path change is represented by equation (1).
(1)
Figure 2 shows the geometrical arrangement of
the mechanism with the optical path of l
1
– l
4
.
θ
is
rotation angle [deg], r is rotation radius, s is the offset
length from the optical axis. The fixed mirror reflects
the thrown beam to the same path. The optical path
change becomes the approximately linear motion.
The optical path change of the rotation radius of
60mm is shown in Fig.3. The actual motion has the
distortion from the linear motion. The distortion is
about 1 – 2% within the rotation angle of +/-20
degrees.
The long path industrial OCT has a rotation disk
of 60mm radius, of which maximum measurement
range reaches 100mm. Here it is restricted to 80mm
by the reflector size. The rotation speed is 200rpm. A
servo motor is installed to stabilize the rotation.
Figure 1: Structure of long path industrial OCT.
Figure 2: Optical path change by rotating reflector.
2.2 Accuracy Improvement
The rotational optical path scanning mechanism has
the approximated linear motion. It has a small
distortion from linear change. The larger the rotation
angle is from the center position that the refractor
faces to the incident beam, the distortion becomes
larger. Furthermore, the distortion is not symmetry
right and left at the center position because of the
fixed mirror and the incident beam arrangement.
Then linear transformation from the distortion curve
was conducted by taking a balance of the distortion.
Here, the 3
rd
approximation curve, which represented
l
All
= l
1
+
l
2
+
(l
1
− l
4
) − 2s
= 2l
1
+ l
2
(1 − sin 2
θ
) − 2s
l
1
= (r + s)sin
θ
−
(r + s)(1− cos
θ
)
tan(
π
/4+
θ
)
l
2
=
l
3
cos(
π
/4+
θ
)
l
3
= 2s+
(r + s)(1− cos
θ
)
sin(
π
/4+
θ
)
l
4
= l
2
sin(2
θ
)
PHOTOPTICS 2020 - 8th International Conference on Photonics, Optics and Laser Technology
152
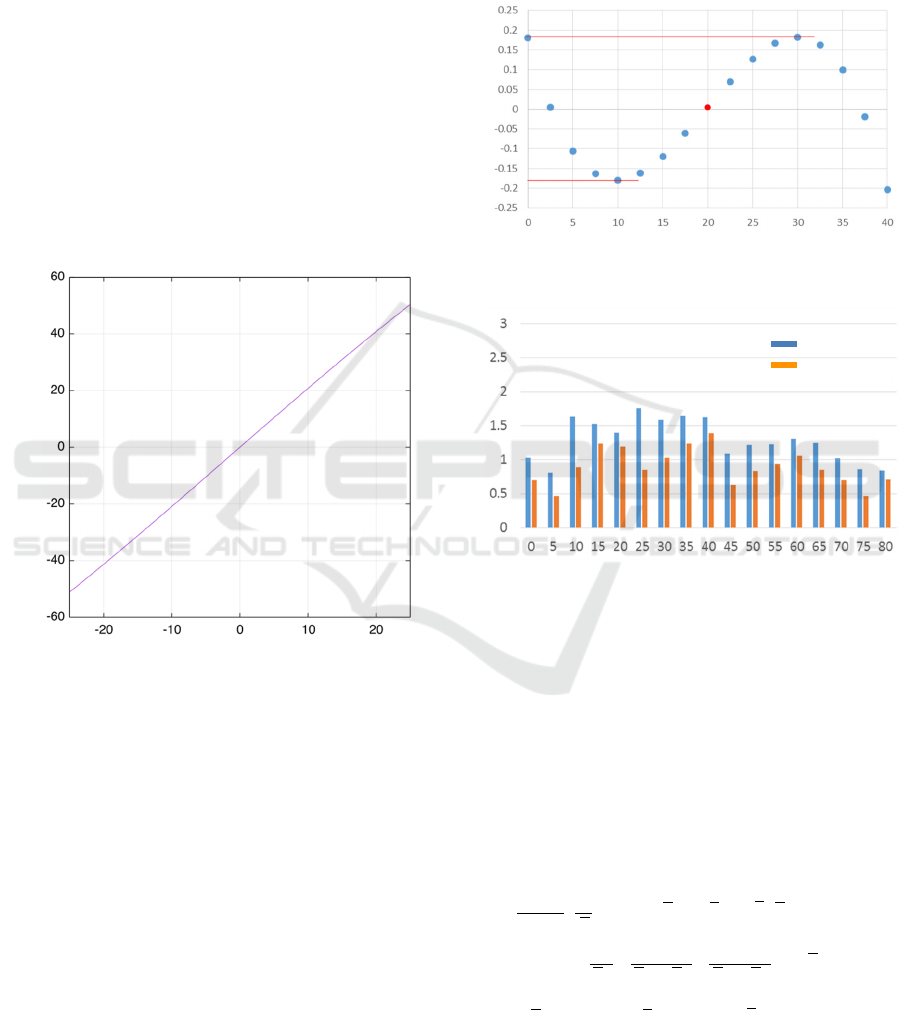
as equation (2), is adapted to the balanced distortion
curve experimentally obtained as shown in Fig.4.
y =−0.00010456x
3
+ 0.0035485x
2
+ 2.0526x +13.845
(2)
Even if the servo motor was installed into the long
path TD-OCT, the rotation jitter still remained.
Standard deviation of 10 times measurement at each
path length is investigated in Fig.5. The blue bars
indicate the normal average of 10 times
measurements. The servo motor accelerates or
decelerates to keep its rotation speed, and such force
influences to the positioning of the reflector. Such an
accidental fluctuation was trimmed from the results,
and took an average to minimize the standard
deviation. It is represented as red bars. The total error
restricted within 1μm.
Rotation Angle [deg.]
Figure 3: Optical path difference of long path TD-OCT.
The refractive index measurement is the purpose
of the long path TD-OCT. The experimental set up is
shown in Fig.6. The measurement target is 5cm x 5cm
water tank (small tank). 15cm x 15cm water tank
(large tank) is the temperature control tank, which has
a cooler terminal. In the measurement, water
temperature is lowered, and the refractive index,
which depend on the temperature, was calculated by
measuring the optical path change between the inside
glass walls of the small tank. To stabilize the
controlled temperature inside the small tank, a stirrer
rotates the water in the large tank slowly. a thermo-
camera was also installed to monitor the temperature
distribution of the small.
The OCT measurement probe was set to enter the
small tank within the measurement range. The
interference signals of the small tank were obtained at
four positions from its glass walls (each side of the
walls). The refractive index was calculated by the
optical path length between the inner water-sides of
the small tank walls. The temperature was controlled
from the 25 to 2 degrees at the step of 0.5 degrees.
Rotation Angle [deg.]
Figure 4: Deviation balance on optical path difference.
Figure 5: Measurement errors on each optical path
difference.
3 EXPERIMENTAL RESULTS
3.1 Water Refractive Index
The refractive index depends on material density,
temperature, and incident wavelength. Absolute
refractive index equation shown as equation (3) is a
regression formula due to the above parameters based
on Lorentz-Lorentz equation.
n
2
+1
n
2
+ 2
⋅
1
D
= a
0
+ a
1
D + a
2
T + a
3
λ
2
T
+
a
4
λ
2
+
a
5
λ
2
−
λ
UV
2
+
a
6
λ
2
−
λ
IR
2
+ a
7
D
2
D = D / D
0
, T = T / T
0
,
λ
=
λ
/
λ
0
(3)
where n is the absolute refractive index of pure water,
𝐷
is density scale represented by the ratio between the
Optical Path Error [μ m]
Normal
Correction
Optical path Length [mmj]
Optical Path Difference [mm]
Solution Concentration and Temperature Measurements by Long-path Optical Coherence Tomography
153
pure water density D and the standard density D
0
[kg/m
3
], 𝑇
is temperature scale represented by the
ratio between the pure water temperature T [K] and
the standard temperature T
0
(=273.15K). 𝜆
̅
is
wavelength scale represented by the ratio between the
wavelength in vacuum λ and the standard wavelength
λ
0
(=0.589μm). a
0
– a
7
are optimized coefficients and
λ
UV
and
λ
IR
are UV / IR resonances. [7]
The OCT light source (here, SLD light source)
has wide spectrum. The SLD light disperses in a
material, and difference of speed (group index) due to
the refractive index occurs. That is, the refractive
index estimated by the OCT system becomes group
index of refraction . It is expressed as equation
(4).
(4)
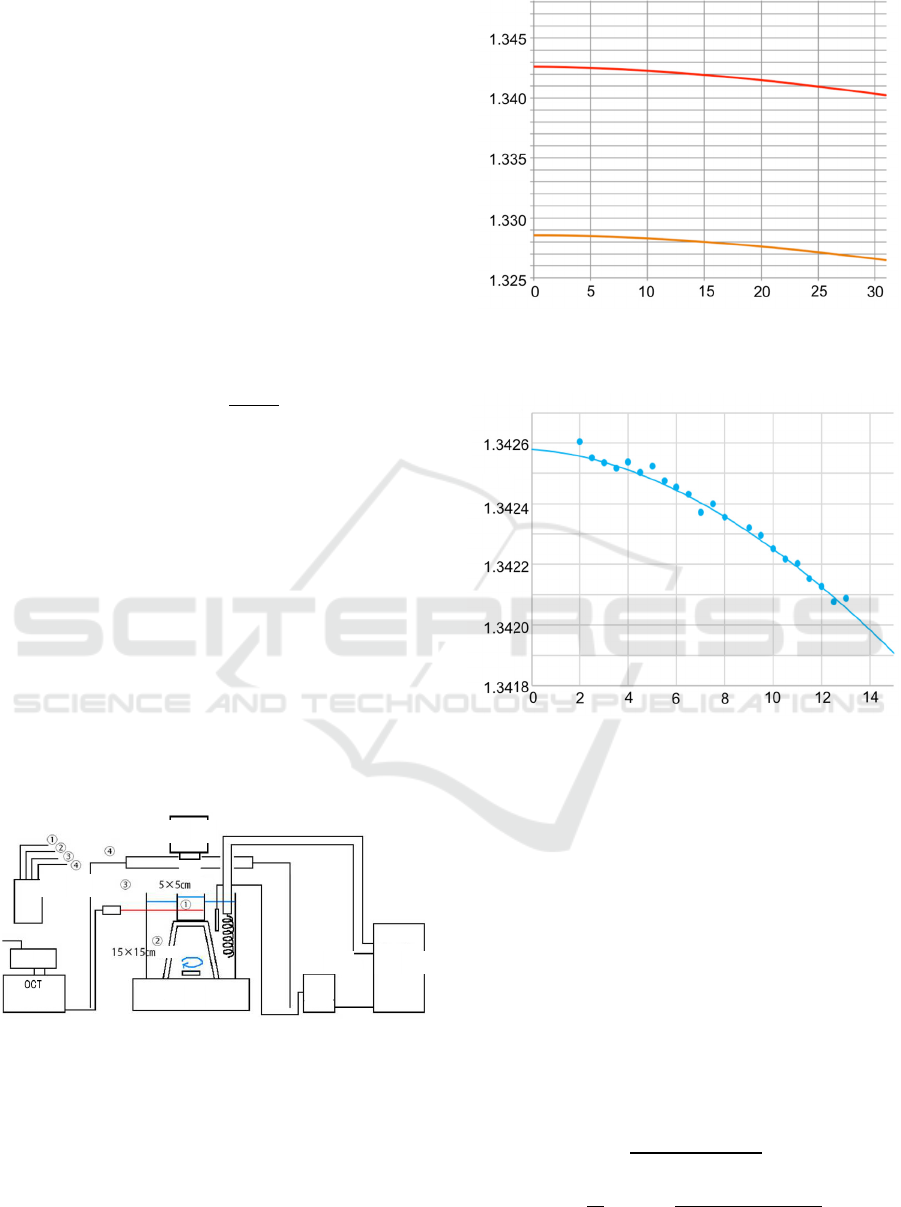
Figure 7 shows the absolute index calculated by
the equation (3) and the group index calculated by the
equation (4) against the wavelength of 859.681nm,
which is same as the experiment. The experimental
results were compared with this group index.
The water group refractive index was obtained by
the experiment as shown in Fig.8. The measurement
was conducted by lowering the temperature from the
room temperature to 2 degrees. In the figure, the
results are represented as average with 10 times
measurements. The result well matched with the
theoretical value of group index. The maximum
errors from the theoretical curve was 0.00070. It gets
the five-digit accuracy. The maximum error occurred
on the longest path difference. It is caused by the 3
rd
approximation curve we used.
Figure 6: Water refractive index measurement by long-path
TD-OCT. The thormo meter minotered at each position
signed with the same numbers.
Figure 7: Refractive index and group refractive index of
water at each temperature.
Figure 8: Change of water group refractive index.
3.2 Refractive Index of Diluted Ethanol
Next step, group refractive index of diluted ethanol
was measured. Ethanol concentration was 20, 40, 60,
80 and 100% by diluting them with pure water. The
result is shown in Fig.9. The refractive index of the
concentration of 60 – 80% becomes higher than that
of the concentration of 100%. In the ethanol
concentration of 60 – 80% is not the sum of ethanol
and water volumes. Because the water molecules get
into the intervals among the ethanol molecules, the
density becomes high and the refractive index
becomes high, too. The experimental results indicate
its characteristics. The theoretical curve was obtained
by the Oster’s law shown as equation (5).
𝑛1
𝑛1
2𝑛
1
𝑛
1𝑐
𝜌
𝜌
𝑛
1
𝑛
1
2𝑛
1
𝑛
(5)
n
g
n
g
= n(
λ
) −
λ
dn(
λ
)
d
λ
Cooler
Thermo
Camera
SLD
Stirrer
Thermo-
meter
Thermo
Controller
Temperature [deg]
Refractive Index
Group Refractive Index
Temperature [deg]
● Experiment
-- Calculation
Group Refractive Index
Refractive / Group Refractive Index
PHOTOPTICS 2020 - 8th International Conference on Photonics, Optics and Laser Technology
154
𝑐
𝜌
𝜌
𝑛
1
𝑛
12𝑛
1
𝑛
Where n, n
1
, n
2
are refractive index of diluted ethanol,
water and ethanol, respectively. 𝜌, 𝜌
, 𝜌
are density
of diluted ethanol, water and ethanol, respectively. C
is ethanol density. The experimental results well
matched with the theory. Their accuracy was 4-digits.
Figure 9: Group refractive index of diluted alcohols at each
temperature.
4 NEW APPROACH
4.1 Material Insertion
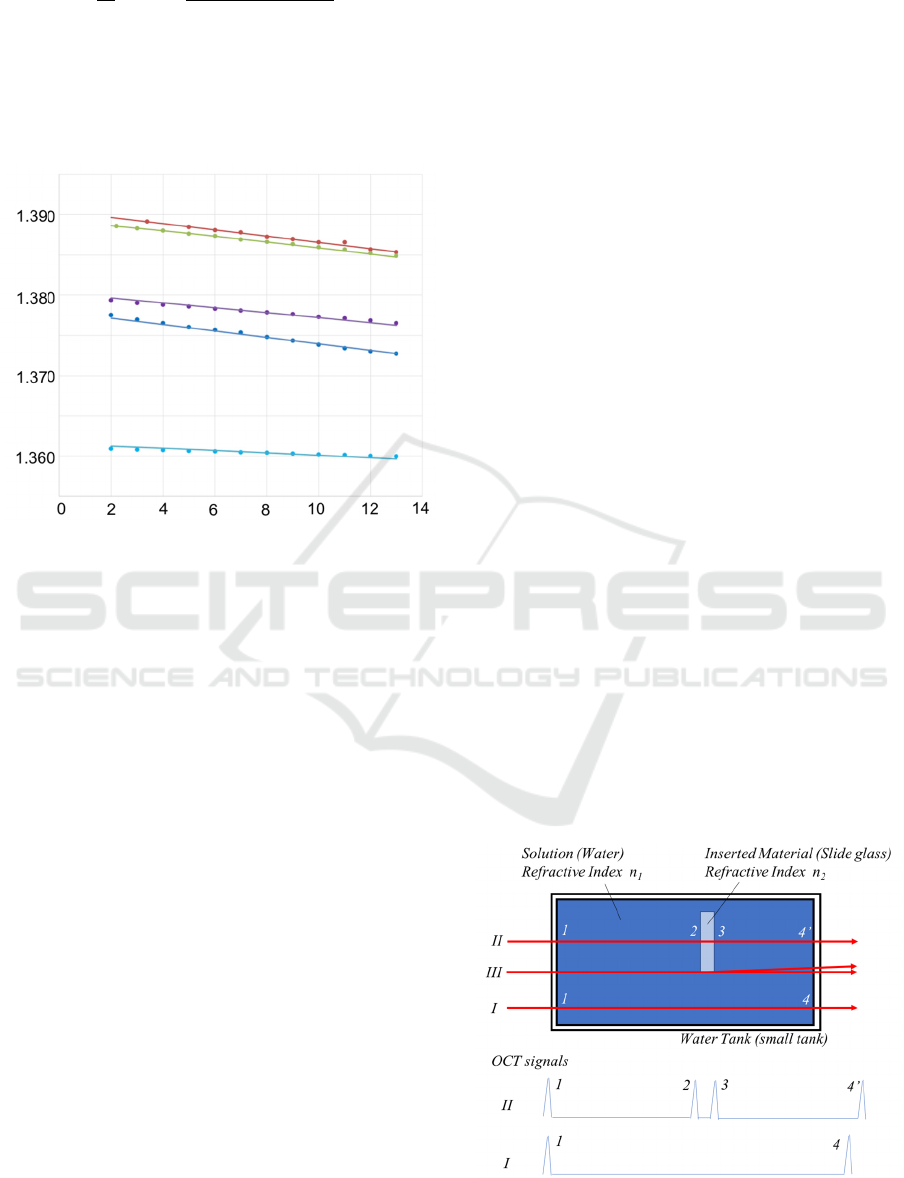
The purpose of this study is to visualize the
concentration change and erratic distribution of
solution due to the temperature. Such an effect can be
captured in the OCT signal, that is, the difference of
the optical path length in the solution. Figure 10
shows the experiment and the supposed OCT signals.
The slide glass was inserted into the water tank. When
the OCT beam is scanned on the glass inserted part
( II ), the OCT signal has longer interval between the
tank former signal ( 1 ) and tank rear signal ( 4’ ) than
the interval ( 1 - 4 ) on the water only part ( I ). It
looked that the tank rear signal simply shifted due to
the refractive index and the thickness of the inserted
slide glass. The boundary part ( III ) caused the
diffraction due to the knife-edge effect. The OCT
beam propagates with a certain divergence, and it is
reflected by the tank interior glass. The beam will not
be able to return to the OCT probe because of the
divergence.
The actual result did not like that. Figure 11 shows
the result. They are the OCT signals from the front
( 2 ) and rear ( 3 ) surfaces of the inserted slide glass.
The boundary never shifted simply, but the unique
diffraction-like phenomenon from knife-edge ware
appeared. The rear surface signal of the inserted slide
glass had more clear vibration than the front surface
signal. OCT is a point measurement, and its probe get
a reflected intensity from a point of the material
boundary. Diffraction phenomenon is an intensity
distribution with beam divergence. To observe its
distribution, the receiving aperture should have a
certain shift from the incident beam position in
perpendicular to the beam propagation. The OCT
probe is an inline optics, that is, common use for
transmitter and receiver. Why such a phenomenon
appeared ? What is the meaning of the signals ?
4.2 Fundamental Consideration
To make this phenomenon clear, the water tank was
removed and put the fixed mirror plate. the inserted
slide glass was replaced with a movable thin mirror,
too. In this set up, the movable mirror and the fixed
mirror plate act as knife-edge ( 2 or 3 ) and reflecting
target ( 4’ ), respectively. The result is shown in
Fig.12. It is the OCT signals from the fixed mirror.
Depending on the movable mirror positions, more
clear diffraction pattern was appeared. It has
completely same vibration with the diffraction pattern
from a knife-edge. Its degree depends on the beam
divergence. The degree of the vibration was changed
due to the beam divergence conditions. It is
considered that the diffracting wave front effected by
its divergence will be return to the OCT probe and
cause the interference signal. Now this fundamental
experiment was repeated with some variations and
theoretical approach was started to explain this
phenomenon.
Figure 10: Spatial fluctuation of concentration in a solution
volume.
Temperature [deg]
20%
40%
60%
80%
100%
Group Refractive Index
Solution Concentration and Temperature Measurements by Long-path Optical Coherence Tomography
155
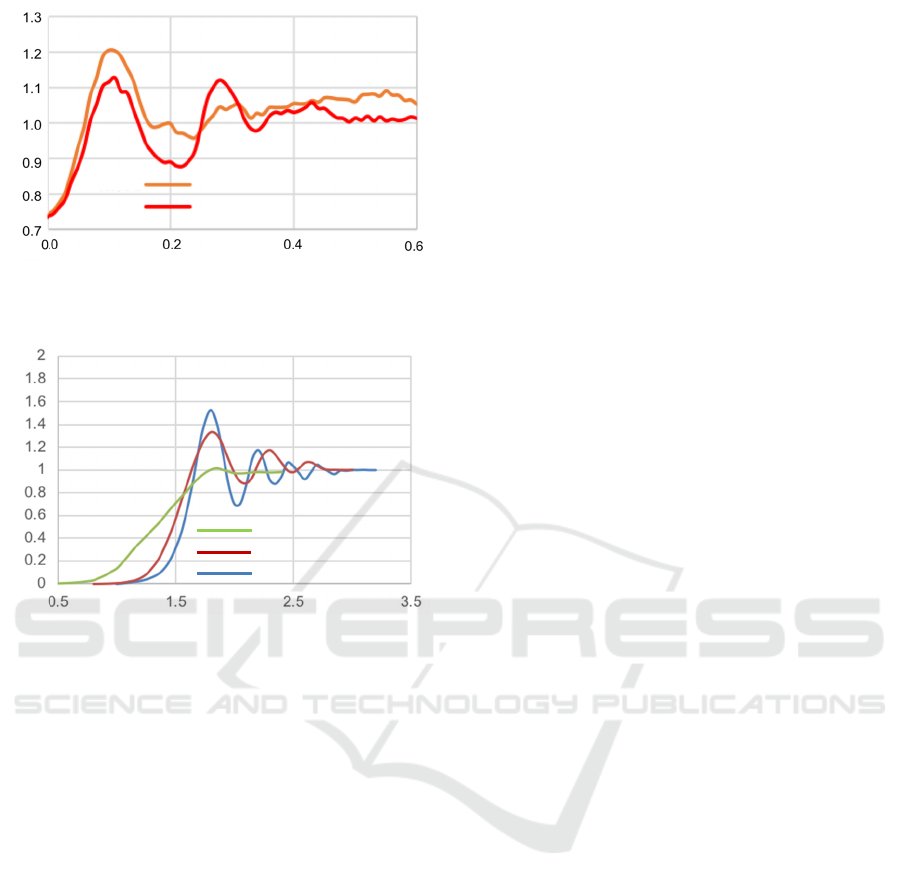
Figure 11: Interference intensity vibrations on slide glass
measurement.
Figure 12: Interference intensity vibrations on mirror
measurement.
5 CONCLUSIONS
In this study, the high precision long path TD-OCT
system was developed to measure the refractive index
due to the temperature. Its accuracy was 5 digits for
water and 4 digits for ethanol solution. This approach
will link to the observation of local and temporal
change of the solution concentration. In this
measurement, the target solution can be treated in a
large volume. It will be able to visualize the spatial
and temporal phase transition of a solution,
fluctuation of concentration or temperature
distribution of solution, and mixing condition in some
solutions.
At its initial stage that the fluctuation was
modelled with the slide glass in a water, the unique
phenomenon was observed. At the boundary
condition, that is, at the case that the beam partially
interrupted by the movable thin mirror, which is act
as the knife-edge, the diffraction patterns were
observed. Their diffraction patterns are quite similar
to that of the knife-edge diffraction. The beam
propagated to the slide glass or the fixed mirror and
reflected to the OCT probe. In general, the diffraction
from the knife-edge can be observed on the screen
perpendicular to the optical axis. The diffracted beam
has a divergence and it cannot return to the same path
with the going way. The OCT probe transmits and
receives the beam on the in-line optical path. The
observed pattern was captured at that conditions. It
was confirmed that the small beam divergence will
cause the phenomenon. The theoretical analyses will
help to understand the situation.
The observed unique pattern will have valuable
information between the solution and the inserted
material. It represents the small angle divergence. The
OCT image will have the enhance effect to the
boundary between their materials. The small-angle
scattering on X-ray regions is suggestive. Is it
possible to deduce such fruitful information from the
pattern? Now such consideration is started.
REFERENCES
Brezinski M. E. and Fujimoto J. G., 1999, “Optical
Coherence Tomography: High-Resolution Imaging in
Nontransparent Tissue”, IEEE J. Quant. Electron., Vol.
5, No. 4, pp.1185-1192.
Danielson B. L. and Boisrobert C. Y. 1991, “Absolute
optical ranging using low coherence interferometry”,
App. Opt. Vol. 30, No.21 pp.2975-2979.
Harvey A. H., Gallagher J. S., and J. M. H. L.,
1998, ”Revised Formulation for the Refractive Index of
Water and Steam as a Function of Wavelength,
Temperature and Density”, J. Phys. Chem. Ref. Data,
Vol.27, pp.761-774.
Huang D., Swanson E. A., Lin C. P., Schuman J. S., Stinson
W. G., Chang W., Hee M. R., Flotte T., Gregory K.,
Puliafito C. A., J. G. Fujimoto, 1991, “Optical
Coherence Tomography”, Science, Vol. 254, pp.1178-
1181.
Shiina T., Moritani Y., Ito M., and Okamura Y.,
2003, "Long optical path scanning mechanism for
optical coherence tomography", Applied Optics, Vol.42,
No. 19, pp.3795-3799.
Shiina T., Miyazaki H., and Honda T., 2009, “Factory built-
in type simplified OCT system for industrial
application”, IEEJ C、Vol.129, No.7, pp.1276-1281,
(Japanese)
Shiina T., 2014, “Optical Coherence Tomography for
industrial application” Handbook of Optical Metrology
2
nd
Edition, CRC Press, Chapter 30, pp.769 – 790..
Shiina T., PCT/JP2010/070844
Song G. and Harding K G, 2012, “OCT for industrial
applications”, Proc. Of SPIE, 8536.
Yoshizawa t. Eds, 2015, Handbook of optical metrology:
principles and applications, second edition, CRC Press.
Slide Glass Insertion distance [mm]
Interference Intensity [a.u.]
Front Surface Signal
Rear Surface Si
g
nal
Knife Edge Insertion Distance [mm]
Interference Intensity [a.u.]
Collimated (<0.3mrad)
Divergence(1.0mrad)
Divergence(1.4mrad)
PHOTOPTICS 2020 - 8th International Conference on Photonics, Optics and Laser Technology
156
