
Clinical Performance Evaluation of a Machine Learning System for
Predicting Hospital-Acquired Clostridium Difficile Infection
Erin Teeple
1
, Thomas Hartvigsen
1
, Cansu Sen
2
, Kajal Claypool
3
and Elke Rundensteiner
1,2
1
Data Science Program, Worcester Polytechnic Institute, Worcester, MA, U.S.A.
2
Department of Computer Science, Worcester Polytechnic Institute, Worcester, MA, U.S.A.
3
Harvard Medical School, Boston, MA, U.S.A.
Keywords: Electronic Health Record (EHR), Healthcare, Machine Learning, Clostridium Difficile Infection (CDI),
Hospital-Acquired Infection (HAI).
Abstract: Clostridium difficile infection (CDI) is a common and often serious hospital-acquired infection. The CDI Risk
Estimation System (CREST) was developed to apply machine learning methods to predict a patient’s daily
hospital-acquired CDI risk using information from the electronic health record (EHR). In recent years, several
systems have been developed to predict patient health risks based on electronic medical record information.
How to interpret the outputs of such systems and integrate them with healthcare work processes remains a
challenge, however. In this paper, we explore the clinical interpretation of CDI Risk Scores assigned by the
CREST framework for an L1-regularized Logistic Regression classifier trained using EHR data from the
publicly available MIMIC-III Database. Predicted patient CDI risk is used to calculate classifier system output
sensitivity, specificity, positive and negative predictive values, and diagnostic odds ratio using EHR data from
five days and one day before diagnosis. We identify features which are strongly predictive of evolving
infection by comparing coefficient weights for our trained models and consider system performance in the
context of potential clinical applications.
1 INTRODUCTION
Clostridium difficile infection (CDI) occurs when a
toxin-producing strain of Clostridium difficile
colonizes and multiplies within the gastrointestinal
tract (Centers for Disease Control and Prevention
[CDC], 2019; Lessa, Mu, Bamberg, et al., 2015;
Cohen, Gerding, Johnson, et al., 2010; Evans &
Safdar, 2015; Burnham & Carroll, 2013; Dubberke &
Olson, 2012). While some CDI cases are
asymptomatic or present with mild gastrointestinal
symptoms, in severe cases, infection can result in
diffuse colitis, toxic megacolon, and even death. Over
the last two decades, CDI has increased in both
frequency and severity across the world, particularly
among hospitalized patients. Based on these trends,
CDI has been designated by the United States Centers
for Disease Control and Prevention (CDC) as an
urgent threat to public health (CDC, 2019).
CDI is the most common healthcare-associated
infection: in 2017, among hospitalized patients, an
estimated 223,900 incident CDI cases and 12,800
deaths associated with CDI occurred in the United
States (CDC, 2019). Direct hospital costs attributable
to CDI are estimated at $1 billion for 2017 (CDC,
2019), with other estimates of annual costs
attributable to CDI ranging from $1 to 4.9 billion in
recent years (CDC, 2019; Lessa et al., 2015).
Recommendations for reducing CDI rates in
healthcare facilities include Clostridium difficile
testing for patients with clinically significant
diarrhoea and immediate isolation (Cohen et al.,
2010; Dubberke et al., 2012; Balsells, Filipescu,
Kyaw, et al. 2016). However, because case detection
relies on testing performed after symptoms develop,
spores from new infections can disperse in healthcare
environments before treatment and isolation begin,
continuing the cycle of new infections. Automated
surveillance methods for early and accurate CDI risk
stratification and case detection would therefore be
very useful for supporting prevention and early
treatment efforts.
Machine learning systems offer promise for such
automated patient event detections and for providing
real-time, facility-specific insights to support quality
and safety programs, not only by identifying early
signs of new patient infections but also by flagging
656
Teeple, E., Hartvigsen, T., Sen, C., Claypool, K. and Rundensteiner, E.
Clinical Performance Evaluation of a Machine Learning System for Predicting Hospital-Acquired Clostridium Difficile Infection.
DOI: 10.5220/0009157406560663
In Proceedings of the 13th International Joint Conference on Biomedical Engineering Systems and Technologies (BIOSTEC 2020) - Volume 5: HEALTHINF, pages 656-663
ISBN: 978-989-758-398-8; ISSN: 2184-4305
Copyright
c
2022 by SCITEPRESS – Science and Technology Publications, Lda. All rights reserved

facility-specific risk factors (Sen, Hartvigsen,
Rundensteiner & Claypool, 2017; Wiens, Campbell,
Franklin, et al., 2014; Wu, Roy & Stewart, 2010;
Chang, Yeh, Li, et al., 2011).
1.1 Related Work
CDI Risk estimation in this study follows the CREST
(CDI Risk Estimation System) framework (Sen et al.,
2017). CREST is a data-driven approach that applies
machine learning methods to continuously estimate a
patient’s CDI risk during hospitalization using
information from the patient’s inpatient electronic
health record (EHR). CREST computes CDI risk first
at the point of admission and then updates the patient
risk score daily as additional information and test
results are added to the patient chart. In practice,
patient historical information is used by clinicians on
a patient-by-patient basis for risk stratification and
differential diagnosis. Formalized CDI risk
stratification tools for clinical use have been reported
which quantify patient risk for CDI based on
historical information or treatment records (Wu et al.,
2010; Chandra, Thapa, Marur & Jani, 2014; Tabak,
Johannes, Sun, et al. 2015).
EHR systems enable point of care risk
stratification methods to be implemented
automatically, and a number of recent studies have
demonstrated that EHR data contains information that
may be used to predict hospital-acquired infection
events such as CDI (Wu et al. 2010; Chang et al.,
2011; Johnson, et al., 2016; Hartvigsen, Sen,
Brownell, et al., 2018). The CREST method allows
for implementation of large-scale, automated early
CDI risk stratification and potential early case
identification. Previously, CREST has demonstrated
high prediction accuracy, achieving an area under the
curve (AUC) of up to 0.76 when predicting CDI five
days before microbiological diagnosis, with the AUC
increasing further to 0.80 one day before laboratory
confirmation of diagnosis.
The performance of machine learning methods for
predicting recurrent CDI using integrated multicenter
electronic health record information has been studied
recently by Escobar and colleagues, who reported a
relatively low AUC, 0.591 - 0.605, for recurrent
cases (Escobar, Baker, Kipnis, et al., 2017). AUC
score provides a combined measure of test sensitivity
and specificity and thereby reflects inherent test
validity. Considering potential clinical applications
for CDI risk score information metrics other than
AUC may be useful. For example, when considering
the positive and negative predictive interpretations of
CDI risk assessments, a system which identifies
likely cases but has a high false positive rate may still
be useful in practice as a flagging mechanism to
prompt minimal risk preventive actions such as close
observation and patient isolation precautions that can
limit spread of infections. In order to effectively
utilize machine learning methods in clinical decision-
making, evaluation beyond AUC is necessary. We
present in this study a systematic evaluation of the
clinical performance of CREST and propose
particular clinical applications for this approach
based on this evaluation.
1.2 Our Contributions
Using records from the MIMIC-III database, we
follow the CREST framework and apply a L1-
Regularized Logistic Regression classifier system to
generate hospital-acquired CDI risk predictions using
different combinations of time invariant (static), time-
variant (dynamic), and computed temporal synopsis
EHR features (Sen et al., 2017). We then evaluate
system predictions using clinical diagnostic
performance metrics: sensitity, specificity, positive
and negative predictive values, and diagnostic odds
ratio. While many core machine learning methods
exist, L1-Regularized Logistic Regression is selected
as the core machine learning method for this
investigation to permit examination of which EHR
features are assigned highly positive or negative
predictive feature weights during classifier training.
We then consider varying use cases for automated
CDI predictions.
2 METHODS
2.1 Data Source and Prediction Task
The MIMIC-III Database is a publicly available
archive comprised of EHR information collected
from the Beth Israel Deaconess Hospital Intensive
Care Unit from 2001 to 2012 (Johnson et al., 2016).
The database includes EHR information from 58,976
admissions, covering each patient’s stay from ICU
admission to discharge. CDI cases in the MIMIC-III
cohort were identified by searching for all patient
records containing the microbiology code
corresponding to a positive Clostridium difficile
culture (MIMIC-III organism identification code:
80139). Figure 1 presents our CDI case and control
patient selection process. Among 58,976 admissions,
positive Clostridium difficile microbiological testing
Clinical Performance Evaluation of a Machine Learning System for Predicting Hospital-Acquired Clostridium Difficile Infection
657
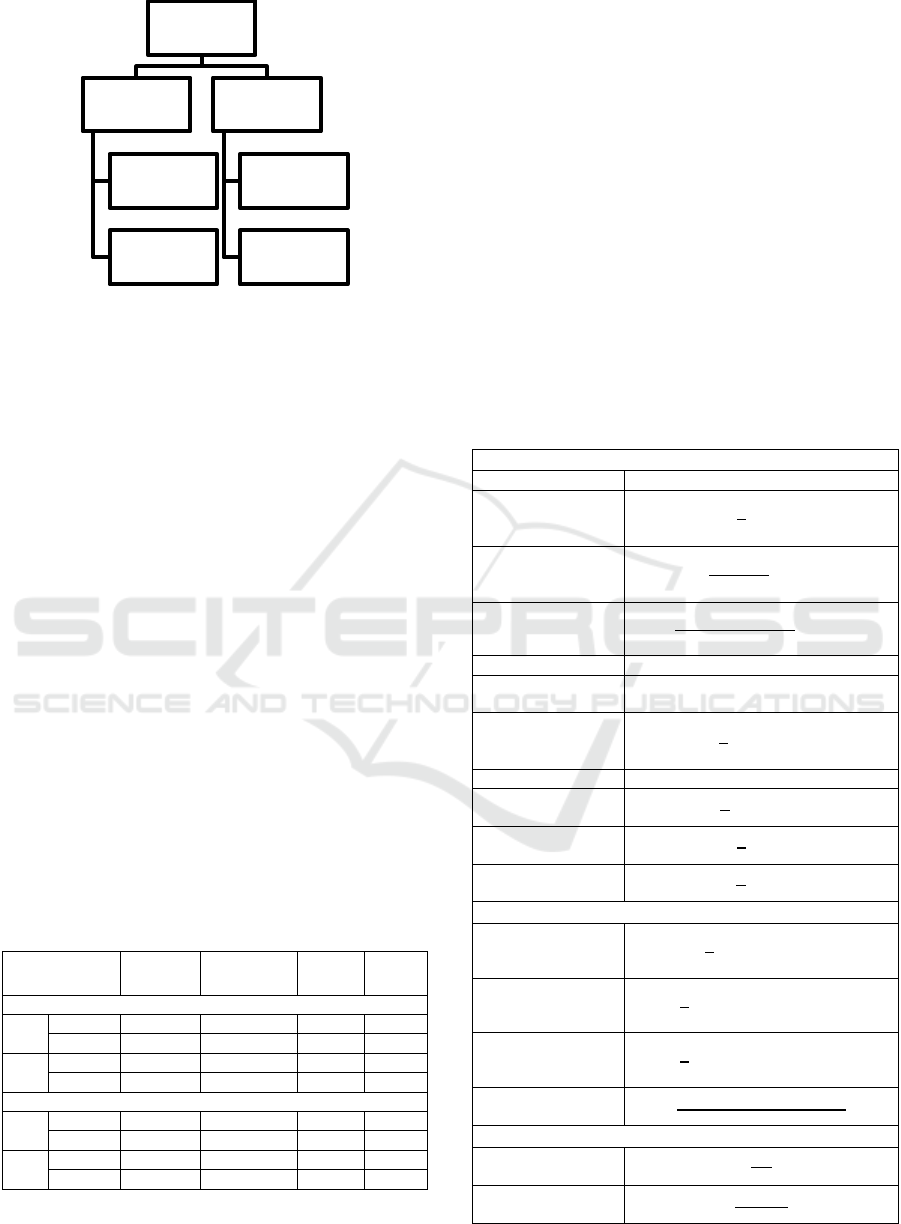
Figure 1: Selection of CDI case and control records.
confirmed 1079 cases of CDI diagnosed during
hospitalization. This study focuses on the prediction
of hospital-acquired CDI. We therefore excluded
from our analysis all patients who tested positive for
CDI before five days of hospitalization. A total of 501
CDI patients with microbiological confirmation at
least five days after hospital admission remained for
inclusion in our study. We then randomly selected a
comparison group of patients who were hospitalized
for a comparable length of time but did not contract
CDI during hospitalization. Patients were considered
eligible for inclusion in the group of control subjects
if their records did not contain the microbiology code
indicating a positive Clostridium difficile result and if
their length of admission was greater than or equal to
five days. Given that the number of patients in the
CDI group was much smaller than the number of
patients that could potentially be included in our
control group, we chose to randomly subsample the
group of potential non-CDI comparison patients to
achieve a 1.8:1 ratio of non-CDI controls (n = 888):
CDI cases (n = 501). CDI and non-CDI patients
identified were then randomly assigned to training
(70% of sample) or testing (30% of sample) groups.
Table 1: Training and testing group characteristics.
Gender
M:F
Age (y)
mean±SD
Prev.
CDI
Abx
use
1 day before laboratory-confirmed CDI
CDI 195:159 66.8 ± 15.6 4% 17%
Control 340:278 58.8 ± 23.3 2% 13%
CDI 75:74 67.0 ± 15.6 7% 18%
Control 165:105 55.5 ± 25.5 0% 10%
5 days before laboratory-confirmed CDI
CDI 133:118 66.0 ± 16.0 5% 18%
Control 218:179 54.9 ± 24.5 1.5% 12%
CDI 63:52 63.8 ± 14.9 7% 14%
Control 107:57 56.4 ± 26.4 1.2% 11%
M: male; F: female; SD: standard deviation; Abx:
Antibiotic; Prev.: previous
Three groupings of EHR features are studied for
their predictive impact: 1) static, time-invariant data
extracted from records at the point of admission; 2)
time-variant and engineered time-series summary
fields for physiological data updated during
hospitalization; and 3) all time-invariant, time-
variant, and engineered time-series summary fields.
Design and implementation of the CDI Risk
Estimation System (CREST) has been previously
reported. Briefly, the CREST framework defines a
readily extractible set of EHR data features including
static, time-invariant patient information (age,
ethnicity, gender, selected medical history
information mined from text notes); dynamic, time-
varying information (heart rate, blood pressure,
laboratory results, and nursing assessments); and
time-series summary features computed from EHR
Table 2: Computed Trend Features.
Trend-Based
Recording length
N
Recording average
1
𝑛
𝑥
Linear weighted
average
2
𝑛(𝑛+1)
𝑖𝑥
Quadratic weighted
average
6
𝑛(𝑛+1)(2𝑛+1)
𝑖
𝑥
Standard deviation Ơ
Maximum
recording
max
i
x
i
Normalized
maximum location
1
𝑛
𝑓
(
max
𝑥
)
Minimum recording min
i
x
i
Normalized
minimum location
1
𝑛
𝑓
(
min
𝑥
)
Normalized first
record location
1
𝑛
𝑓
(
𝑥
)
Normalized last
record location
1
𝑛
𝑓
(
𝑥
)
Fluctuation-Based
Mean absolute
difference
1
𝑛
| 𝑥
−𝑥
|
Number of increase
patterns
1
𝑛
𝟙 (
(
𝑥
−𝑥
)
>0)
Number of decrease
patterns
1
𝑛
𝟙 (
(
𝑥
−𝑥
)
<0)
Ratio of change in
direction
𝑆
(
𝑖𝑛𝑐,𝑑𝑒𝑐
)
∪𝑆(𝑖𝑛𝑐,𝑑𝑒𝑐)
𝑛
−1
Sparsity - Based
Measurement
frequency
𝑛
𝑙𝑜𝑠
Proportion of
missing values
𝑙𝑜𝑠 − 𝑛
𝑙𝑜𝑠
MIMIC III Database:
58,976 admissions
57,897
no positive CDI
culture
21,120 excluded for
hospital stay less
than 5 days
Non-CDI controls
selected randomly
(n = 888)
1079
positive CDI culture
578 excluded for CDI
diagnosed before
hospital day 5
Hospital-acquired
CDI cases (n=501)
HEALTHINF 2020 - 13th International Conference on Health Informatics
658
data over multiple days (trends, fluctuations, and
sparsity summaries of time-varying items). Data pre-
processing, algorithm implementation, and
performance evaluation were performed using Python,
version 3.6, with the scikit-learn (Pedregosa,
Varoquaux, Gramfort, et al., 2011) and pandas libraries
(McKinney, 2010).
Classification is performed using L1-Regularized
(Lasso) Logistic Regression. Hyper-parameter tuning
to optimize performance is implemented using five-
fold cross validation on the training data set. For each
of three EHR data subsets (static features only;
dynamic and trend features; all features), after
classifier training, CDI Risk Scores are assigned to
patients in the testing group based on their EHR
information leading up to five days and one day before
microbiological diagnosis documentation in the patient
record. The CDI Risk Score is outputted as a
continuous value between 0 and 1, with higher
numbers representing a greater computed risk of CDI.
For calculation of our evaluation metrics, we select
Risk Score cut-offs of 0.25 and 0.50 to binarize this
output. Patients with Risk Scores below the cut off are
classified as not having CDI, while patients with scores
above the cut off are classified as having CDI.
We then calculate clinical performance metrics for
each Risk Score cut-off and set of input features (Jones,
Ashrafian, Darzi & Athanasiou, 2010). Of note,
positive and negative predictive values vary by
prevalence (Figure 2). Since the total number of
admissions hospitalized for greater than five days (n =
36,278) and the number of microbiology-positive cases
of CDI in the whole patient cohort are known (n = 501),
we calculate an estimated prevalence of CDI for the
entire patient cohort (prevalence = 501/(501+35,777)
= 1.38%) and then use this calculated prevalence of
CDI to estimate test positive and negative predictive
values in our study population.
2.2 Performance Comparison
Following training with three EHR data subsets (Static,
Dynamic and Trend, and All), testing group patients
were evaluated by the trained classifier and assigned
CDI Risk Scores for days one and five before
microbiological diagnosis. Comparing binarized
patient risk score classifications with whether CDI was
confirmed by laboratory testing, we then evaluated
classifier performance for each set of input features.
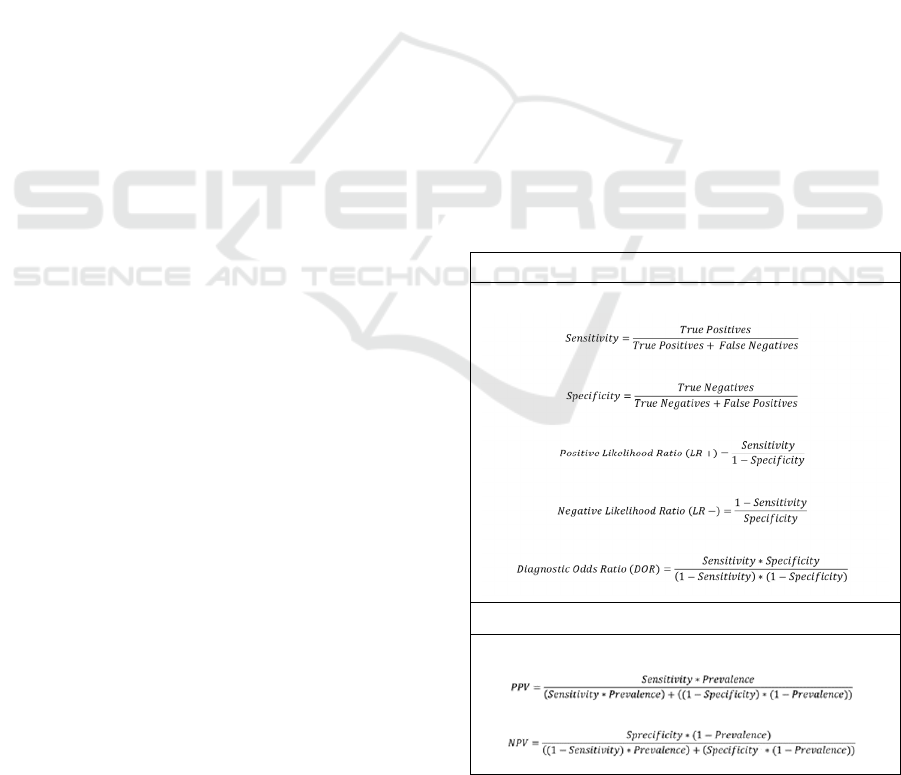
Equations used for performance evaluation are
presented in Table 3.
Among the metrics used to evaluate classifier
performance, sensitivity reflects the ability of the test
to correctly identify positive cases. In contrast,
specificity reflects the ability of the classifier to
correctly identify individuals who do not have the
condition of interest. Both sensitivity and specificity
are independent of prevalence. Positive and negative
predictive values vary by prevalence. These can be
calculated either for the test sample or estimated
based on the prevalence of the condition of interest in
a population. Predictive values are dependent on
prevalence rates. For a population of a given
prevalence, higher predictive values provide
relatively higher confidence that the test result
accurately indicates a patient’s true status relative to
the condition of interest. In contrast, low predictive
values imply that test results frequently misclassify
patients relative to the condition of interest.
Likelihood ratios are test metrics that provide
information on how the odds of having the condition
of interest changes given a positive or negative test
result (Jones et al., 2010; Mitchell, 1997). The odds
of a patient having a condition of interest given a
particular test result can be expressed as a function of
the pre-test odds of the disease multiplied by the
likelihood ratio. This measure does not depend on
prevalence, and the positive and negative likelihood
ratios can be computed as functions of test sensitivity
and specificity. In addition, the diagnostic odds ratio
is used as a measure of test discrimination ability and
Table 3: Clinical performance metrics.
Prevalence-Independent Metrics
Prevalence-Dependent Metrics
PPV: positive predictive value; NPV: negative predictive
value
Clinical Performance Evaluation of a Machine Learning System for Predicting Hospital-Acquired Clostridium Difficile Infection
659

can be useful for the comparison of different
diagnostic tests. The diagnostic odds ratio can also be
computed as a function of sensitivity and specificity
and as such, is also independent of disease prevalence
for a particular test.
Confidence intervals are calculated from error
rates on the classification tasks for the test set data.
Taking the classification error rates as unbiased
estimators following a binomial distribution, we
approximate these with a normal distribution with
mean error rate = p and standard deviation 𝜎=
()
, where p is the proportion correctly
classified and n is number of patients tested in the
denominator. These means and standard deviations
are then used to calculate 95% confidence intervals
for classification sensitivities and specificities and the
other performance metrics.
3 RESULTS
For the classifier using only static features, test data
AUC scores were 0.631 at 1 day and 0.564 at 5 days
before diagnosis. Using only dynamic and trend
features, AUC scores were 0.766 at 1 day and 0.734
at 5 days before diagnosis. Using all features, AUC
scores were 0.799 and 0.721 at 1 and 5 days,
respectively. Table 4 presents performance metrics
with 95% confidence intervals for each set of data
features used by the classifier system. At one day
before chart-recorded CDI diagnosis, we observe that
the best overall performance is achieved using the
static, dynamic, and trend features together. At five
days before chart-recorded CDI diagnosis, we find
that using all available features with the lower risk
score cut-off of 0.25, we achieve an impressive
sensitivity of 0.99 (95% CI: 0.97 – 1.00) with
specificity 0.14 (95% CI: 0.09 – 0.19). At one day
prior to clinical diagnosis, we also observe that the
classifier trained using dynamic and trend features
alone achieves a high sensitivity for detecting
infection. This observation is notable, given that the
classifier system using only dynamic and trend
information is making a determination of CDI risk
without using historical information. As such, the
classifier is functioning impressively as a biophysical
data diagnostic tool, with the possibility that more
sophisticated machine learning approaches could
further improve evolving infection detection using
such engineered time series features. Looking at the
positive likelihood ratios, we see that patients
identified by the system as possible CDI cases based
on computed trend features are 4.3 (95% CI: [2.7 –
Table 4: Diagnostic performance [95% CI].
Out
p
ut Cut-off: 0.50
Performance
Metric
1 day before
confirmed CDI
5 days before
confirmed CDI
Static Features Only
Sensitivity
Specificity
PPV
NPV
LR+
LR-
DOR
0.33 [0.24, 0.51]
0.81 [0.76, 0.86]
0.02 [0.01, 0.04]
0.99 [0.99, 0.99]
1.70 [1.00, 2.90]
0.83 [0.68, 0.99]
2.10 [1.10, 4.30]
0.30 [0.22, 0.38]
0.76 [0.69, 0.83]
0.02 [0.01, 0.03]
0.99 [0.98, 0.99]
1.20 [0.71, 2.20]
0.93 [0.75, 1.10]
1.30 [0.63, 3.00]
Dynamic and Trend Features
Sensitivity
Specificity
PPV
NPV
LR+
LR-
DOR
0.40 [0.32, 0.48]
0.91 [0.88, 0.94]
0.06 [0.04, 0.10]
0.99 [0.99, 0.99]
4.30 [2.70, 8.00]
0.66 [0.55, 0.77]
6.60 [3.50, 14.5]
0.32 [0.23, 0.41]
0.90 [0.85, 0.95]
0.04 [0.02, 0.10]
0.99 [0.99, 0.99]
3.10 [1.50, 8.20]
0.76 [0.62, 0.91]
4.10 [1.70, 13.2]
Static, Dynamic, and Trend Features
Sensitivity
Specificity
PPV
NPV
LR+
LR-
DOR
0.46 [0.38, 0.54]
0.87 [0.83, 0.91]
0.05 [0.03, 0.08]
0.99 [0.99, 0.99]
3.60 [2.20, 6.00]
0.62 [0.51, 0.75]
5.80 [3.00, 12.0]
0.33 [0.24, 0.42]
0.87 [0.82, 0.92]
0.04 [0.02, 0.99]
0.99 [0.99, 0.99]
2.60 [1.30, 5.30]
0.77 [0.63, 0.92]
3.40 [1.40, 8.30]
Out
p
ut Cut-off: 0.25
Performance
Metric
1 day before
confirmed CDI
5 days before
confirmed CDI
Static Features Only
Sensitivity
Specificity
PPV
NPV
LR+
LR-
DOR
0.80 [0.74, 0.86]
0.39 [0.33, 0.44]
0.02 [0.02, 0.02]
0.99 [0.99, 0.99]
1.30 [1.30, 1.30]
0.50 [0.42, 0.59]
2.6 [2.2, 3.0]
0.84 [0.77, 0.91]
0.32 [0.25, 0.39]
0.02 [0.01, 0.02]
0.99 [0.99, 0.99]
1.20 [1.00, 1.50]
0.51 [0.23, 0.92]
2.40 [1.10, 6.50]
Dynamic and Trend Features
Sensitivity
Specificity
PPV
NPV
LR+
LR-
DOR
0.90 [0.85, 0.95]
0.41 [0.35, 0.47]
0.02 [0.02, 0.02]
1.00 [0.99, 1.00]
1.50 [1.30, 1.80]
0.25 [0.11, 0.43]
6.10 [3.10, 16.8]
1.00 [ - , - ]
0.06 [0.02, 10.0]
0.02 [ - , - ]
1.00 [ - , - ]
1.10 [ - , - ]
0.00 [ - , - ]
- [ - , - ]
Static, Dynamic, and Trend Features
Sensitivity
Specificity
PPV
NPV
LR+
LR-
DOR
0.82 [0.76, 0.88]
0.65 [0.59, 0.71]
0.03 [0.03, 0.04]
1.00 [0.99, 1.00]
2.30 [1.90, 3.00]
0.28 [0.17, 0.41]
8.20 [4.60, 18.0]
0.99 [0.97, 1.00]
0.14 [0.09, 0.19]
0.02 [0.01, 0.02]
1.00 [.995, 1.00]
1.20 [1.10, 1.20]
0.06 [0.00, 0.33]
18.6 [3.2, >18.6]
PPV: positive predictive value; NPV: negative predictive
value; LR+: positive likelihood ratio; LR-: negative
likelihood ratio; DOR: diagnostic odds ratio
HEALTHINF 2020 - 13th International Conference on Health Informatics
660

8]) times more likely to be true CDI cases for the 0.50
output score cut-off.
To determine which features are identified by the
system as being predictive of CDI, we examine the
feature weights assigned to different EHR attributes.
Patient characteristics assigned the top predictive
weights during model training are presented in Table
5. Using only static features, the algorithm assigns
positive or negative feature weights to fewer than 10
features for both one and five days before diagnosis.
Static data features weighted as predictive included
patient characteristics known to be associated with
increased CDI risk (e.g. antibiotic use and age), as
well as other data features not directly related to CDI
(e.g. religion, insurance type). When dynamic and
trend EHR features are used to train the algorithm,
heavily weighted features include a combination of
physiological measures (e.g. normalized white blood
cell count, phosphate) and trend information (e.g.
linear arterial blood pressure average, verbal
responsiveness fluctuation). Notably, when the
classifier is trained using all available features (Static,
Dynamic, and Trend), the most heavily weighted
characteristics are physiological parameters and their
computed variations, indicating that the strongest
predictive signals are present in this biophysical
information, even when combined with historical and
patient event information.
4 DISCUSSION
In this study, we evaluate the clinical performance of
a machine learning system for predicting hospital-
acquired CDI in an intensive care patient cohort up to
one and five days before microbiological diagnosis.
The combination of static, dynamic, and trend EHR
features generally performs well, and dynamic and
temporal features alone also achieve a strong
performance. Examination of classifier feature
weights indicates that predictions are made not only
using known risk factors, but also on the basis of more
complex physiological feature patterns emerging
within the computed time series features preceding
laboratory diagnosis.
Our finding that EHR information contains
signals predictive of hospital-acquired infection risk
is consistent with results from other studies (Wiens et
al., 2014; Chandra et al., 2014; Tabak et al., 2015),
including studies exploring machine learning
applications in healthcare settings (Wiens et al., 2014;
Wu et al., 2010; Chang et al., 2011; Hartvigsen et al.,
2018).
Although multiple core machine learning
methods are available for clinical risk estimation
Table 5: Feature weights by predictor set.
Static Features Only
1 day before confirmed
CDI
5 days before confirmed
CDI
Admission: NEWBORN
-0.41
Admit: PREMATURE
-0.31
Insurance: PRIVATE
-0.27
Admit: REFERRAL
-0.07
Previous: ANTIBIOTIC
0.05
Religion: NOT SPECIFIED
-0.04
Admit: PREMATURE
-0.11
Insurance: PRIVATE
-0.03
Insurance: MEDICARE
0.02
Admission: NEWBORN
-0.01
Previous Diabetes: YES
0.005
AGE: continuous variable
0.003
Dynamic and Temporal Features
1 day before confirmed
CDI
5 days before confirmed
CDI
YEAST: # decrease trends
-0.59
VERBAL RESP: fluct. ratio
-0.57
PHOSPHATE: frequency
0.52
WHITE BLOOD CELLS
0.49
VERBAL RESP: 1 day
0.34
CVP: normalized time
0.29
COAG+STAPH: decr.
-0.25
PPI: 1 day before
0.16
PPI: fluctuation ratio
0.15
VERBAL RESP: ave.
-0.11
SYSTOLIC BP: linear av.
18.167
KLEBSIELLA: infection
-17.600
H2 antagonists: 4 days
-13.040
Surgical Service: 3 days -
10.971
Antibiotic: 3 days
-10.922
Temperature: 4 days
6.719
HR Alarm [High]: # decr.
6.155
MAGNESIUM: 4 days
5.969
MCH: normalized # incr.
-5.084
MCH: Max recording
-4.921
Static, Dynamic, and Trend Features
1 day before confirmed
CDI
5 days before confirmed
CDI
YEAST: fluctuation ratio
-0.54
PHOSPHATE: frequency
0.53
VERBAL RESP: fluct. ratio
-0.53
WHITE BLOOD CELLS
0.48
VERBAL RESP: 1 d before
0.33
CVP: time of last record
0.27
COAG STAPH: fluct. ratio
-0.23
Insurance: PRIVATE
-0.19
VERBAL RESPONSE: ave
-0.19
PPI: linear average
0.161
HR Alarm [High]: 4 d
-2.980
GLUCOSE: normalized
1.414
Cardiac Surgery Service 4 d
1.405
BP [Systolic]: minimum
1.388
RDW: time first record
-1.305
HR Alarm [High]: # decr.
1.287
OMED 5 days
-1.242
PHOSPHATE: st. recordings
1.212
ABP Alarm [Low]: min
1.184
CHLORIDE: normalized
-1.132
Clinical Performance Evaluation of a Machine Learning System for Predicting Hospital-Acquired Clostridium Difficile Infection
661

tasks, in this study, we selected L1-regularized
logistic regression in order to be able to examine EHR
feature weights alongside classification performance.
A few features positively weighted by the classifier
are not clearly related to CDI risk or likely to be
related to evolving symptomatology – for example,
service or admission location. In practice,
unexpectedly weighted characteristics also have the
potential to reflect phenomena of institutional or
clinical epidemiological interest, such as
unrecognized infection transmission routes or
previously undetected groups of patients at elevated
risk (Cohen et al., 2010; Shaughnessy, Micielli,
DePestel, et al., 2011). Thus, in a machine learning
classification system, it is desirable to be able to
examine what features are being identified by the
system as predictive, even when such features may
not be validated as risk factors by previous
epidemiological studies.
A limitation of the current study is that we include
data from only one set of archived electronic patient
records for an intensive care unit patient population,
limiting the generalizability of our results. Further
investigations are needed to cross-validate this
system and compare the clinical performance of
CREST in different healthcare facilities and for
different patient groups. In addition, other
opportunities further performance improvements may
also be accomplished through the use of alternative
core machine learning methods and optimized cross-
validation approaches. It also remains to be studied
whether changes in the risk score itself may be useful
as inputs to the system.
Given the overall relatively low prevalence of
CDI in the patient population, the sensitivity and
specificity of CREST would require improvement
before the system could be used as a diagnostic tool.
However, the ability of CREST to flag evolving high-
risk patients based on real-time clinical data makes
the system very useful for preventive interventions
and infection control epidemiology applications.
Facility-level prevention activities that present
minimal or no risk to individual patients, such as
precautionary patient isolation or increased
observation with a lowered threshold for ordering
diagnostic testing, might be considered for patients
who the system identifies as potential CDI cases.
5 CONCLUSIONS
We conclude from this study that machine learning
strategies can be productively applied to EHR data for
early identification of hospital-acquired CDI cases
and that dynamic feature variability provides
particularly strong predictive signals, beyond patient
information used for traditional clinical risk
assessments. Further investigations are needed to
cross-validate this system, to compare the
performance of this approach for different facilities
and patient groups, and to explore its ability to
discriminate among diagnoses.
ACKNOWLEDGEMENTS
Thomas Hartvigsen thanks the US Department of
Education for supporting his PhD studies via the grant
P200A150306 on “GAANN Fellowships to Support
Data-Driven Computing Research”. Cansu Sen
thanks WPI for granting her the Arvid Anderson
Fellowship (2015-2016) to pursue her PhD studies.
We also thank the DSRG and Data Science
Community at WPI for their support and feedback.
REFERENCES
‘Antibiotic Resistance Threats in the United States,’
Centers for Disease Control and Prevention, 2019.
https://www.cdc.gov/drugresistance/pdf/threats-
report/2019-ar-threats-report-508.pdf
Lessa, F.C., Mu, Y., Bamberg, W.M., Beldavs, Z.G.,
Dumyati, G.K., Dunn, J.R., and others, 2015. Burden of
Clostridium difficile infection in the United States. N
Engl J Med, 372 (9): 825-834.
Cohen, S.H., Gerding, D.N., Johnson, S., Kelly, C.P., Loo,
V.G., McDonald, L.C., and others, 2010. Clinical
practice guidelines for Clostridium difficile infection:
2010 update by the society for healthcare epidemiology
of America (SHEA) and the infectious diseases society
of America (IDSA). Infect Control Hosp Epidemiol, 31
(5): 431-455.
Evans, C.T., Safdar, N., 2015. Current Trends in the
Epidemiology and Outcomes of Clostridium difficile
Infection. Clin Infect Dis, 60 (Suppl 2): S66-71.
Burnham, C.A., Carroll, K.C., 2013. Diagnosis of
Clostridium difficile infection: an ongoing conundrum
for clinicians and for clinical laboratories. Clin
Microbiol Rev, 26(3): 604-630.
Dubberke, E.R., Olsen, M.A., 2012. Burden of Clostridium
difficile on the healthcare system. Clin Infect Dis, 55
(Suppl 2): S88-92.
Dubberke, E.R., Carling, P., Carrico, R., Donskey, C.J.,
Loo, V.G., McDonald, L.C., and others, 2014.
Strategies to prevent Clostridium difficile infections in
acute care hospitals: 2014 update. Infect Control Hosp
Epidemiol, 35(6): 628-645.
Balsells, E., Filipescu, T. Kyaw, M.H., Wiuff, C.,
Campbell, H., Nair, H., 2016. Infection prevention and
control of Clostridium difficile: a global review of
HEALTHINF 2020 - 13th International Conference on Health Informatics
662

guidelines, strategies, and recommendations. J Glob
Health, 6(2): 020410.
Sen, C., Hartvigsen, T., Rundensteiner, E., and Claypool,
K., 2017. CREST-Risk prediction for Clostridium
difficile infection using multimodal data mining. Proc.
European Conference on Machine Learning &
Principles and Practice of Knowledge Discovery in
Databases, Macedonia.
Wiens, J., Campbell, W.N., Franklin, E.S., Guttag, J.V., and
Horvitz, E., 2014. ‘Learning data-driven patient risk
stratification models for Clostridium difficile’, Open
Forum Infect Dis, 1(2): ofu045.
Wu, J., Roy, J., and Stewart, W.F., 2010. Prediction
modeling using EHR data: challenges, strategies, and a
comparison of machine learning approaches. Med
Care, 48 (Suppl 6): S106-113.
Chang, Y.J., Yeh, M.L., Li, Y.C., Hsu, C.Y., Lin, C.C.,
Hsu, M.S., and Chiu, W.T., 2011. Predicting hospital
acquired infections by scoring system with simple
parameters. PLoS One, 6(8): e23137.
Johnson, A.E., Pollard, T.J., Shen, L., Lehman, L.W., Feng,
M., Ghassemi, M. and others, 2016. MIMIC III, a freely
accessible critical care database. Sci Data, 3: 160035.
Pedregosa, F., Varoquaux, G., Gramfort, A., Michel, V.,
Thirion, B., Grisel, O., and others, 2011. Scikitlearn:
machine learning in Python. Journal of Machine
Learning Research, 12: 2825-2830.
McKinney, W.: ‘Data structures for statistical computing in
Python’, in Editor (Eds.): ‘Book Data structures for
statistical computing in Python’ (2010, edn.), pp. 51-56
Jones, C.M., Ashrafian, H., Darzi, A., and Athanasiou, T.,
2010. Guidelines for diagnostic tests and diagnostic
accuracy in surgical research. J Invest Surg, 23, (1): 57-
65.
Mitchell, T.M.: ‘Machine Learning’ (McGraw-Hill
Science/Engineering/Math, 1997. 1997)
Chandra, S., Thapa, R., Marur, S., and Jani, N., 2014.
Validation of a clinical prediction scale for hospital
onset Clostridium difficile infection. J Clin
Gastroenterol, 48(5): 419-422.
Tabak, Y.P., Johannes, R.S., Sun, X., Nunez, C.M., and
McDonald, L.C., 2015. Predicting the risk for hospital-
onset Clostridium difficile infection (HO-CDI) at the
time of inpatient admission: HO-CDI risk score. Infect
Control Hosp Epidemiol, 36 (6): 695-701.
Escobar, G.J., Baker, J.M., Kipnis, P., Greene, J.D., Mast,
T.C., Gupta, S.B., Cossrow, N., Mehta, V., Liu, V.,
Dubberke, E.R., 2017. Prediction of recurrent
Clostridium difficile infection using comprehensive
electronic medical records in an integrated healthcare
delivery system. Infect Control Hosp Epidemiol, 38
(10): 1196-1203.
Hartvigsen, T., Sen, C., Brownell, S., Teeple, E., Kong, X.,
and Rundensteiner, E., 2018. Early prediction of MRSA
infections using electronic health records. Proc.
HEALTHINF, Madeira, Portugal.
Shaughnessy, M.K., Micielli, R.L., DePestel, D.D., Arndt,
J., Strachan, C.L., Welch, K.B., and Chenoweth, C.E.,
2011. Evaluation of hospital room assignment and
acquisition of Clostridium difficile infection. Infect
Control Hosp Epidemiol, 32 (3): 201-206.
Clinical Performance Evaluation of a Machine Learning System for Predicting Hospital-Acquired Clostridium Difficile Infection
663
