
Air Quality and Cause-specific Mortality in the United States:
Association Analysis by Regression and CCA for 1980-2014
Erin Teeple
1
, Caitlin Kuhlman
2
, Brandon Werner
1
, Randy Paffenroth
1,2,3
and Elke Rundensteiner
1,2
1
Data Science Program, Worcester Polytechnic Institute, Worcester, MA, U.S.A.
2
Department of Computer Science, Worcester Polytechnic Institute, Worcester, MA, U.S.A.
3
Department of Mathematics, Worcester Polytechnic Institute, Worcester, MA, U.S.A.
Keywords: Air Quality, Canonical Correlation Analysis, CCA, Epidemiology, Environmental Health.
Abstract: Quantifying health effects resulting from environmental exposures is a complex task. Underestimation of
exposure-outcome associations may occur due to factors such as data quality, jointly distributed spectra of
possible effects, and uncertainty about exposure levels. Parametric methods are commonly used in population
health research because parameter estimates, rather than predictive accuracy, are useful for informing
regulatory policies. This project considers complementary approaches for capturing population-level
exposure-outcome associations: multiple linear regression and canonical correlation analysis (CCA). We
apply these methods for the task of characterizing relationships between air quality and cause-specific
mortality. We first create a national air pollution exposures-mortality outcomes data set by integrating United
States Environmental Protection Agency (EPA) annual summary county-level air quality measurements for
the period 1980-2014 with age-adjusted gender- and cause-specific county mortality rates from the same time
period published by the Institute for Health Metrics and Evaluation (IHME). Code for data integration is made
publicly available. We examine our model parameter estimates together with air quality-mortality rate
associations, revealing statistically significant correlations between air quality variations and variations in
cause-specific mortality which are particularly apparent when CCA is applied to our population health data
set.
1 INTRODUCTION
A significant challenge in assessing the impact of
environmental factors on health outcomes is that
many health outcomes are not deterministic and have
multiple contributing risk factors related not only to
the exposures being studied, but also to other
unrelated and unmeasured factors (Vineis & Kriebel,
2006). In this work, we investigate this phenomenon
with regards to the potential impact of air pollution
exposures on mortality rates. The task of estimating
the potential contributions of air quality to varying
mortality causes is challenging because over time and
space, not all individuals will have the same
underlying risk for different causes of death or the
same susceptibility to the effects of an exposure such
as air pollution.
For example, risk of death from respiratory or
cardiovascular disease may be influenced not only by
the quality of the air in a particular location, but also
by an individual’s long-term health, which is
impacted by factors such as activity level, blood
pressure, and diet, as well as by short-term health
events such as respiratory infections, among other
considerations (Vineis et al., 2006; Cromar, Gladson,
& Ewart, 2019).
Additionally, we may also find that multiple
interrelated outcomes can occur from a similar
mechanism. An example of this would be the
occurrence of a heart attack or stroke as a
manifestation of vascular disease, or in the
occurrence of a fatal cardiac event due to respiratory
stress. As we will demonstrate in the analyses
presented in this paper, these complex, non-
deterministic, and overlapping relationships between
our predictor and outcome variable sets have the
potential to present as more strongly correlated latent
relationships with air pollution variability through the
covariance of different mortality rates, rather than in
the form of parametric effect estimates, as can be
obtained using linear regression models which predict
single mortality rates from air quality measures.
228
Teeple, E., Kuhlman, C., Werner, B., Paffenroth, R. and Rundensteiner, E.
Air Quality and Cause-specific Mortality in the United States: Association Analysis by Regression and CCA for 1980-2014.
DOI: 10.5220/0009156702280236
In Proceedings of the 13th International Joint Conference on Biomedical Engineering Systems and Technologies (BIOSTEC 2020) - Volume 5: HEALTHINF, pages 228-236
ISBN: 978-989-758-398-8; ISSN: 2184-4305
Copyright
c
2022 by SCITEPRESS – Science and Technology Publications, Lda. All rights reserved

1.1 Motivation
The United States Clean Air Act §7401 et seq. (1970)
is a federal law that was first passed in 1970 and
amended in 1977 and 1990. The Clean Air Act
requires the United States Environmental Protection
Agency (EPA) to set National Ambient Air Quality
Standards (NAAQS) for six air pollutants termed
“criteria air pollutants”: ground-level ozone,
particulate matter, carbon monoxide, lead, sulfur
dioxide, and nitrogen dioxide. Air pollution exposure
has been linked in numerous studies with increased
risk for adverse health events, including cardiac events
and strokes (Di, Wang, Zanobetti, et al., 2017; Shah,
Lee, McAllister, et al. 2015; Han, Lim, Yorifuji, &
Hong, 2018; Peng, Xiao, Gao, et al., 2019; India State-
Level Disease Burden Initiative Air Pollution
Collaborators, 2019; Wang, Zhao, Liou, et al., 2019).
In addition, negative health impacts have been found
to be associated with air pollution exposure even at
levels below current United States federal regulatory
limits. For example, in one study of a Medicare
beneficiary population, increased all-cause mortality
was found to be associated with higher levels of small-
diameter particulate and ozone air pollution exposure
that were within federal exposure limits (Di et al.,
2017).
Since air pollution exposure may impact morbidity
and mortality risk across multiple organ systems, it
becomes challenging to evaluate and quantify the
effects of air pollution exposure on population health,
since each possible outcome has other unique risk
factors and rates of occurrence apart from the effects
of air pollution exposure. Nonetheless, such dose-
response and predictive models are necessary for
evaluating and informing policies that regulate and
update air pollution exposure limits. One approach for
modelling cause and effect relationships is the use of
multiple linear regression, which estimates a response
quantity from a set of predictor variables (James,
Witten, Hastie & Tibshirani, 2014). When assessing
the impacts of different environmental exposures on
multiple health target outcomes with the use of
regression models, however, we may underestimate
associations between environmental factors and
multiple interrelated outcomes by examining each
individually, rather than considering the total variation
in the outcomes of interest relative to exposure
variables.
1.2 Proposed Approach
Illustrating this point, in this paper we first examine
relationships among interrelated air pollution
exposure measures and cause-specific mortality rates
as single rates, using multiple linear regression. We
then explore the relationship between variations in air
quality and variations in health outcomes by applying
Canonical Correlation Analysis (CCA), which finds
combinations of predictor and outcome set elements
which are maximally correlated with each other,
thereby permitting quantification and hypothesis
testing about the presence of latent intercorrelations
accounting for covariations across and between
variable sets (Hotelling, 1936; Gonzalez, Dejean,
Martin & Baccini, 2008). CCA is performed in this
study by taking year and air quality measures as
elements of one intercorrelated variable set and
mortality rates for male and female all-cause,
cardiovascular, respiratory, and infectious disease
mortality as elements of a second intercorrelated
variable set.
Application of CCA to these matched data sets
then produces independent, linear combinations of set
variables which are maximally correlated in sequential
independent projection spaces. These independent
correlated projections of the data are termed canonical
dimensions, and the existence of a statistically
significant correlation within a given canonical
dimension may be interpreted as there being a latent,
unmeasured (canonical) factor accounting for the
observed covariation relationship between the two sets
of variables. Using the approaches of linear regression
and CCA together gives us complementary
perspectives on our phenomena of interest: from linear
regression, the proportion of variation in each
mortality rate explained by a multiple linear regression
model using year and air quality measures as
predictors, and from CCA, the degree to which
county-specific variations in cause-specific mortality
may be associated with air quality variations.
1.3 Key Contributions
We create and publicly release a novel national
county-level air pollution exposure - mortality
outcome data set which integrates EPA air quality
measurements with county-level mortality data from
the Institute for Health Metrics and Evaluation
(IHME). Our approach uses federal county identifiers,
permitting easy integration with other geographically
coded data sets.
We quantify nationwide associations between
cause-specific mortality rates and air quality measures
in the United States over a 34-year time period.
We compare the performance of CCA and
regression for characterizing statistical relationships
among our data attributes, showing that variations in
Air Quality and Cause-specific Mortality in the United States: Association Analysis by Regression and CCA for 1980-2014
229

air quality have a strong and statistically significant
correlation with mortality rate variations.
Our findings have important public health
implications: we find associations between lower air
quality and increased rates of specific mortality causes
even within United States regulatory limits for air
quality.
We highlight further applications of our approach
for other questions in environmental epidemiology
and public health research.
2 RELATED WORK
Regression models are commonly used to examine
associations between air pollution of different types
and specific health outcomes (Di et al., 2017; Shah et
al. 2015; Han et al., 2018; Peng et al., 2019; India
State-Level Disease Burden Initiative Air Pollution
Collaborators, 2019; Wang et al., 2019). Findings
reported in such studies commonly include estimates
of excess mortality resulting from air pollution
exposures of different types and levels, as well as
parametric estimates of the contributions of specific
types of air pollution to different outcomes. To date,
numerous studies have reported impacts of air quality
on multiple health outcomes. A challenge for these
studies, however, is that since there exists evidence
that air pollution exposure adversely effects multiple
interdependent organ systems, any single health
outcome will be insufficient for fully quantifying the
impact of air pollution exposure on the overall health
of a study population.
CCA thus has the potential to add to the insights
provided by these previous studies as a result of its
being specifically suited for the situation where we
have multiple intercorrelated exposure measures and
multiple interrelated health effects (Hotelling, 1936;
Gonzalez et al., 2008). A further strength of applying
CCA for questions in population-level epidemiology
is that rather than assuming independence of
predictors or applying domain knowledge to engineer
interaction terms (as is commonly done in regression
analysis), unmeasured phenomena which impact
multiple variables and create intercorrelations may be
uncovered in the model as statistically significant
high-magnitude cross-set correlations between
projections of the data sets in the canonical
dimensions (Hotelling, 1936; Gonzalez et al., 2008).
Canonical correlation analysis (CCA) was first
described by Hotelling in 1936. CCA is used to
examine latent (canonical) relationships between
multi-dimensional vectors X = (x
1
, x
2
, …x
n
) and Y =
(y
1
,y
2
, …y
n
) which have non-zero Pearson
correlations (ρ) among variables such that ρ(x
i
, x
j
),
ρ(y
q
, y
r
), ρ(x
k
, y
p
) are non-zero for some variables.
Existence of such non-zero intercorrelations implies
that linear combinations of variables in the two sets
may be predictable by or predictive of the others. CCA
seeks to find linear combinations of X and Y with
maximal correlations with each other. In effect, these
linear combinations may be used to examine and
characterize possible latent relationships between
multidimensional X and Y domains, with correlations
between X and Y sets in the canonical dimensions
taken to represent latent factors accounting for
correlated set covariations (Hotelling, 1936; Gonzalez
et al., 2008).
In recent years, CCA has found further extensions
in kernel (Rudzicz, 2010) and deep (Andrew, Arora,
Bilmes & Livescu, 2013) CCA methods. In kernel
CCA, data sets are projected into high-dimensional
kernel space before CCA is performed, with the use of
a kernel permitting non-linear representations of the
data sets being correlated. Challenges in kernel and
deep CCA, however, include appropriate kernel
selection, difficulty when trying to interpret projection
relationships, and avoiding overfitting. As kernel and
deep CCA methods are further developed, future work
focusing on interpretability of canonical projections
may find use in epidemiology applications, as
demonstrated here for linear CCA, which relies upon
the interpretability of the canonical coefficients to
validate our interpretations of the results of an
analysis.
3 METHODS AND PROCEDURES
3.1 Data Sources
Data sources for this study were selected to provide
county-level information on air pollution exposure
and cause-specific mortality linked by a shared key,
which in this case are the United States county
identifier and the year of data collection.
Air Quality Data: AirData (United States
Environmental Protection Agency [EPA]) is a website
maintained by the EPA that provides public access to
air quality measurements collected at more than 4,000
outdoor monitors across the United States, Puerto
Rico, and the United States Virgin Islands. AirData
has available for download annual and daily summary
data tables containing measurements of overall
summary measures of ambient air quality, regulated
pollutants, particulates, meteorological conditions
(wind, temperature, pressure, barometric pressure, and
RH/dewpoint), toxics, ozone precursors, and lead
HEALTHINF 2020 - 13th International Conference on Health Informatics
230
measurements. For this analysis, we downloaded the
‘Annual Summary’ tables.
Mortality Data: United States county-level age-
standardized respiratory mortality rates for the years
1980-2014 are available through the IHME (Institute
for Health Metrics and Evaluation [IHME]). The
IHME produced estimates for United States county-
level mortality rates for 21 causes of death including
chronic respiratory diseases for the period 1980-2014
(IHME). This aggregated data set is available through
the Global Health Data Exchange. Age-standardized
mortality rates for male, female, and combined
genders are reported as the number of deaths per
100,000 people in the population. These estimates
were generated using death records from the National
Center for Health Statistics (NCHS); population
counts from the U.S. Census Bureau, NCHS, and the
Human Mortality Database; and the
cause list from the
Global Burden of Disease Study (GBD).
3.2 Analysis and Methodology
Data Preprocessing and Integration: Data pre-
processing and table joins were implemented in
Python, version 3.6, yielding a single .csv file
containing 31,019 data rows uniquely identified by
county location and year and for which mortality rate
and air quality measurement information was
available. From the EPA data, we extract the
following measures for each county and year: median
annual Air Quality Index (AQI) (AQI is summary
measurement of air quality, with scores ranging from
0-500); maximum annual AQI; the proportion of
recorded days on which AQI fell into each of the
following categories: Good (0-50), Moderate (51-
100), Unhealthy for Sensitive Groups (101-150),
Unhealthy (151-200), Very Unhealthy (201-300), and
Hazardous (301-500); and the proportion of days on
which the AQI was attributed to one of the following
pollutants: Carbon Monoxide (CO), Nitrogen Dioxide
(NO2), Ozone, Particulate Matter (PM10), and Sulfur
Dioxide (SO2).
In our analyses, we use this set of air quality
features to understand and predict eight annual,
county-specific mortality targets extracted from the
IHME data set: male and female age-adjusted
mortality rates for the following causes: All (ALL),
Respiratory disorders (RESP), Cardiovascular
diseases (CVD), and Lower respiratory and other
common infectious diseases (INF). These causes of
mortality were selected for inclusion based on
previous studies linking air pollution exposure with
systemic inflammation and adverse effects on the
cardiovascular and respiratory systems (Di, Wang,
Zanobetti, et al., 2017; Shah, Lee, McAllister, et al.
2015; Han, Lim, Yorifuji, & Hong 2018; Peng, Xiao,
Gao et al., 2019; India State-Level Disease Burden
Initiative Air Pollution Collaborators, 2019; Wang,
Zhao, Liou et al., 2019). We included all data rows for
which both air quality and mortality values were
available. Our complete data analysis and code can be
found here (https://github.com/erinteeple/CCA_air).
Exploratory Data Analysis: To explore simple
pairwise linear relationships between the attributes in
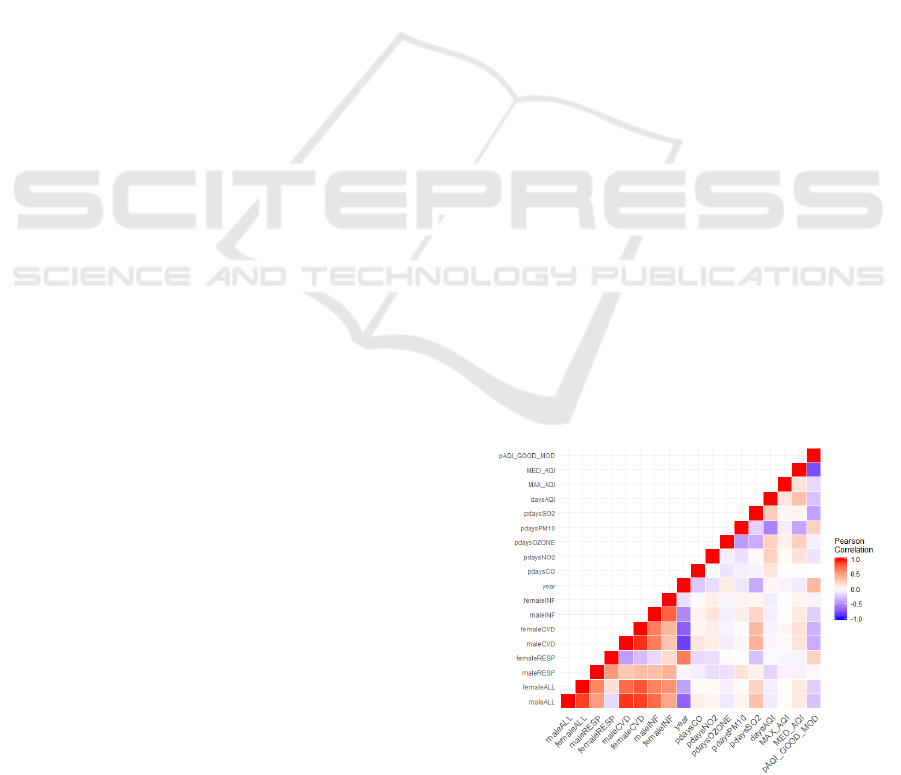
our dataset, we present Pearson correlations. Figure 1
demonstrates the existence of linear correlations
among and between air quality measures and mortality
rates. Given these multiple intercorrelations between
and within sets (Figure 1), we see that CCA is
appropriate for our analysis. We have intercorrelated
measures of air pollution exposures, intercorrelated
mortality rate measures, and cross-correlations
between elements of the two sets. Initial data
exploration also included characterizing temporal
trends in the mortality and air quality variables. Figure
2 shows generally linear trends for mean mortality by
cause and year and substantial variations in rates
within years for different locations. Mean mortality by
cause was observed to differ for males and females,
thus we chose to keep these rates separated in our
analyses (Figure 2). With respect to our air pollution
exposure measurements, several important
considerations need to be taken into account. First,
some subgroups of variables could not be used
together in regression models due to frank violations
of assumptions of predictor independence. To address
these issues, first, the proportions of days in each of
the AQI rating categories were combined into a single
measure, which is the proportion of days on which the
AQI was in the good or moderate air quality
categories.
Intuitively and as can be seen in Figure 1,
Figure 1: Pearson correlations for mortality rates and air
quality exposure measures.
Air Quality and Cause-specific Mortality in the United States: Association Analysis by Regression and CCA for 1980-2014
231

Figure 2: Box plots showing variations in age-standardized
mortality rates per 100,000 persons for time period 1980-
2014 by gender and cause: M: male; F: female; ALL: all
causes; RESP: respiratory; CVD: cardiovascular; INF:
infectious disease.
median AQI, maximum AQI, and proportion of days
on which AQI was good or moderate are interrelated
and therefore cannot be used together, thus, separate
linear regression models were generated for each of
these AQI summary measures and compared. An
additional consideration regarding the formatting of
the air quality summary data is that the proportions of
specific pollutants reflect only the proportion of the
days on which the maximal AQI is attributed to a
maximal type of air pollution – this means that (1) air
pollutants present at other levels are not captured by
this measure and so we have no measure of co-
exposures and (2) the magnitude of exposure to a
given pollutant is not captured by this proportion, only
that the pollutant was at a level accounting for the
recorded AQI. We therefore chose to include
interaction terms between AQI summary measures
and pollutant proportion terms in our multiple linear
regression models in order to assess the scaled
contributions of different pollutants. Multiple linear
regression and CCA were performed in R and Python
(Gonzalez et al., 2008; Pedregosa et al., 2011).
Multiple Linear Regression Analysis: Multiple
linear regression is a multivariate statistical method in
which we examine linear correlations between a
dependent variable and one or more independent
variables (James et al., 2014). Multiple linear
regression analysis produces statistical outputs
including coefficient estimates for each predictor,
which estimate the magnitude and direction of that
predictor’s contribution to the dependent variable
value in the model and confidence intervals for each
coefficient, which indicate a probability-based range
of values for these coefficients. The ability of a
multiple linear regression model to explain variation
in the dependent variable using the independent
variables may be also be quantified using the adjusted
R-squared value for the regression. The adjusted R-
squared value may be interpreted as quantifying the
proportion of variation in the dependent variable
explained by the independent variables in the linear
regression model.
Canonical Correlation Analysis: As an analysis
method, the formulation of CCA is as follows for a
data matrix M comprised of attribute sets X and Y, for
which and measurements are available,
respectively, for each of N observations.
X
|
Y
X∶N∗
Y
∶N∗
(1)
CCA then seeks independent, linear combinations
of the X and Y set variables
and
which
maximize ,:
(2)
(3)
,
,
(4)
Given that environmental exposures rarely occur
in isolation and may have effects on multiple organ
systems at varying rates (Vineis et al., 2006), CCA
then is suited for such applications in the study of
relationships between environmental factors and
population health outcomes, particularly, as is
commonly the case, where baseline rates for these
outcomes are expected to vary with time and spatial
location and where the true rates are not themselves
known. In this study, we compare linear regression
with CCA, where mortality rates stratified by cause
and gender serve as a multidimensional intercorrelated
HEALTHINF 2020 - 13th International Conference on Health Informatics
232
response vector set to be cross correlated with
intercorrelated pollution exposure measures to
determine if this approach uncovers correlated
covariance between these variable sets. We compare
the results of our analysis with the proportion of
variance in the individual mortality rates explained
using multiple linear regression. In addition, in CCA
we also examine the weight vectors assigned for the
attributes in the two variable sets relative to their
contributions to each sequential canonical projection.
The interpretation of the variable weights in CCA
differs notably from parametric estimates in multiple
linear regression in that for a multiple linear regression
model, a coefficient would be taken to represent the
linear contribution of a variable to a specific
dependent/target value in the regression model. In
contrast, the variable weights assigned in CCA apply
in sequential canonical dimensions. These weights are
taken to reflect the importance and relative direction of
each set element’s contribution to each dimension-
specific correlation relationship. Examination of these
canonical weightings provides insight into the relative
contribution of each variable in the sets relative to the
latent relationship captured by the correlated
projection, and these weightings are most informative
when examined relative to weightings of the variables
in the other set. These correlated projections produced
by the set variable weightings may then be interpreted
as reflecting the influence of potential latent factors
captured in each of the canonical projections of the
paired data sets.
4 RESULTS
4.1 Multiple Linear Regression
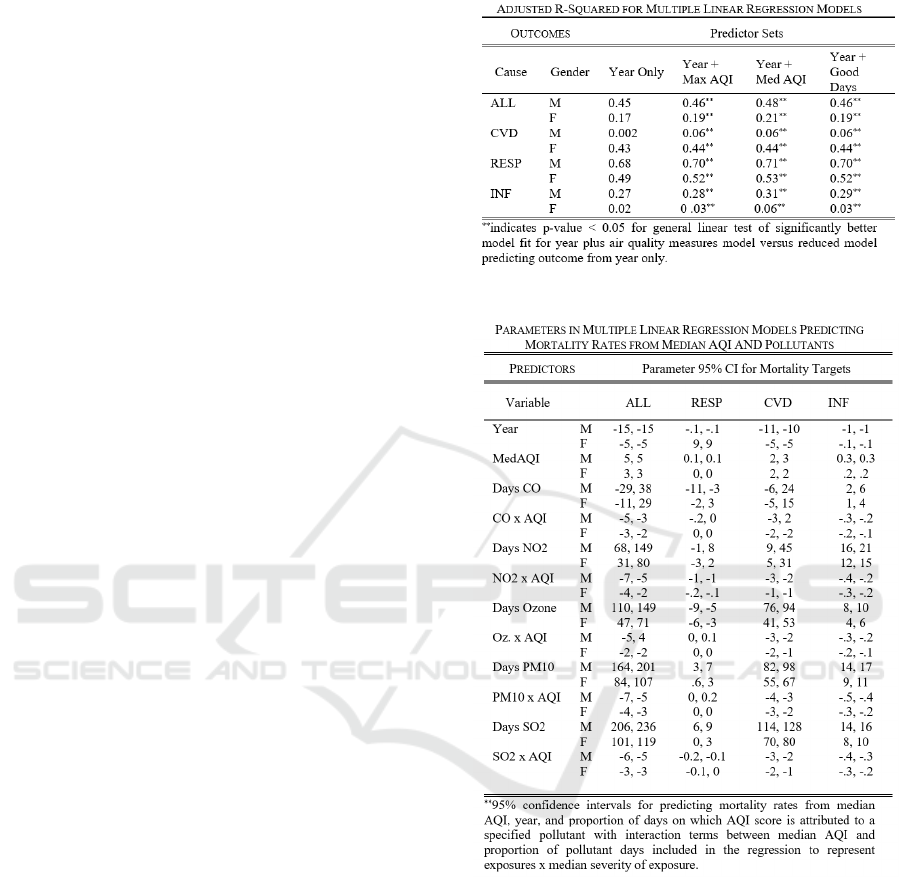
Table 1 presents adjusted R-squared values for
regression models predicting annual mortality i) from
year only and ii) from year plus air quality measures,
including interaction terms between proportions of
days on which the leading pollutant was of a specific
type. Using the general linear test (Kutner, Nachstein,
Neter & Li, 2004) to compare these models, we
observe that significantly greater proportions of
variation for all mortality rates are explained by linear
regression models including year along with air quality
measures, consistent with research reporting diverse
multi-system health impacts (Table 1). Confidence
intervals for the air quality measure coefficients are
presented in Table 2. Of note, the coefficient intervals
for some air pollution variables include 0 (no effect),
and some coefficient estimates are negative. For
example, surprisingly, ozone has a negative coefficient
Table 1: Mortality rate prediction.
Table 2: Linear model coefficient estimates.
interval for female respiratory mortality, but this
should be interpreted in the context of overall
population-level trends in female respiratory mortality
(Figure 2, F-RESP), as well as consideration of the
other variables in the regression.
It is also worth noting that proportion of variation
explained by the multiple linear regression models is
more suitable in this case for comparing models than
is mean-squared error, as we conduct these analyses
without knowing what variability exists in our targets
due to causes other than air quality and our target rates
are expected to differ in their distributions.
Air Quality and Cause-specific Mortality in the United States: Association Analysis by Regression and CCA for 1980-2014
233
4.2 Canonical Correlation Analysis
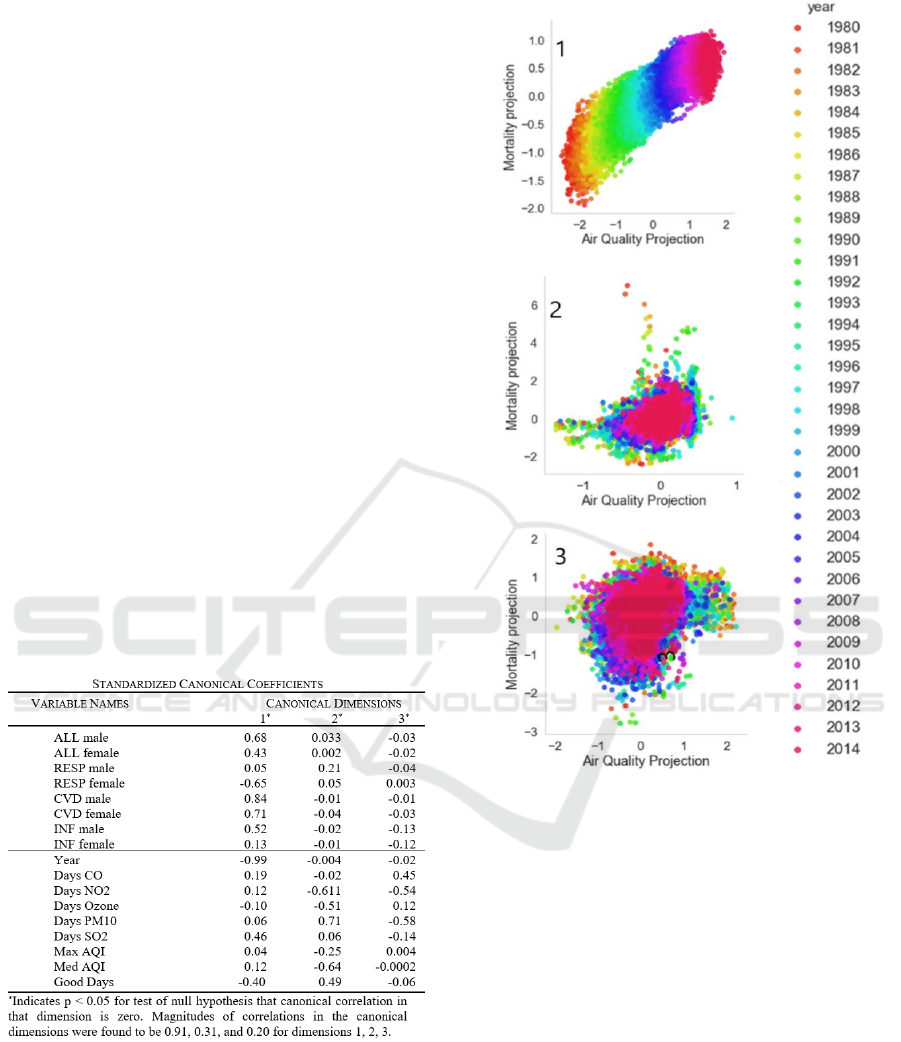
The results of canonical correlation analysis applied to
our data set are presented in Table 3. By CCA, in the
first canonical dimension, we observe a correlation of
0.91 between the set of mortality rates and the set of
air quality variables which is found to be statistically
significantly different from 0 (null hypothesis for
testing). As can be seen in Table 3, in this first
canonical dimension, we observe positive weights
assigned to multiple adverse air quality measures,
positive weights assigned to mortality rates of multiple
causes, and a negative weight (protective effect)
assigned to the proportion of days on which the AQI
was rated as good or moderate.
These CCA results quantify a strong linear
correlation between air quality variations and
mortality rate covariations due to a latent factor, which
in this case we propose may be the biological
relationship between air pollution exposure and its
effects on human body system health and functions.
While in the linear regression model, we aimed to
estimate parametric contributions of measures of air
quality on the mortality rates of interest, by utilizing
CCA, we expand our concept of linear association to
capture the effects of the environmental exposure on
paired set covariation.
Table 3: CCA coefficient estimates.
5 DISCUSSION
We find in this analysis a strong and statistically
significant first-dimension canonical correlation
between variations in air pollution exposure and
variations in cause-specific mortality in the United
States during the years 1980-2014. These results
Figure 3: Air Quality and Mortality Variable Set
Correlations in the first three canonical dimensions. Note
the high linear correlation (0.91) in the first canonical
dimension, which also stratifies data by year (color).
complement our findings in linear regression analysis,
where we observe statistically significantly better
model fit in our models which include air quality
measures compared to a model which predicts
mortality rates from year alone.
Interestingly, We Observe These Relationships
between Air Pollution Exposures and Mortality of
Different Causes even at Air Pollution Levels that
are Subject to United States Federal Regulatory
Limits. In the case of air pollution, there exists other
research linking airborne exposures with health
outcomes of different types (Di et al., 2017; Shah et al.
2015; Han et al., 2018; Peng et al., 2019; India State-
Level Disease Burden Initiative Air Pollution
Collaborators, 2019; Wang et al., 2019). The results
of this analysis demonstrate the utility of CCA
HEALTHINF 2020 - 13th International Conference on Health Informatics
234

alongside regression for examination of the possible
effects of environmental exposures on health outcome
distributions, which in the absence of knowledge of
the intrinsic rates of these effects allows for the
quantification of a stronger association and
identification of possible harm to human health.
Implications for Future Population-level Outcome-
Exposure Analysis: This success of CCA for
specifically capturing the relationships between
exposure and outcome covariations has further
applications for approaching problems where a link
between environmental factors and possible health
effects is only hypothesized. CCA has other useful
potential applications in such investigations which
seek to determine the relative contributions of
environmental factors or other proposed risk factors to
shifts in distributions of multi-class outcomes, for
example variations in rates of cancers of different
kinds relative to different complex background
exposure levels.
An advantage of this approach is that we do not
require a priori knowledge of outcome distributions or
background risk levels. As evidenced particularly by
the strong and significant correlation in the first
canonical dimension in our CCA analysis, we see that
CCA quantifies a link between covariations in the data
sets, and the interpretation of this link can be
considered against the relative weights assigned to
each of the set elements in the canonical projections
(Hotelling, 1936; Gonzalez et al., 2008). Given that
environmental exposures rarely occur in isolation and
may have effects on multiple organ systems, CCA is
therefore uniquely suited for applications where we
aim to explore whether covariation relationships
between multi-dimensional environmental factors and
interrelated population health outcomes are present.
Future work advancing CCA applications in
environmental epidemiology may take into
consideration not only the formulation of maximally
correlated projections beyond those produced through
linear CCA methods but also preservation of
interpretability of the latent weightings, in order to
permit assessment and characterization of latent factor
relationships in kernel and deep CCA formulations or
the identification of locations which map to similar
positions within the latent projections as regions of
interest for further study.
6 CONCLUSIONS
In this work, we explore the potential of CCA for
population-level environmental epidemiology by
demonstrating its use for understanding the impact of
air pollution on mortality. Our analysis demonstrates
the complementarity of CCA for use alongside
traditional multiple linear regression approaches and
the promise of this method for extension to
investigating other hypothesized exposure outcome
data set relationships.
ACKNOWLEDGEMENTS
We thank the DSRG and Data Science Community
at WPI for their support and feedback.
REFERENCES
Vineis, P., Kriebel, D., 2006. Causal models in
epidemiology: past inheritance and genetic future.
Environmental Health: A Global Access Science
Source, 5:21.
Cromar K.R., Gladson, L.A., Ewart, G., 2019. Trends in
Excess Morbidity and Mortality Associated with Air
Pollution above American Thoracic Society-
Recommended Standards, 2008-2017. Annals ATS, Vol
16 (7): 836-845.
United States Clean Air Act: 42 United States Code §7401
et seq. (1970).
Di, Q., Wang, Y., Zanobetti, A., et al., 2017. Air pollution
and mortality in the Medicare population. NEJM, 26:
376.
Shah, A., Lee, K., McAllister, D., et al., 2015. Short term
exposure to air pollution and stroke: systematic review
and meta-analysis. BMJ, 24: 350.
Han, C., Lim, Y.H., Yorifuji, T., Hong, Y.C., 2018. Air
quality management policy and reduced mortality rates
in Seoul Metropolitan Area: A quasi-experimental
study. Environ Int. 121(Pt 1): 600-609.
Peng, L., Xiao, S., Gao, W., Zhou, Y., Zhou, J. Yang D.,
Ye, X., 2019. Short-term associations between size-
fractionated particulate air pollution and COPD
mortality in Shanghai, China. Environ Pollut. Epub.
India State-Level Disease Burden Initiative Air Pollution
Collaborators, 2019. The impact of air pollution on
deaths, disease burden, and life expectancy across the
states of India: the global burden of disease study 2017.
Lancet Planet Health 3(1): e26-e39.
Wang, T., Zhao, B., Liou, K.N., Gu, Y., Jiang, Z., Song, K.,
Su, H., Jerrett, M., Zhu Y., 2019. Mortality burdens in
California due to air pollution attributable to local and
nonlocal emissions. Environ Int, 133(Pt B):105232.
James, G., Witten, D., Hastie, T., Tibshirani, R.. An
Introduction to Statistical Learning with Applications
in R. Springer 2014. ISBN:1461471370
9781461471370.
Hotelling, H., 1936. Relations between two sets of variates.
Biometrika, 28 (3-4):321-377.
Air Quality and Cause-specific Mortality in the United States: Association Analysis by Regression and CCA for 1980-2014
235

Gonzalez, I., Dejean, S., Martin, P., Baccini, A., 2008.
CCA: An R package to extend canonical correlation
analysis. J Stat Software, 23(12).
Rudzicz, F., 2010. Adaptive Kernel Canonical Correlation
Analysis for Estimation of Task Dynamics from
Acoustics. Proceedings of the IEEE International
Conference on Acoustics, Speech, and Signal
Processing, ICASSP. https://www.researchgate.net/pub
lication/220736292_Adaptive_Kernel_Canonical_Cor
relation_Analysis_for_Estimation_of_Task_Dynamics
_from_Acoustics
Andrew, G., Arora, R., Bilmes, J., Livescu, K., 2013. Deep
Canonical Correlation Analysis. Proceedings of the
30th International Conference on Machine Learning.
https://ttic.uchicago.edu/~klivescu/papers/andrew_icm
l2013.pdf
United States Environmental Protection Agency, County
Monitor Annual Summary Files, https://aqs.epa.gov/
aqsweb/airdata/download_files.html
United States Combined and Gender-Specific Age-Adjusted
Mortality Rates by United States County, Institute for
Health Metrics and Evaluation, http://ghdx.healthdata.
org/record/united-states-mortality-rates-county-1980-
2014
Pedregosa, F., et al., 2011. Scikit-learn: Machine Learning
in Python, JMLR, 12:2825-2830.
Kutner, M., Nachstein, C., Neter, J., Li, W., 2004. Applied
Linear Statistical Models 5
th
Edition. McGraw-
Hill/Irwin. ISBN: 007310874X 978-0073108742.
HEALTHINF 2020 - 13th International Conference on Health Informatics
236
