
Pectoral Muscle Segmentation in Tomosynthesis Images using Geometry
Information and Grey Wolf Optimizer
Mohamed Abdel-Nasser
1,2 a
, Francesc Porta Solsona
1
and Domenec Puig
1 b
1
Computer Engineering and Mathematics Department, University Rovira i Virgili, Tarragona, Spain
2
Electrical Engineering Department, Aswan University, Aswan, Egypt
Keywords:
Tomosynthesis, Breast Cancer, Pectoral Muscle, CAD Systems.
Abstract:
Digital breast tomosynthesis (DBT) is quickly replacing full-field digital mammography because it allows
a more efficient breast cancer diagnostic workflow and yields a more confident interpretation. The visual
characteristics of the pectoral muscle on mediolateral oblique (MLO) views may increase the false positive rate
in computer-aided diagnosis systems. Therefore, the pectoral muscle should be extracted from MLO images
before further analysis. Notably, most pectoral muscle segmentation method has a fixed parameter setting
that may yield good results with some images and fail with others due to the variations in breast density. In
this paper, we propose a promising method to segment pectoral muscles from tomosynthesis images based on
geometric information of the pectoral muscle and a meta-heuristic optimization algorithm. Concretely, our
method involves four steps: 1) a preprocessing step, 2) obtaining of geometric information of pectoral muscle,
3) selection of pectoral muscle pixels, and 4) finding the optimal parameters using the grey wolf optimizer
(GWO). The GWO optimizer gets different parameters for each input image as they depend on the visual
characteristics of the images (i.e., breast density). With each input image, the GWO optimizer determines
different values of the parameters because they rely on the visual characteristics of tomosynthesis images that
are highly related to breast density. The proposed method is evaluated with a set of tomosynthesis images
obtaining a Dice score of 0.823 and an IoU score of 0.726.
1 INTRODUCTION
Breast cancer is one of the common cancers occur-
ring in women. Statistics reveal that the number of
predicted deaths due to breast cancer in the European
Union for the year 2019 is 92800 (Malvezzi et al.,
2019). However, there is evidence that early diagno-
sis and treatment of breast cancer can significantly
raise the probability of survival (Lee et al., 2010).
Mammography (X-ray images of the breast) is, un-
til now, the most useful tool for global population
screening. However, the precise detection and diag-
nosis of a breast tumor completely based on mam-
mography findings is hard and really depends on the
expertise of the radiologist, which may yield a high
number of false positives and extra screenings and ex-
aminations (Hubbard et al., 2011). Computer-aided
detection and diagnosis (CAD) systems are already
being adopted to help radiologists in the decision-
making process (Abdel-Nasser et al., 2016a; Abdel-
Nasser et al., 2016b). Such systems may highly de-
a
https://orcid.org/0000-0002-1074-2441
b
https://orcid.org/0000-0002-0562-4205
crease the amount of effort necessitated for the eval-
uation of a lesion in clinical practice while decreas-
ing the number of false positives that may yield unde-
sirable biopsies. Nowadays, digital breast tomosyn-
thesis (DBT) is speedily succeeding in full-field digi-
tal mammography because it enables a more effective
breast cancer diagnostic and produces a more trusting
interpretation.
Breast masses are seen as white regions in mam-
mograms. Hence CAD systems encounter difficulty
when analyzing these images in the mediolateral
oblique (MLO) view due to the appearance of the pec-
toral muscle, which has an appearance similar to the
pixels of the breast region that increases the false pos-
itive rate in CAD systems. Therefore, the pectoral
muscle should be removed from the breast region in
MLO images before additional analysis. The higher
number of images that need to be reviewed encoun-
ters a challenge for segmenting the pectoral muscle
manually (a time-consuming task). One of the main
steps of these CAD systems is the automated removal
of pectoral muscle from mammograms and tomosyn-
thesis images and leaving the breast region only.
It worth remarking that DBT images contain the
Abdel-Nasser, M., Solsona, F. and Puig, D.
Pectoral Muscle Segmentation in Tomosynthesis Images using Geometry Information and Grey Wolf Optimizer.
DOI: 10.5220/0009156408290836
In Proceedings of the 15th International Joint Conference on Computer Vision, Imaging and Computer Graphics Theory and Applications (VISIGRAPP 2020) - Volume 5: VISAPP, pages
829-836
ISBN: 978-989-758-402-2; ISSN: 2184-4321
Copyright
c
2022 by SCITEPRESS – Science and Technology Publications, Lda. All rights reserved
829

following kinds of pectoral muscles, namely, regu-
lar, convex, concave, and combinatorial. In the liter-
ature, numerous methods have been suggested to ex-
tract pectoral muscles. For example, in (Taghanaki
et al., 2017a), geometric rules with a region growing
algorithm are employed to segment pectoral muscles.
Few publicly available mammographic image anal-
ysis tools, such as LIBRA (Keller et al., 2015) and
OpenBreast (Pertuz et al., 2019), embrace the pectoral
muscle segmentation step.
Most pectoral muscle segmentation method set
a fixed parameter setting that may work with some
images and fail with others due to the variations in
the density of breasts. In this paper, we propose a
promising method to automatically segment pectoral
muscles from tomosynthesis images based on geo-
metric information of the breast and a meta-heuristic
optimization algorithm. Specifically, the proposed
method comprises the following four steps: 1) a pre-
processing step, 2) obtaining of geometric informa-
tion of pectoral muscle, 3) selection of pectoral mus-
cle pixels, and 4) finding the optimal parameters using
the grey wolf optimizer (GWO). The GWO algorithm
determines different parameters for each input image
as they depend on the visual characteristics of the im-
ages (i.e., breast density). With each input image, the
GWO optimizer determines different values of the pa-
rameters because they rely on the visual characteris-
tics of tomosynthesis images that are highly related to
breast density.
The remaining of this paper comprises the sub-
sequent sections. Section 2 presents related work.
Section 3 explains the proposed method. Section 4
presents the results. Section 5 summarizes the paper.
2 RELATED WORK
There are several pectoral muscle segmentation tech-
niques, such as thresholding methods, active contours
methods, K-means clustering methods, region grow-
ing methods, edge detection using Gabor filters meth-
ods, statistical region properties methods, and deep
learning-based methods. Each of these methods has
a different complexity that varies from highly sophis-
ticated to low complex. Below, we present examples
of these methods and explain how they address the
problem of segmenting pectoral muscle.
In (Sreedevi and Sherly, 2015) and (Unni et al.,
2018), a global threshold is used to estimate an initial
pectoral muscle boundary, and a morphology-based
boundary refinement algorithm is applied. The re-
sulting pectoral muscle region is then segmented by
a combination of global thresholding and connected
components methods. With a subset of 161 images
from the mini-MIAS mammographic images dataset,
(Sreedevi and Sherly, 2015) achieved an accuracy of
90.06% of based on visual observation of the correct-
ness of segmented images. The use of intensity only
for segmenting the pectoral muscle from the breast
region cannot produce a precise segmentation in most
cases. That happens because there is no significant
variation in texture and intensity between the pectoral
muscle tissue and the other tissues of the breast.
The authors of (Ergin et al., 2016) proposed a
region growing algorithm, in which he positions of
initial seeds for the pectoral muscle region are de-
termined based on the intensity of the region. As
the intensity cannot be effectively used for detecting
complex textures such as muscles, (Taghanaki et al.,
2017b) proposed to use a set of geometric rules and a
region growing method to segment pectoral muscles.
Using the MIAS and DDSM mammographic images
datasets, they achieved segmentation accuracy of 95%
and 94%, respectively. Based on the assumption that
pectoral muscles are near the chest wall on the upper-
right or the upper-left of mammographic images, the
authors of (Selvathi and Poornila, 2018) used only a
single seed for region growing algorithm. If the pec-
toral muscle is at right, they set the seed point into
the last 5th column in the input images; otherwise,
they set it set into (5th column of and 5th row). The
pectoral muscle boundary is then refined using mor-
phology operations.
Furthermore, line estimation methods are popular
pectoral muscle segmentation approaches, in which a
straight or a curve can represent the boundary of the
pectoral muscle. Hough transform is one of the most
popular line estimation method used for pectoral mus-
cle segmentation. Based on the Canny edge detector,
the authors of (Qayyum and Basit, 2016) proposed a
method for removing the pectoral muscle region from
mammograms. Firstly, a 3x3 median filter was used
to reduce the noise in input images. Then, they seg-
mented the initial pectoral muscle region by a com-
bination of the Canny edge detector and the inten-
sity of the region. The final pectoral muscle bound-
ary was determined using a straight-line estimation
method applied to the boundary. They achieved an ac-
curacy of 93% accuracy with the mini-MIAS dataset.
Besides, the authors of (Palkar and Agrawal, 2016)
proposed a straight-line estimation method for remov-
ing the pectoral muscle from mammograms based on
the fact that the pectoral muscle is at the upper-left
region of the breast. In the case of the original im-
ages in which the chest wall is not on the left side
of the image, they flipped them horizontally. Then,
the position of the middle-top pixel of the image was
VISAPP 2020 - 15th International Conference on Computer Vision Theory and Applications
830

computed and connected to the lowest-left pixel of the
rectangle approximating the pectoral muscle with the
straight-line connecting these pixels taken as the pec-
toral muscle boundary. Finally, the pectoral muscle
was segmented based on the approximated triangle
of the pectoral muscle boundaries. With the MIAS
dataset, they achieved an accuracy of 80%.
Shi et al. (Shi et al., 2018) used the four-class
K-means clustering method to segment the pectoral
muscles. First, they used a 5x5 median filter to reduce
the noise in the images and normalized the image in
order to enhance the contrast. Then, they clustered
the pixels and assigned the potential pectoral muscle
region candidate to the cluster with the highest inten-
sity. Next, they employed a Hough transform method
to extract the initial pectoral muscle boundary and re-
fined the final boundary by a polynomial curve fitting
method.
Pavan et al. (Pavan et al., 2019) used a Canny
method for extracting the initial pectoral muscle re-
gion based on rules dervided from the location of
pectoral muscle in mammograms. To accurately seg-
ment the pectoral muscles, they used a contour grow-
ing technique with seeds defined based on the ini-
tial pectoral muscle boundary. With a private dataset
(30 images), they achieved a mean Jaccard index of
0.92. Besides, Toz et al. (Toz and Erdogmus, 2018)
used neighborhood relations and geometrical proper-
ties for locating the pectoral muscle region. As the
pectoral muscle region often represented as a trian-
gle with high but homogeneous intensity, an initial
pectoral muscle region is determined using edge de-
tection at angles of 30
◦
–45
◦
. The resulting pectoral
muscle boundary was refined using a linear interpo-
lation method to fill any missing boundaries. With a
subset of 60 images from the INbreast dataset, they
achieved a mean sensitivity of 95.6%, a false positive
rate of 2.74%, and a false negative rate of 4.33%.
As shown above, almost all pectoral muscle seg-
mentation method has a fixed parameter setting that
may perform well with some images and fail with oth-
ers due to the variations in the density of breasts. To
address this point, in this paper, we propose the use of
a GWO optimizer to determine the optimal parame-
ters required for segmenting the pectoral muscle from
the input image. Notably, GWO determines the dif-
ferent parameters for each input image as they depend
on the visual characteristics of the images (i.e., breast
density).
3 PROPOSED ALGORITHM
The proposed method comprises the following steps:
1) a preprocessing step, 2) obtaining of geometric in-
formation of pectoral muscle, 3) selection of pectoral
muscle pixels and 4) finding the optimal parameters
using the GWO optimizer.
3.1 Preprocessing of Tomosynthesis
Images
The preprocessing stage of the proposed algorithm in-
cludes three main steps: removing the outliers, align-
ing the orientation of images, and determining the
view of the images.
S1) Removing the Outliers: Figure 1 demon-
strates that tomosynthesis images contain the breast
region as well as outliers (small objects that exist in
tomosynthesis images). To segment the breast region
from other objects existing in images, we create a bi-
nary mask from the original image using a threshold
of 100, select the most prominent object in it (which
will presumably be the breast region), and suppress all
other small objects. This produces a mask that will be
smoothed and applied to the original image to obtain
the breast region only. Note that this region will also
contain the pectoral muscle that exists in MLO views
only.
S2) Aligning the Orientation of Images: To-
mosynthesis images could be left-oriented (the chest
on the left side of the image) or right-oriented. Here
we work with left-oriented images. As depicted in
Figure 2, we create two 3x3 windows, one on the
left side and one on the right side of the image. The
one that has the greater mean of intensity values in-
dicates the orientation of the image. If the image is
right-oriented, the image and the mask of the breast
area will be flipped. Note that in the case of right-
oriented tomosynthesis images, the algorithm would
not be able to determine correctly whether the view
is craniocaudal (CC) or MLO, nor find the pectoral
muscle if there is any.
S3) Determining the View of the Images: To
check if the input image has CC or MLO view, we
use prior information about the shape of the breast.
In the case of CC views, the breast regions tend to
have a semi-circular shape, while in the case of MLO
views, the top part of the breast is almost has a ver-
tical line shape. As shown in Figure 3, we set two
points at the top part of the breast edge (p1 and p2),
and then we find the slope of the line that connects
p1 with p2. If this slope is close to the vertical line
slope, the view will be MLO. Differently, If this slope
is close to the horizontal line slope, the view will be
Pectoral Muscle Segmentation in Tomosynthesis Images using Geometry Information and Grey Wolf Optimizer
831

Figure 1: Preprocessing of tomosynthesis images. (a) original tomosynthesis image, (b) objects existing in the image, and (c)
segmented breast region.
Figure 2: Aligning the orientation of images. (a) a 3x3 Win-
dows, and (b) Flipped Image.
CC. Empirically, we set the slope limit to 45
o
. If the
slope is higher than the limit, the view will be MLO;
otherwise, CC. If the view is MLO, the next steps of
the proposed method will be carried out; differently,
and the algorithm will be terminated.
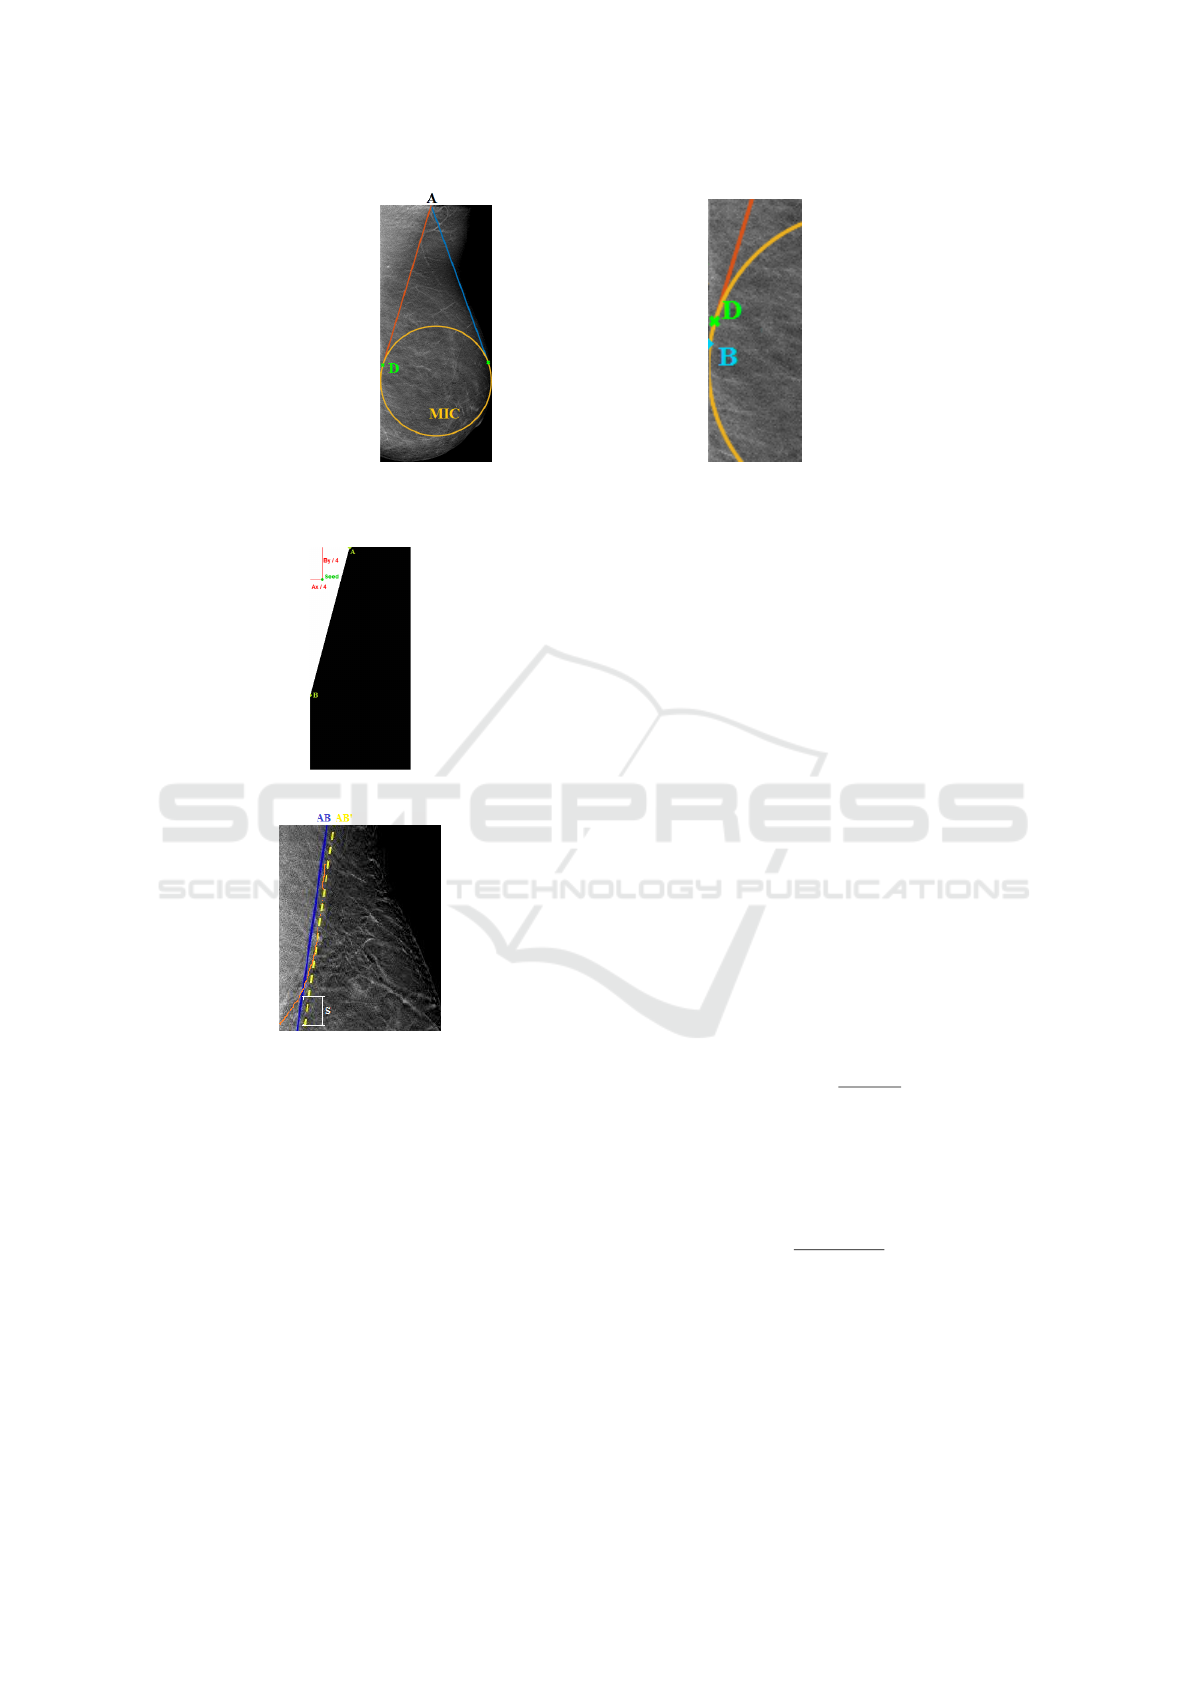
3.2 Obtaining of Geometric Rules
As shown in Figure 4, the edge of the pectoral muscle
is located at the point A (the top of the image–first
row of image). To find A, we compute the average of
the intensities in the breast region for the first 30 rows
of the image. Then, this average value is used as a
threshold to create a binary image of the pixels with
a higher intensity in the 10th-row region at the top of
the image. As the images are prone to be affected by
noise, we do not directly take the last white pixel on
the first row in the mask, and we smooth the shape of
this binary mask before locating where the edge is. To
smooth the mask, we take the edge location of the first
five rows and compute the mean of the column value
of them, as it is still possible to find some essential
variances in the mask even after the smoothing.
As depicted in Figure 5(a), we first determine the
maximum inscribed circle (MIC) inside the breast re-
gion, by implementing the algorithm introduced in
(Xia et al., 2007). The MIC algorithm applies a vec-
tor distance transformation to create a distance field,
and an intensity value is set for each pixel of the im-
age depending on the distance from that pixel to the
edges of the breast. Then, it globally searches for the
radius and center of the MIC. The center point O is
determined by selecting the pixel with the highest in-
tensity on the distance field, and the radius r is the
distance from that pixel to the nearest edge point.
As shown in Figure 5(b), we determine the tangent
line from A to MIC. We can express this process as
follows:
• Calculate AO vector: AO = (x
O
− x
A
,y
O
− y
A
)
• Get middle point in AO: C
2
= (
AO
1
2
,
AO
2
2
)
where C
2
is the center of a second circle with radius
AO
2
that intersects with MIC in two points, and by
solving the formulas of the two circles, we can get the
intersections. It worth noting that the possible num-
ber of solutions (intersection points) of this problem
are:
• Two intersection points (crossing circles).
• One intersection point (tangent circles).
• No intersection (separated circles).
As the line AO includes the radius of MIC, our case
will always be the first case (two crossing circles with
two intersection points). Therefore, we will choose
the leftmost point (lower x value) and define it as
point D. The line AD is extruded until it reaches the
left edge of the image to find point B (see Figure 5(b)).
This extrusion is made by calculating the straight line
formula for AD y = m ∗ x +b, where m =
∆y
∆x
=
y
A
−y
D
x
A
−x
D
and b = y
A
− m ∗ x
A
, and set x
B
= 1 to find y
B
using
the same formula. Note that we need to find the point
B to create the right-angled triangle. The point B is at
the edge of the pectoral, in the first column. It is diffi-
cult to find B in the same way as A because, generally,
the intensity of the pectoral pixels is more similar to
the intensity of the breast ones due to the increasing
density of the breast. Notably, a bit similar steps are
employed in (Taghanaki, 2017).
VISAPP 2020 - 15th International Conference on Computer Vision Theory and Applications
832

Figure 3: Determining the view of the images. (d) Binary mask over the breast and point A location.
Figure 4: Obtaining of geometric rules.
3.3 Selection of Pectoral Muscle Pixels
We implement a region growing process inside the
triangle previously defined by the geometrics of the
breast. The starting seed point is placed near the cen-
ter of this triangle to make sure that the seed is in-
side the pectoral region. The intial seed point is set to
(
1
4
A
x
,
1
4
B
y
). We formulate threshold of the selection
as follows:
th = I
RG
− (dev) ∗ I
RG
(1)
where I
RG
is the average value of the intensities of the
accepted pixels in the region growing process (only
the seed at first iteration).
As noise may cause deviations in intensity values,
and thus we do not calculate
I
RG
from the intensities
of pixels directly. Instead, we apply a mean filter by
creating a 75x75 window around each pixel and com-
pute the average of the intensities inside this window.
Thus, I
RG
is defined as follows:
I
RG
=
n
∑
i=1
px
i
n
(2)
here n is the number of pixels accepted in the region
growing, and px is the window average of a pixel.
px =
x,y=l1
∑
x,y=l1
px(X + x,Y + y)
75
2
(3)
where px(X,Y ) is the intensity of the selected pixel,
and x and y are the increments referring to the position
inside the window, and we set l1 to 37.
In each iteration of the selection of pectoral mus-
cle pixels, we perform the following:
• Select new pixel from the neighbour list (starts
with seed).
• Recalculate I
RG
and th.
• Calculate the intensity px of the selected pixel.
• Compare px and th. If px is higher, accept pixel
and update n and the sum for I
RG
.
• Add neighbouring non-selected pixels to the
neighbour list.
To add the neighboring pixels, we get the eight adja-
cent pixels around the selected pixel. In order to limit
the method inside the geometry triangle and avoid
adding the same pixel twice, we create a binary mask,
as shown in Fig.6. We will mark neighboring pixels
as zeros after adding them to the list, so if we mark a
neighbor of the current iteration as zero, we will not
include it again. The region growing process finishes
when there are no more pixels in the neighbor list.
3.4 Determining the Optimal
Parameters using the Grey Wolf
Optimizer (GWO)
Note that AB is a straight-line approximation, but the
edge of the pectoral muscle normally has a concave or
convex shape. Concave pectorals will always inside
the limit of the triangle, but for the convex ones, some
pixels might be outside this limit. To avoid the under-
segmentation of the pectoral muscle, we shift the line
AB to the right by a factor δ from the top-left corner to
B (see Figure 7). This is achieved by modifying the y-
intercept term in the straight-line formula b
0
= b + S,
where S = δ ∗ B
y
, and recalculating the x
0
and y
0
of A
0
and B
0
, respectively.
Here, we use the GWO optimizer proposed in
(Mirjalili et al., 2014) to find the optimal values of
the shift δ of the line AB and the threshold parameter
dev. The GWO optimizer simulates the social hier-
archy of grey wolves, in order, alpha (α), beta (β),
delta (∆), and omega(ω) wolves. Alpha wolves are
the leaders that manage and conduct the whole pack
of wolves. They formulated the hunting mechanism
Pectoral Muscle Segmentation in Tomosynthesis Images using Geometry Information and Grey Wolf Optimizer
833
(a) (b)
Figure 5: (a) A-MIC intersection points, (b) AD extrusion to point B.
Figure 6: Position of the seed over the binary mask.
Figure 7: Original AB line and shifted AB’ line (hand-
drawn pectoral edge in orange).
of grey wolves using three steps: tracking and dimin-
ishing the prey, surrounding the prey until it stops, and
hitting it. The prey encircling is expressed as follows:
¯
D =
¯
C ·
¯
X
p
(I) −
¯
X
(4)
¯
X(I +1) =
¯
X
p
(I) −
¯
A ·
¯
D (5)
where I indicates the current iteration,
~
A and C are
coefficient vectors,
¯
X
p
(I) is the position vector of the
prey,
¯
X refers to the position vector of a grey wolf,
~
A
and
~
C can be calculated as
~
A = 2~a ·~r
1
−~a,
~
C = 2~r
2
.
The wolf alpha guides the hunting process. Mir-
jalili et al. (Mirjalili et al., 2014) formulated this pro-
cess as
D
α
=
|
C
1
· X
α
− X
|
(6)
D
β
=
C
2
· X
β
− X
(7)
D
∆
=
|
C
3
· X
∆
− X
|
(8)
where
¯
X
1
=
¯
X
a
−
¯
A
1
· (
¯
D
α
),
¯
X
2
=
¯
X
β
−
¯
A
2
·
¯
D
β
,
¯
X
3
=
¯
X
∆
−
¯
A
3
· (
¯
D
∆
), and
¯
X(I + 1) =
(
¯
X
1
(I) +
¯
X
2
(I) +
¯
X
3
(I)) /3. Finally, they model
the process of approaching and hunting the prey
by decreasing the value of A randomly in the range
[−wd, wd], and reduce the value of wd from 2 to 0
over the iteration.
In our experiments, we set the search ranges of
dev and δ, number of iteration, number of agents to
[0.3, 0.7], [-1/4, 1/4], 10, and 5, respectively. We cal-
culate the fitness of each search agent using the seg-
mented pectoral regions. In this paper, we use en-
tropy, which is a statistical measure of randomness. It
can be used to characterize the texture of an image.
Entropy is defined as follows:
E = −sum(p.∗ log2(p)) (9)
where p contains the normalized counts of the his-
togram of input image. The fitness function is ex-
pressed as follows:
f it = 1 −
1
entropy
(10)
The Homogeneity measure the closeness of the distri-
bution of the elements in the image. Homogeneity is
defined as follows (Y. Li, H. Chen, Y. Yang, N. Yang,
2013):
H =
2
n
b
∑
i=0
2
n
b
∑
j=0
1
1 +(i − j)
2
× p
t
(i, j) (11)
where p
t
(i, j) are the pixel intensities of the image,
and the homogeneity fitness is expressed as follows:
f itH = 1 − homogeneity (12)
In future studies, we will use an artificial neural net-
work (Abdel-Nasser et al., 2018) instead of GWO to
find the best parameters.
VISAPP 2020 - 15th International Conference on Computer Vision Theory and Applications
834

4 RESULT AND DISCUSSION
In our experiments, a total of 16 tomosynthesis im-
ages are employed to evaluate the performance of the
proposed method. We gathered the images from a
hospital in Spain (Hospital Universitario Puerta del
Mar). This paper used manually segmented pectoral
muscle regions as the ground-truth. Utilizing a com-
puter graphic user interface (GUI) tool in MATLAB,
we outlined pectoral muscle regions on tomosynthesis
images in the dataset of this research.
In this study, we use two metrics for evalu-
ating the efficacy of the proposed method: Dice
and intersection-over-union (IoU). The Dice and IoU
scores can be defined as follows:
Dice =
2
|
Im
o
∩ Im
s
|
|
Im
o
|
+
|
Im
s
|
(13)
Jaccard =
|
Im
o
∩ Im
s
|
|
Im
o
∪ Im
s
|
(14)
where R
i
o
and R
i
s
are the segmentation masks of the
proposed method and the ground truth, respectively.
The values of Jaccard and Dice metrics vary from 0
to 1. If any of the two metrics have a value of 0, it
indicates that two masks have no common elements,
while we obtain a value of 1 with Jaccard and Dice
metrics if and only if the masks are identical. The
larger the values of the Jaccard and Dice metrics, the
more accurate the segmentation obtained by the pro-
posed method.
In Table 1 we show the Dice of the IoU scores of
the proposed method when using the Entropy and Ho-
mogeneity fitness function. As shown, the proposed
method achieves the best results with the Homogene-
ity fitness function with Dice score of 0.823 and an
IoU score of 0.726.
Table 1: Segmentation results of the proposed method.
Fitness Dice IoU
Entropy fitness 0.816±0.11 0.702±0.15
Homogeneity fitness 0.823±0.09 0.726±0.13
Figure 8 shows an example of pectoral muscle
segmentation in tomosynthesis images. Figure 8(a)
shows the input tomosynthesis image, Figure 8(b)
presents the binary mask generated by the proposed
method. The binary mask is multiplied with the
the input tomosynthesis image to suppress the pec-
toral muscle. As shown in Figure 8(c), the proposed
method accurately segment the pectoral muscle from
the breast area.
5 CONCLUSIONS
In this paper, we have presented a promising method
for pectoral muscle segmentation from tomosynthesis
images automatically. The proposed method includes
four steps: 1) a preprocessing step, 2) obtaining of
geometric information of pectoral muscle, 3) selec-
tion of pectoral muscle pixels, and 4) finding the opti-
mal parameters using the grey wolf optimizer (GWO).
The optimizer determines distinct parameters setting
for each input image as they depend on its breast den-
sity. The proposed method is assessed with a set of
tomosynthesis images and achieved a Dice score of
0.823 and an IoU score of 0.726. The future work will
be focused on the use of various fitness function as
well as evaluating the proposed with a larger dataset
of tomosynthesis images.
ACKNOWLEDGEMENTS
This research was partly supported by the Spanish
Govern-ment through project DPI2016-77415-R.
REFERENCES
Abdel-Nasser, M., Mahmoud, K., and Kashef, H. (2018).
A novel smart grid state estimation method based on
neural networks. IJIMAI, 5(1):92–100.
Abdel-Nasser, M., Moreno, A., and Puig, D. (2016a). Tem-
poral mammogram image registration using optimized
curvilinear coordinates. Computer methods and pro-
grams in biomedicine, 127:1–14.
Abdel-Nasser, M., Saleh, A., Moreno, A., and Puig, D.
(2016b). Automatic nipple detection in breast ther-
mograms. Expert Systems with Applications, 64:365–
374.
Ergin, S., Esener,
˙
I. I., and Y
¨
uksel, T. ((2016)). A genuine
glcm-based feature extraction for breast tissue classi-
fication on mammograms. International Journal of
Intelligent Systems and Applications in Engineering,
pages 124–129.
Hubbard, R. A., Kerlikowske, K., Flowers, C. I., Yankaskas,
B. C., Zhu, W., and Miglioretti, D. L. (2011). Cumula-
tive probability of false-positive recall or biopsy rec-
ommendation after 10 years of screening mammog-
raphy: a cohort study. Annals of internal medicine,
155(8):481–492.
Keller, B. M., Chen, J., Daye, D., Conant, E. F., and Kon-
tos, D. (2015). Preliminary evaluation of the pub-
licly available laboratory for breast radiodensity as-
sessment (libra) software tool: comparison of fully
automated area and volumetric density measures in a
case–control study with digital mammography. Breast
Cancer Research, 17(1):117.
Pectoral Muscle Segmentation in Tomosynthesis Images using Geometry Information and Grey Wolf Optimizer
835

(a) Segmented Breast (b) Generated mask (c) Segmented Pectoral
Figure 8: Example of pectoral muscle segmentation result.
Lee, C. H., Dershaw, D. D., Kopans, D., Evans, P., Mon-
sees, B., Monticciolo, D., Brenner, R. J., Bassett, L.,
Berg, W., Feig, S., et al. (2010). Breast cancer screen-
ing with imaging: recommendations from the society
of breast imaging and the acr on the use of mammog-
raphy, breast mri, breast ultrasound, and other tech-
nologies for the detection of clinically occult breast
cancer. Journal of the American college of radiology,
7(1):18–27.
Malvezzi, M., Carioli, G., Bertuccio, P., Boffetta, P., Levi,
F., La Vecchia, C., and Negri, E. (2019). European
cancer mortality predictions for the year 2019 with fo-
cus on breast cancer. Annals of Oncology, 30(5):781–
787.
Mirjalili, S., Mirjalili, S. M., and Lewis, A. (2014). Grey
wolf optimizer. Advances in engineering software,
69:46–61.
Palkar, P. and Agrawal, P. (2016). A technique to extract
statistical parameters of digital mammogram to de-
tect breast cancer. Int. J. Adv. Res. Sci. Eng. Technol,
3(12):3033–3038.
Pavan, A. L., Vacavant, A., Alves, A. F., Trindade, A. P.,
and de Pina, D. R. ((2019)). Automatic identifica-
tion and extraction of pectoral muscle in digital mam-
mography. In World Congress on Medical Physics
and Biomedical Engineering 2018, pages 151–154.
Springer.
Pertuz, S., Torres, G. F., R., T., and Kamarainen, J. (2019).
Open framework for mammography-based breast can-
cer risk assessment. In IEEE-EMBS International
Conference on Biomedical and Health Informatics.
Qayyum, A. and Basit, A. ((2016)). Automatic breast seg-
mentation and cancer detection via svm in mammo-
grams. In 2016 International conference on emerging
technologies (ICET), pages 1–6. IEEE.
Selvathi, D. and Poornila, A. A. ((2018)). Deep learning
techniques for breast cancer detection using medical
image analysis. In Biologically Rationalized Comput-
ing Techniques For Image Processing Applications,
pages 159–186. Springer.
Shi, P., Zhong, J., Rampun, A., and Wang, H. ((2018)).
A hierarchical pipeline for breast boundary segmen-
tation and calcification detection in mammograms.
Computers in biology and medicine, 96:178–188.
Sreedevi, S. and Sherly, E. ((2015)). A novel approach for
removal of pectoral muscles in digital mammogram.
Procedia Computer Science, 46:1724–1731.
Taghanaki, S. A., L. Y. M. B. H. (2017). Geometry-based
pectoral muscle segmentation from mlo mammogram
views. IEEE Transactions on Biomedical Engineer-
ing, 64(11):2662—-2671.
Taghanaki, S. A., Liu, Y., Miles, B., and Hamarneh, G.
(2017a). Geometry-based pectoral muscle segmenta-
tion from mlo mammogram views. IEEE Transactions
on Biomedical Engineering, 64(11):2662–2671.
Taghanaki, S. A., Liu, Y., Miles, B., and Hamarneh, G.
((2017)b). Geometry-based pectoral muscle segmen-
tation from mlo mammogram views. IEEE Transac-
tions on Biomedical Engineering, 64(11):2662–2671.
Toz, G. and Erdogmus, P. ((2018)). A single sided edge
marking method for detecting pectoral muscle in digi-
tal mammograms. Eng Technol Appl Sci Res, 8:2367–
2373.
Unni, A., Eg, N., Vinod, S., and Nair, L. S. ((2018)). Tu-
mour detection in double threshold segmented mam-
mograms using optimized glcm features fed svm. In
2018 International Conference on Advances in Com-
puting, Communications and Informatics (ICACCI),
pages 554–559.
Xia, R., Liu, W., Zhao, J., Bian, H., and Xing, F. (2007). Ro-
bust algorithm for detecting the maximum inscribed
circle. In 2007 10th IEEE International Conference
on Computer-Aided Design and Computer Graphics,
pages 230–233. IEEE.
Y. Li, H. Chen, Y. Yang, N. Yang (2013). Pectoral muscle
segmentation in mammograms based on homogenous
texture and intensity deviation. ELSEVIER, 46(Issue
3):681–691.
VISAPP 2020 - 15th International Conference on Computer Vision Theory and Applications
836
