
Methods of the Pulse Wave Velocity Estimation based on Pneumatic
Blood Pressure Sensor Data and Synchronous ECG Records
V. E. Antsiperov
1 a
, G. K. Mansurov
1
and A. S. Bugaev
2
1
Kotelnikov Institute of Radioengineering and Electronics of RAS, Mokhovaya 11-7, Moscow, Russian Federation
2
Moscow Institute of Physics and Technology, Institutskiy per. 9, Dolgoprudny, Russian Federation
Keywords:
Non-invasive Arterial Blood Pressure Monitoring, Pneumatic Sensor, Pulse Wave Transit Time, Pulse Wave
Velocity, ECG Synchronization, Atherosclerosis Diagnosis.
Abstract:
The article discusses a new method for diagnosing atherosclerosis with the help of a pneumatic blood pressure
sensor recently developed by the authors. Since atherosclerosis is a progressive disease characterized by
the deposition of cholesterol and certain fractions of lipoproteins on the walls of blood vessels, it is always
accompanied by an increase in stiffness of the artery walls. One technique to assess arterial stiffness, is the
measurement of arterial pulse wave velocity, that is the distance traveled by blood flow divided by the time it
takes to travel that distance. So the direct method for estimating pulse wave velocity is to measure the transit
time of a pulse wave between a pair of artery points by means, for example, of any tonometric sensors. In
this connection the paper discusses the possibility of using a new type of sensors developed by the authors
—– pneumatic sensors —- to measure the pulse wave transit time. However, given the existing features of
these sensors and, accordingly, the special features of pressure measurements, it was necessary to significantly
modify the direct method for estimating pulse wave velocity. The main modification characterizing the new,
indirect method consists in evaluating the delay of the pulse wave at the points of the artery with respect
to some characteristic moment of a synchronous ECG (e.g. the time moment of R–peak, that corresponds
to heart ventricles contractions). The details of this method and its modification in the form of a simplified
single–point method of estimating pulse wave velocity form the main content of the work.
1 INTRODUCTION
Today, cardiovascular disease is the main cause of the
deterioration in the health of many people, including
mortality, worldwide. In its turn, the most common
cause of cardiovascular diseases is atherosclerosis, a
progressive disorder leading to the build-up of choles-
terol and other lipoprotein fractions on artery walls.
Such a buildup is characterized by the formation of
atherosclerotic plaques followed by wall calcification,
which leads to artery deformation and narroing (up
to occlusion). As this reduces the flow of oxygen-
saturated blood to vital organs (e.g. heart and brain), it
causes the myocardial and cerebral ischemia. As a re-
sult, the risk of such severe disorders as acute myocar-
dial infarction or stroke (caused by thrombosis upon
the occlusion) increases significantly (Laurent et al.,
2006). For this reason now, the research and develop-
ment of reliable methods for detecting atherosclerosis
a
https://orcid.org/0000-0002-6770-1317
in early stages (subclinically) is an extremely impor-
tant problem.
Atherosclerosis can be detected using damage
markers of internal organs (e.g. heart, kidneys, arter-
ies) during the invasive study. However, it is clear that
non–invasive methods seem more appealing in terms
of diagnosing atherosclerosis in the subclinical phase.
Essentially, those methods are related to structural
and functional assessment of the blood vessel state.
In this context we must mention (A) Doppler ultra-
sonography used to evaluate the intima media thick-
ness and analyze plaques, as well as the (B) ankle-
brachial index evaluation method employed to iden-
tify peripheral artery disorders. Besides the afore-
mentioned methods, today’s medicine emphasizes a
group of methods based on analyzing systolic blood
pressure and, more generally, the shape of the blood
pressure pulse wave. Largely, this trend can be ex-
plained by the discovery of the relationship between
blood pressure parameters and arterial stiffness, with
the latter depending on the calcification of walls.
Antsiperov, V., Mansurov, G. and Bugaev, A.
Methods of the Pulse Wave Velocity Estimation based on Pneumatic Blood Pressure Sensor Data and Synchronous ECG Records.
DOI: 10.5220/0009155303010307
In Proceedings of the 13th International Joint Conference on Biomedical Engineering Systems and Technologies (BIOSTEC 2020) - Volume 4: BIOSIGNALS, pages 301-307
ISBN: 978-989-758-398-8; ISSN: 2184-4305
Copyright
c
2022 by SCITEPRESS – Science and Technology Publications, Lda. All rights reserved
301
2 ASSESSMENT OF ARTERIAL
WALL STIFFNESS BY PWV
ESTIMATION
One of the most prominent parameters (the gold stan-
dard) for the assessment of arterial stiffness is the
pulse wave velocity (PWV), i.e. the speed of the pres-
sure pulse wave (PW) propagating along the walls of
the artery caused by the release of blood flow, ejected
by the heart during the systole (Evangelista, 2011).
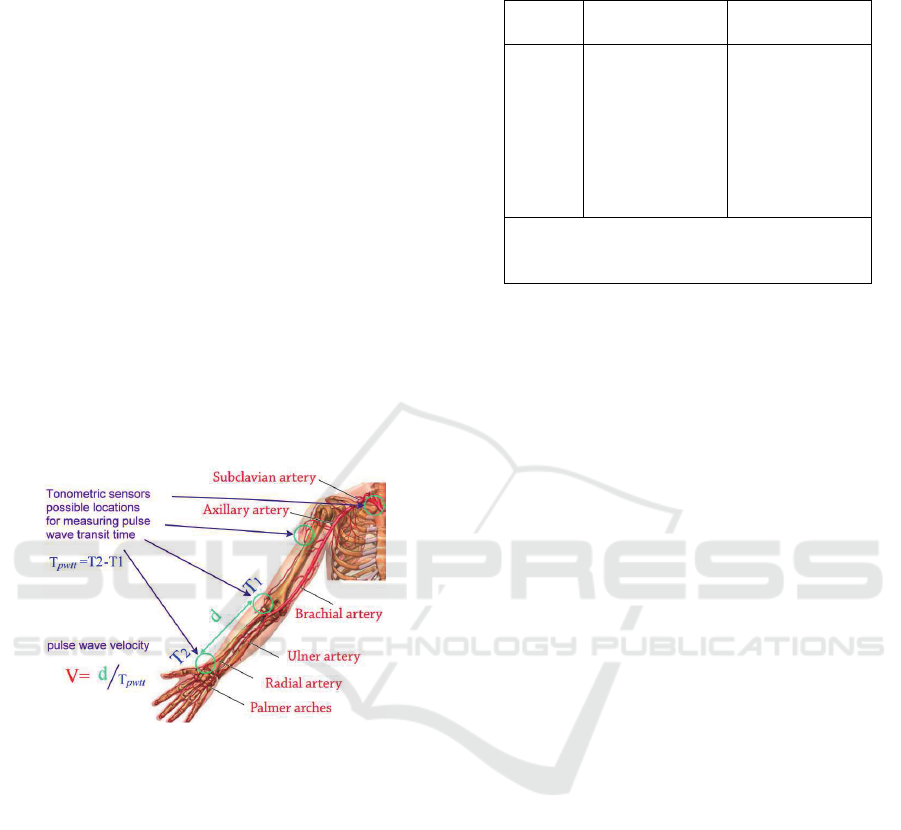
So, the direct PWV measurement method is under-
pinned by estimating the PW transit time T
pwtt
=
T
2
− T
1
, i.e. the time for which the wave travels be-
tween two different points at the artery. In its turn,
PWV will be the distance d travelled by wave divided
by transit time: V = d/T
pwtt
. Any pair of tonomet-
ric sensors can be used for the implementation of this
method, provided that those sensors are located prox-
imally above the surface arteries, distally against the
heart (on the carotid, femoral, radial, and other arter-
ies) (Kim and Kim, 2019), see Figure 1.
Figure 1: Tonometric sensors locations for PWV estima-
tion. PWV V is calculated by dividing the distance d be-
tween the sensors by measured PW transit time T
pwtt
.
To date, there are several types of tonometric sen-
sors employed for estimating PWV under the above
method. They may differ by the mode of action (from
applanation tonometry, oscillometric approach, etc.
to magnetic tomography) and by design. The detailed
review of known direct PWV measurement methods
employing various sensors and results derived here
can be found in (Cavalcante and Lima, 2011), (Bene-
tos et al., 2010). Typical reference values of PWV
for people without significant cardiovascular prob-
lems that are currently used as guidelines for assess-
ing the state of blood vessels can be found in (Benetos
et al., 2010), see also Table 1.
Recently, the authors of this work also proposed
to use a new type of sensors – pneumatic sensors for
continuous arterial blood pressure monitoring in the
problem of the pulse wave velocity estimation. How-
Table 1: PWV by age groups of patients in norm (1455 per-
sons) – adapted from (Benetos et al., 2010).
Age Mean PWV Median PWV
(year) (±2SD) (10-90 pc)
< 30 6.2 (4.7-–7.6) 6.1 (5.3-–7.1)
30—39 6.5 (3.8—9.2) 6.4 (5.2-–8.0)
40—49 7.2 (4.6-–9.8) 6.9 (5.9-–8.6)
50—59 8.3 (4.5—12.1) 8.1 (6.3-–10.0)
60—69 10.3 (5.5-–15.0) 9.7 (7.9-–13.1)
≥ 70 10.9 (5.5-–16.3) 10.6 (8.0-–14.6)
SD abbriviation is for standard deviation;
10 pc is upper limit (10%); 90 pc is
lower limit (90%).
ever, in view of the existing features of these sensors
and, accordingly, peculiarities in measurement meth-
ods, we had to significantly modify the direct method
for estimating PWV. The main change characterizing
the new, developed by us method consists in mea-
suring indirectly the transfer time between a pair of
points at the artery by measuring PW delays for both
points in relation to the R–peaks of the ECG record
(time moments of the heart ventricles contraction).
The details of this method and the results obtained are
presented below in the paper.
3 USING PNEUMATIC BLOOD
PRESSURE SENSORS IN PWV
ESTIMATION
Some time ago the authors of this paper suggested a
new method of non–invasive continuous arterial blood
pressure measurement that employed the principle
of local compensation and represented the advance-
ment of applanation tonometry methods. In techni-
cal terms the principle is realized in the form of a
pneumatic sensor (Antsiperov and Mansurov, 2019a),
(Mansurov and Antsiperov, 2017), Figure 2.
From some perspective, the pneumatic sensor op-
erates as a pressure relief valve (PRV). When the mea-
suring unit’s outlet is covered by soft tissues of the
wrist, the continuous air flow from the receiver in
pneumatic circuit coming into the chamber increases
pressure P
sen
in it. But, when P
sen
slightly exceeds
the artery wall pressure P
art
, a part of the air leaks out
due to elastic displacement of surface tissues, and that
aligns P
sen
to P
art
, see Figure 2. However, it should be
noted that there is one significant difference between
the sensor and an ordinary PRV. While a pressure drop
is a one–time event for a PRV during its normal op-
eration, the sensor operates in conditions of perma-
BIOSIGNALS 2020 - 13th International Conference on Bio-inspired Systems and Signal Processing
302

A
B
C
P
sen
P
art
Pronator Quadratus
Ulnar Bone
Radius Bone
Radial
Artery
Figure 2: (A) the sketch of the pneumatic sensor’s measur-
ing unit (on the radial artery), (B) the sensor design includ-
ing the electronic circuit with measuring unit (bottom) and
pneumatic circuit (top), (C) location of the measuring unit
on the patient’s wrist during ABP monitoring.
nent air leakage, continuously tracking the changes
of blood pressure: P
sen
∼ P
art
.
Besides their main purpose (monitoring time–
dependent blood pressure dynamics P
art
(t)), the sen-
sors described can be used as tonometers that reg-
ister time parameters of PW (e.g. moments of sys-
tolic blood pressure values, pressure fronts, PW feet,
etc.). Recently we have carried out corresponding ex-
periments aimed at direct measurment of PWV with
the help of blood pressure sensors as tonometers. A
small group of volunteers (12 people) participated in
these experiments, and a set of methods was used, that
differed slightly in criteria (selection of characteristic
points of the PW waveform) used to estimate the tran-
sit time. The results turned out to be consistent with
the reference data given in Table 1.
However, the experiments also showed that the
use of pneumatic sensors in the direct PWV measur-
ment method is a scrupulous and complex procedure
requiring fine and barely controllable measurements.
The key reason for this is the problem of the proper
positioning of pneumatic sensors – the issue we have
already mentioned earlier (Antsiperov and Mansurov,
2019a), (Antsiperov and Mansurov, 2019b). In fact,
to implement the local compensation method, the
measuring unit’s outlet has to be very small (less than
1 mm in diameter, while the preloaded radial artery is
3 mm in diameter). This said, to ensure proper mea-
surements (P
sen
∼ P
art
), the outlet has to be positioned
accurately above the artery’s central axis (accurate to
fractions of a millimetre). And as long as this artery
is unobservable, the outlet is positioned recurrently,
based on the signal waveform. As a result, the pro-
cedure of positioning the measuring unit turns out to
be adaptive to the registered signal –— this means
the blood pressure may change in unclear ways. If
there are two sensors employed and they are located
in different places on the artery (see Figure 1), the
synchronous measurement with the concurrent mon-
itoring of positions of both sensors becomes a hard–
going task, accompanied by an abrupt decrease in the
measurement stability on both channels.
4 INDIRECT METHOD FOR PWV
ESTIMATION
The problem of measuring transit time with the help
of pneumatic sensors was solved by virtue of apply-
ing an indirect method. Basically, this method im-
plies carrying out measurements for two points at dif-
ferent time moments – in this case, only one sensor
will be needed. This concept may be implemented
the following reasons. Let us assume that the delay
of PW is measured not between the selected points
but in each of those points against another event (e.g.
against time T
R
of ventricular contraction, i.e. posi-
tion of R–peak of the ECG). Denoting delays by δ
1
and δ
2
respectively, it would be true that T
1
= T
R
+ δ
1
and T
2
= T
R
+ δ
2
. This said, the PW transit time be-
tween the selected points is T
pwtt
= T
2
−T
1
= δ
2
−δ
1
.
Now, if delays δ
1
and δ
2
depend only on geometri-
cal and physical properties of a respective artery and
do not depend on dynamically changing environment,
we do not have to assess them against the same T
R
. To
this end, δ
1
and δ
2
can be assessed against the events
happening at different times, with the help of the same
(the only) sensor.
To assess the possibility of realizing the afore-
mentioned indirect PWV measurement method, our
pneumatic sensor (Antsiperov and Mansurov, 2019a),
(Mansurov and Antsiperov, 2017) was equipped with
an additional channel for synchronous ECG signal
processing. As the purpose of such a modification is
relating time parameters of PW to the heart’s rhyth-
mic activity, ECG was implemented in the form of a
very simplified single-channel amplifier based on the
original dry electrode (without conductive gel) circuit
without a neutral electrode.
Figure 3 shows the fragment of a 12–second syn-
chronous dynamics of blood pressure signals P
sen
(t)
measured with a modified pneumatic sensor on the
patient’s wrist (Figure 2 C) and ECG signal V
ecg
(t)
from wrists of both hands. In Figure 3 on both sig-
nals the time markers (vertical lines) denote locations
on time axis of R-peaks T
(i)
R
, i = 1,2,... and PW feet
T
(i)
f
, usually considered as beginnings of respective
pulses. One can see with the naked eye that upon the
explicit variability of R—-R intervals (T
(i+1)
R
− T
(i)
R
)
and f–f intervals (T
(i+1)
f
− T
(i)
f
), the delay periods
of PW against R–peak — pulse propagation times
T
(i)
ppt
= T
(i)
f
− T
(i)
R
remain mostly the same.
The table 2 presents quantitative data on the vari-
ability of the R–R and f–f intervals, as well as the
mean pulse propagation time and its standard devia-
tion for 12 volunteers. As usual, variability can be
estimated in any way by comparing the mean val-
Methods of the Pulse Wave Velocity Estimation based on Pneumatic Blood Pressure Sensor Data and Synchronous ECG Records
303
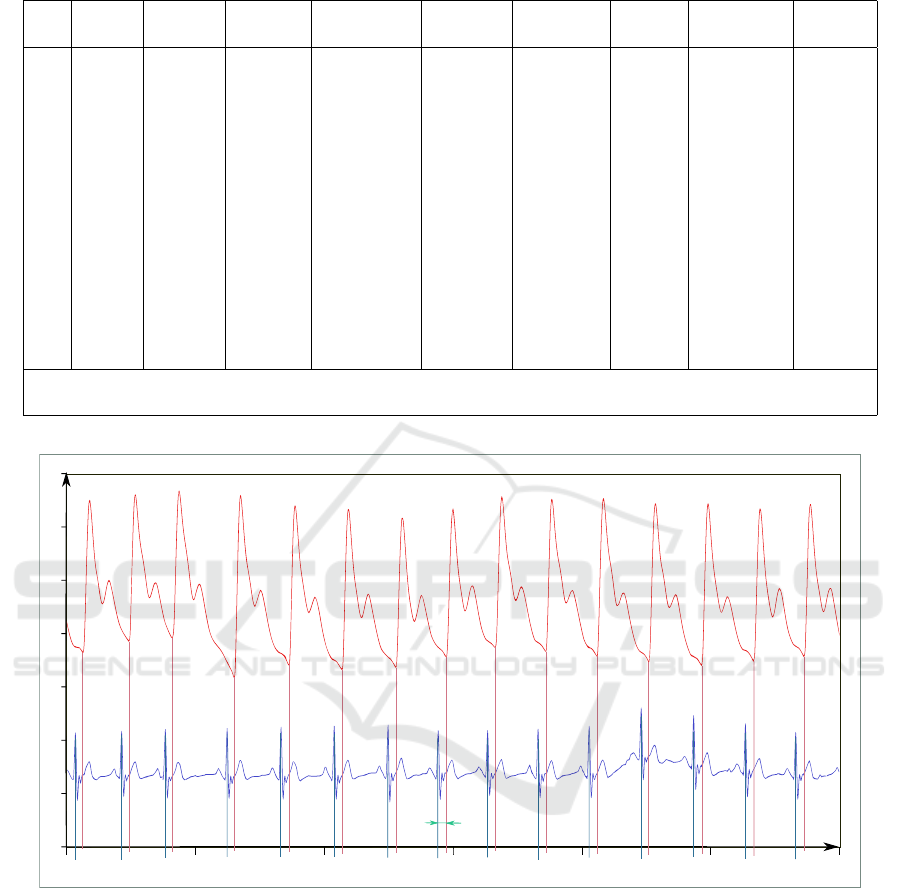
Table 2: Temporal parameters of synchronously measured blood pressure (wrist) and ECG (leads on the wrists) signals.
No Age Health Num of Mean R–R SD R–R Mean f–f SD f–f Mean R–f SD R–f
(year) status averag. (sec) (sec) (sec) (sec) (sec) (sec)
1 60 infarct 35 0.8591 0.0077 0.8599 0.0101 0.1109 0.0038
2 25 healthy 34 0.9279 0.0357 0.9252 0.0343 0.1425 0.0039
3 27 healthy 43 1.0320 0.0236 1.0325 0.0240 0.1345 0.0023
4 50 healthy 50 0.9858 0.0384 0.9850 0.0407 0.1151 0.0045
5 62 tachyc. 48 0.8119 0.0065 0.8117 0.0061 0.1100 0.0020
6 56 hypert. 84 0.8575 0.0168 0.8572 0.0148 0.1103 0.0039
7 57 healthy 52 0.8222 0.0114 0.8215 0.0148 0.1174 0.0065
8 22 arrhyt. 22 1.0595 0.0435 1.0569 0.0434 0.1558 0.0026
9 22 arrhyt. 23 1.0506 0.0799 1.0532 0.0460 0.1374 0.0297
10 30 healthy 27 0.7250 0.0236 0.7259 0.0252 0.1311 0.0048
11 80 infarct 16 0.8648 0.0110 0.8633 0.0152 0.1100 0.0073
12 61 healthy 22 0.9125 0.0179 0.9067 0.0205 0.1060 0.0060
Mean and SD (standard deviation) were calculated after trimming 10 % of the lowest values
and 10 % of the highest values (10-90 pc).
50
120
110
100
90
80
70
60
20 22 24 26 28 3230
t, sec
Psen, mmHg
Vecg, con.u
Tptt
Figure 3: Synchronous measurement of (A) blood pressure and (B) ECG signals. Vertical lines denote moments of R–peaks
and corresponding PW feet. The figure shows that even upon the variability of R—R and foot–foot intervals, pulse propagation
time T
ppt
= T
f
− T
R
remains very stable.
ues (Mean) and standard deviations (SD) displayed
in adjacent columns of the table for the correspond-
ing intervals. To obtain the Mean and SD values
the averaging was carried out by the number of car-
diocycles (column Num of averag.) in each record
made in a separate experiment (for a specific volun-
teer at a specific location on the artery of the measur-
ing unit). These experiments were carried out using a
single pneumatic sensor as a tonometer with its fixed
locations on the radial and brachial arteries in 12 vol-
unteers of different ages and health conditions. The
measurement data obtained for one of two locations
on the radial artery (on the patient’s wrist) are given
in Table 2 (Figure 3 shows the fragment of volun-
teer No 1’s data). Eventually, the experiment results
turned out to be consistent with the data obtained dur-
ing the implementation of the direct method. To this
end, they are consistent with the data given in Table
1. With that, the indirect method proved to be more
convenient and less demanding than the direct method
BIOSIGNALS 2020 - 13th International Conference on Bio-inspired Systems and Signal Processing
304

(as expected). Also, the measurement of PWV with
the help of the indirect method does not require any
special training. Instead, the operator only needs to
follow simple instructions. We think that after im-
proving the method in compliance with existing med-
ical requirements, the developed PWV measurement
method can be used in clinical practice.
The experiments turned out to give an unexpected
result – an opportunity to measure PWV with the help
of one pneumatic sensor located at only one point. In
essence, it impies that one imaginary sensor is located
next to the aortic arch and the other – a real sensor – is
located in the place, where the easiest measurement of
blood pressure can be provided, e.g. above the radial
artery, as illustrated in Figure 4 A. We should note that
this concept is hardly innovative. There is already an
accepted methodology for measuring PWV with the
help of a combination of the ECG and a plethysmo-
graphic sensor mounted on the patient’s finger. For
details and references to similar methods, please refer
(Bereksi-Reguig et al., 2017), (Castro et al., 2017),
(Proenca et al., 2010), (Liu et al., 2011), (Oreggia
et al., 2015). However, it is worth noting that although
our method is similar to the well-known plethysmo-
graphic approaches, it interprets the measurement of
the transit time T
pwtt
, used to calculate PWV, some-
what differently (see Figure 4 B).
t
P
aort output
Vecg
Tptt
P
art radial
Tpep
Tpwtt
P
aort output
P
art radial
jugular cavity
aortic arch
subclavian
artery
brachial
artery
ulnar artery
radial
artery
Vecg
d
V=
d
(T
ppt
-T
pep
)
d
Figure 4: PWV estimation with only one sensor located at
only one point. (A) imaginary sensor location above the
aortic arch and real sensor location on the wrist. (B) illus-
tration of relations between ECG V
ecg
(t), and blood PWs
P
aortout put
(t), P
artradial
(t) at locations shown in (A).
For exfmple, following their colleagues, the au-
thors of (Bereksi-Reguig et al., 2017) are guided by
the suggestion that the moment when R–peak appears
in the ECG almost matches the moment when the
pulse wave foot starts forming at the aorta output /
at the beginning of the subclavian artery. With that,
the pulse wave transition time T
pwtt
can be taken as
the delay period T
ptt
– pulse transit time (see Fig-
ure 4 B). After that, by dividing d (distance from the
jugular cavity to the finder tip) by the delay period,
PWV will be measured as V = d/T
ptt
. And though
(Bereksi-Reguig et al., 2017) mentions that T
pwtt
dif-
fers from T
ptt
by the pre-ejection period T
pep
(time
between ventricular contraction and beginning of the
formation of the pulse wave at the aorta output, see
Figure 4), the authors consider that difference negli-
gible (T
pep
≪ T
ptt
).
5 PULSE TRANSIT TIME
CORRECTION
However, our study showed that when the blood pres-
sure sensor is installed on the wrist or higher on the
arm, the suggestion T
pep
≪ T
ptt
becomes very in-
accurate or even incorrect. In fact, the authors of
the recent study (Kortekaas and van Velzen, 2018)
provided results of echocardiographic T
pep
measure-
ments for three groups, 20 persons in each, namely:
focus groups with no cardiovascular disorders under
50 years (A), older than 50 years (B), and having car-
diovascular risk factors (hypertension, dyslipidemia,
kidney failure, and diabetes) (C). The results derived
in (Kortekaas and van Velzen, 2018) can be summa-
rized in the following way: T
pep
for groups (A) and
(B) lies in ranges 58.5 ± 13.0 msec and 52.4 ± 11.9
msec, respectively; for (C) within the range 57.6 ±
11.6 msec. By comparing these results with our data
shown in Table 2, where T
ptt
taken as “Mean R–f” for
similar groups comes to 140.5 ± 10.1 msec for (A),
112.1 ± 4.8 msec for (B) and 110.4 ± 5.0 msec for
(C), it is not too hard to figure up that T
pep
represents
a considerable part of T
ptt
(up to half of the latter) in
all groups. In this regard, it is interesting to note that
the aim of the study (Kortekaas and van Velzen, 2018)
was to substantiate the non–obvious assumption, as
we show above, that T
pep
≪ T
ptt
.
For the foregoing reasons, PWV measurement
should employ the correct formula V = d/(T
ptt
−
T
pep
) that contains the pre-ejection period T
pep
. For-
tunately, it is not necessary to calculate T
pep
in ev-
ery case. The abovementioned study (Kortekaas and
van Velzen, 2018) states that T
pep
has weak individual
variations, at least within specific groups (A, B, C) of
patients. This said, having the reference values T
pep
for the corresponding groups and determining the af-
filiation of each patient to one of these groups (for
example, from his electronic health record – EHR),
we can use the proposed method for measuring PWV
only using the pulse transit time T
ptt
, but adjusting it
using the value T
pep
for the corresponding group. The
results of estimating PWV, using the data shown in
Table2, are given in Table 3.
As seen from Table 3, the Pulse Wave Velocity ob-
tained by us with the use of the modified pneumatic
sensor following the simplified indirect PWV mea-
Methods of the Pulse Wave Velocity Estimation based on Pneumatic Blood Pressure Sensor Data and Synchronous ECG Records
305

Table 3: PWV estimation based on synchronously measured blood pressure (wrist) and ECG Signals (wrist Leads).
No Age Health Number Mean T
ptt
Refer. T
pep
Distance d PW velocity V
(year) status of averag. (sec) (sec) (m) (m/sec)
1 60 infarct 35 0.1109 0.0576 0.70 13.1
2 25 healthy 34 0.1425 0.0585 0.68 8.1
3 27 healthy 43 0.1345 0.0585 0.66 8.7
4 50 healthy 50 0.1151 0.0524 0.65 10.4
5 62 tachyc. 48 0.1100 0.0524 0.68 11.8
6 56 hypert. 84 0.1103 0.0576 0.67 12.7
7 57 healthy 52 0.1174 0.0524 0.68 10.5
8 22 arrhyt. 22 0.1558 0.0585 0.66 6.8
9 22 arrhyt. 23 0.1374 0.0585 0.66 8.6
10 30 healthy 27 0.1311 0.0585 0.68 9.4
11 80 infarct 16 0.1100 0.0576 0.66 12.6
12 61 healthy 22 0.1060 0.0576 0.64 11.9
The pulse transition time values in the column “Refer. T
pep
”, used to calculate PW velocity V ,
were chosen as centres of T
pep
ranges for groups A, B, C (see discussion above,
based on (Kortekaas and van Velzen, 2018) data), while the groups were determined
by the columns “Age” and “Health” for each volunteer.
surement method are consistent with reference val-
ues from Table 1. Moreover, they correctly reflect the
age trends and known correlation between PWV and
some disorders (infarct, arrhythmia). Guided by those
first results, we can arrive at a general conclusion: de-
spite the apparent simplicity of the measurement pro-
cedure, the suggested method delivers adequate PWV
estimation results.
6 CONCLUSIONS
We can also make the following more specific and
substantial conclusions. As the suggested method im-
plies estimation of PWV in standard conditions of
blood pressure monitoring with the help of a pneu-
matic sensor (Mansurov and Antsiperov, 2017), it can
be cost–efficiently (by adding an ECG channel) mod-
ified and transformed into a versatile system that al-
lows to estimate the stiffness of the artery walls. It
suggests preliminary judgment about the state of the
cardiovascular system, especially about the degree of
atherosclerosis development. It goes without saying
that additional costs include software augmentation
(see (Bereksi-Reguig et al., 2017)) and examination
methodology modification (blood pressure monitor-
ing). However, we consider the cost increase negli-
gible compared to the benefit delivered by the versa-
tile system itself. Realizing that this theme has much
room for studies and tests, we optimistically expect
our efforts to pay off.
ACKNOWLEDGEMENTS
The authors are grateful to the Russian Foundation for
Basic Research (RFBR), grant N 18-29-02108 mk for
the financial support of this work.
REFERENCES
Antsiperov, V. and Mansurov, G. (2019a). Non-invasive
blood pressure monitoring with positionable three-
chamber pneumatic sensor. In Proc of the 12th
Int Conf on Biomed Eng Systems and Technolo-
gies, volume 5, pages 462–465. SCITEPRESS. doi:
10.5220/0007574904620465.
Antsiperov, V. and Mansurov, G. (2019b). Positioning
method for arterial blood pressure monitoring wear-
able sensor. In IWBBIO 2019, Lecture Notes in
Computer Science, volume 11465, pages 405–414.
Springer. doi: 10.1007/978-3-030-17938-0 36.
Benetos, A., Labat, C., and Lacolley, P. (2010). Determi-
nants of pulse wave velocity in healthy people and in
the presence of cardiovascular risk factors. Eur Heart
J., 31:2338–2350. doi: 10.1093/eurheartj/ehq165.
Bereksi-Reguig, M. A., Bereksi-Reguig, F., and Ali, A. N.
(2017). A new system for measurement of the
pulse transit time, the pulse wave velocity and its
analysis. J Mech Med Biol., 17(1):1750010. doi:
10.1142/S0219519417500105.
Castro, A., de Carvalho, P., Muehlsteff, J., and et al (2017).
A Review on Noninvasive Beat-to-Beat Systemic and
Pulmonary Blood Pressure Estimation through Surro-
gate Cardiovascular Signals, Chapter 2 in book Com-
BIOSIGNALS 2020 - 13th International Conference on Bio-inspired Systems and Signal Processing
306

putational Tools and Techniques for Biomedical Sig-
nal Processing. IGI Global. doi: 10.4018/978-1-5225-
0660-7.ch002.
Cavalcante, J. L. and Lima, J. A. (2011). Aortic
stiffness: current understanding and future direc-
tions. J Am Coll Cardiol., 57(14):1511–1522. doi:
10.1016/j.jacc.2010.12.017.
Evangelista, R. (2011). Pulse wave velocity: a marker of
arterial stiffness and its applicability in clinical prac-
tice. Revista Portuguesa de Cardiologia, 30(9):699–
702. doi: 10.1016/S2174-2049(11)70012-5.
Kim, H. L. and Kim, S. H. (2019). Pulse wave velocity
in atherosclerosis. Front Cardiovasc Med., 41. doi:
10.3389/fcvm.2019.00041.
Kortekaas, M. C. and van Velzen, M. (2018). Small intra-
individual variability of the pre-ejection period jus-
tifies the use of pulse transit time as approximation
of the vascular transit. PLoS ONE, 13(10):e0204105.
doi: 10.1371/journal.pone.0204105.
Laurent, S., Cockcroft, J., and Bortel, V. (2006). Expert
consensus document on arterial stiffness: method-
ological issues and clinical applications. Eur Heart
J., 27(21):2588–2605. doi: 10.1093/eurheartj/ehl254.
Liu, A.-B., Hsu, P.-C., Chen, Z.-L., and Wu, H.-T. (2011).
Measuring pulse wave velocity using ecg and pho-
toplethysmography. Journal of medical systems,
35(5):771–777. doi: 10.1007/s10916-010-9469-0.
Mansurov, G. and Antsiperov, V. (2017). Patent
RU2638712 (C1) – Pneumatic sensor for con-
tinuous non-invasive measurement of arte-
rial pressure. Federal service by intellec-
tual property of the Russian federation. url:
https://patents.google.com/patent/RU2638712C1/ru.
Oreggia, D., Guarino, S., Antonino, P., and et.al (2015).
Physiological parameters measurements in a cardiac
cycle via a combo ppg-ecg system. In 2015 AEIT
International Annual Conference (AEIT), pages 1–6.
IEEE. doi: 10.1109/AEIT.2015.7415214.
Proenca, J., Muehlsteff, J., X., A., and P., C. (2010). Is pulse
transit time a good indicator of blood pressure changes
during short physical exercise in a young population?
In 2010 Annual International Conference of the IEEE
Engineering in Medicine and Biology, volume 11465.
IEEE. doi: 10.1109/IEMBS.2010.5626627.
Methods of the Pulse Wave Velocity Estimation based on Pneumatic Blood Pressure Sensor Data and Synchronous ECG Records
307
