
A Taxonomy of Treemap Visualization Techniques
Willy Scheibel
a
, Matthias Trapp
b
, Daniel Limberger
c
and J
¨
urgen D
¨
ollner
Hasso Plattner Institute, Faculty of Digital Engineering, University of Potsdam, Germany
Keywords:
Treemaps, Taxonomy.
Abstract:
A treemap is a visualization that has been specifically designed to facilitate the exploration of tree-structured
data and, more general, hierarchically structured data. The family of visualization techniques that use a
visual metaphor for parent-child relationships based “on the property of containment” (Johnson, 1993) is
commonly referred to as treemaps. However, as the number of variations of treemaps grows, it becomes
increasingly important to distinguish clearly between techniques and their specific characteristics. This paper
proposes to discern between Space-filling Treemap
T
S
, Containment Treemap
T
C
, Implicit Edge Representation
Tree
T
IE
, and Mapped Tree
T
MT
for classification of hierarchy visualization techniques and highlights their
respective properties. This taxonomy is created as a hyponymy, i.e., its classes have an is-a relationship to one
another:
T
S
⊂ T
C
⊂ T
IE
⊂ T
MT
. With this proposal, we intend to stimulate a discussion on a more unambiguous
classification of treemaps and, furthermore, broaden what is understood by the concept of treemap itself.
1 INTRODUCTION
Treemaps are well established visualization techniques
for tree-structured data and hierarchically structured
data (McNabb and Laramee, 2017). Such data is
prevalent in almost all application domains, includ-
ing demographics (Jern et al., 2009), business intel-
ligence (Roberts and Laramee, 2018), health (Chaz-
ard et al., 2006), and software development (Merino
et al., 2018). Since a large part of today’s data
sets is tree structured—either inherently or otherwise
supplemented—the treemap is a versatile tool for in-
formation visualization. Within the past three decades,
over 300 hierarchy visualization techniques (including
traditional treemaps) and variations have been pro-
posed (Schulz, 2011). The main task of a treemap
is to map the structure of a data set and at the same
time to enable additional visual variables per data el-
ement (Carpendale, 2003) (see Figure 1). Thereby,
a treemap can be varied and adjusted using different
layout algorithms (Vernier et al., 2018) and additional
visual variables, visual metaphors, and interaction tech-
niques (Limberger et al., 2019).
Although there seems to be some consensus on
whether a visualization technique is called a treemap or
not (“property of containment”, Johnson 1993), there
are different views on how strictly to adhere to the con-
tainment metaphor. Bubble Treemaps (G
¨
ortler et al.,
a
https://orcid.org/0000-0002-7885-9857
b
https://orcid.org/0000-0003-3861-5759
c
https://orcid.org/0000-0002-9111-4809
2017) and BeamTrees (van Ham and van Wijk, 2003)
are two examples. This vague use of the term treemap
and the lack of consolidation of the different concepts
makes it difficult to deal with individual cases, com-
plicates summary statements, and might constrain a
deeper understanding.
We propose a taxonomy of four classes of visual-
ization techniques resulting mainly from the encoding
and representation of parent-child relationships. The
taxonomy considers typical properties of layout and
geometry representations and is itself a hyponymy.
Each class contains common hierarchy visualization
techniques that could be called treemaps. In a brief
discussion, we emphasize the applicability of and ex-
tension points to this taxonomy. Our goal is a more
unambiguous classification of treemaps and a strength-
ened concept of treemap categories. Together, these
could form a basis for discussions of limitations, guide-
lines, and generalizations of techniques and, further-
more, facilitate the identification and differentiation of
such techniques for domain-specific applications.
2 FOUNDATION OF TREEMAPS
For the last 30 years, the treemap visualization tech-
nique was extended, refined, and used in different
contexts. This adaptation process extended the scope
of and expectations from treemaps for visualization
designers and users. Here, we want to recapitulate
the original forces and predecessors leading to the
Scheibel, W., Trapp, M., Limberger, D. and Döllner, J.
A Taxonomy of Treemap Visualization Techniques.
DOI: 10.5220/0009153902730280
In Proceedings of the 15th International Joint Conference on Computer Vision, Imaging and Computer Graphics Theory and Applications (VISIGRAPP 2020) - Volume 3: IVAPP, pages
273-280
ISBN: 978-989-758-402-2; ISSN: 2184-4321
Copyright
c
2022 by SCITEPRESS – Science and Technology Publications, Lda. All rights reserved
273
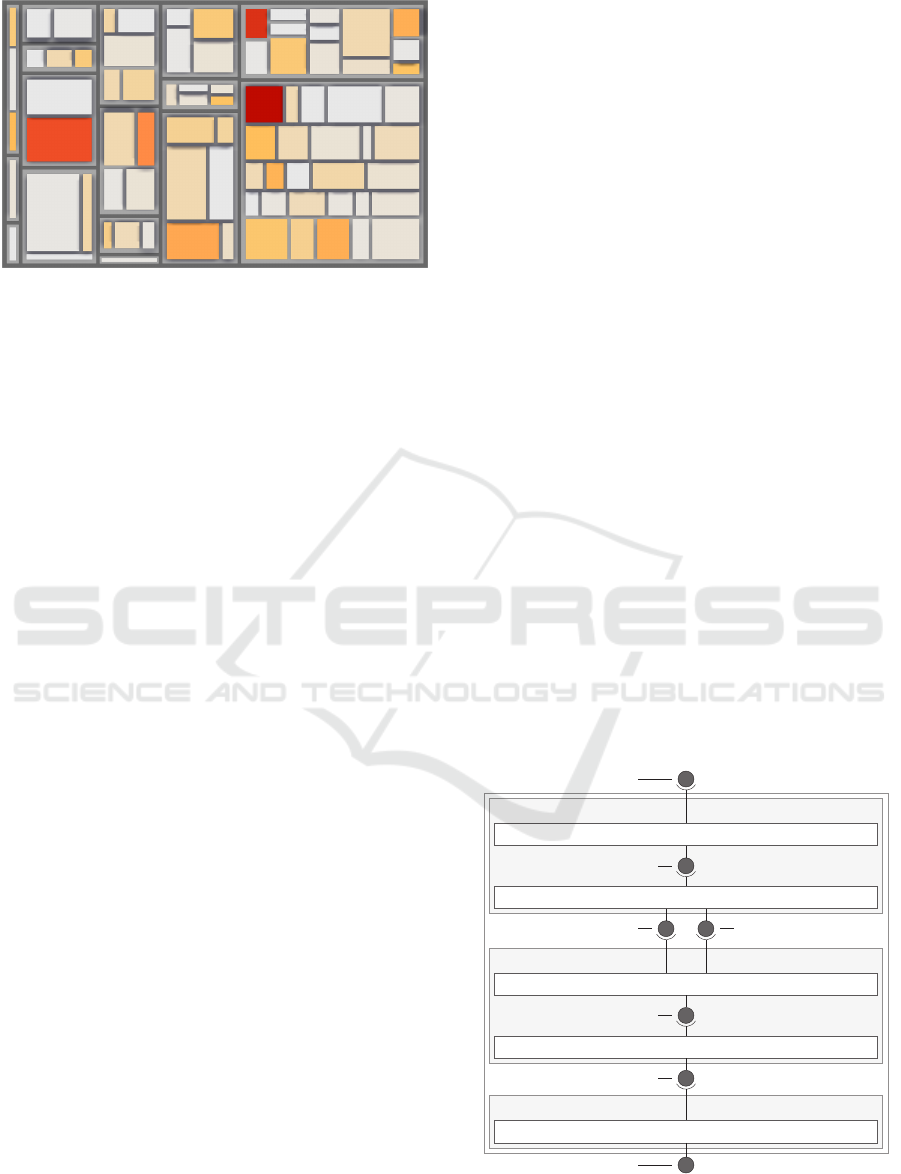
Figure 1: An example of a 2D treemap depicting software
system data using area and color mapping as well as nesting.
first treemap visualization technique and introduce a
conceptual visualization pipeline that seems common
to all hierarchy visualization techniques. Further, we
review other generalization approaches for treemaps.
Predecessors of Treemaps.
Upon looking back
from the first mentioning of a treemap, the preced-
ing ingredients for this visualization technique can be
found in statistical cartograms, mosaic displays, and
nested depiction for hierarchical components. The
early treemaps are a skilled combination of those tech-
niques. One original building block is the statistical
cartogram (Raisz, 1934). These manually designed
cartograms depicted geographic and demographic data
by derivation of rectangular diagrams. Thereby, ad-
jacency of geographic locations were maintained and
the rectangle for a location could be varied in size de-
pending on the demographic data. These properties
are now backed by algorithms and attainable by IT
systems as well (van Kreveld and Speckmann, 2007).
A second building block, the mosaic display (Friendly,
2002), uses an algorithmic approach to dissect the
surface for depiction. The mosaic display appeared
around 1877 and gained scientific attention in 1981.
The technique uses a two-dimensional subdivision of
a rectangle based on categorical distribution for data
points in two attributes—or more using scatter-plot
techniques. The main insights from those diagrams
are the distribution of data items among different cate-
gories. That is, treemaps were anecdotally referred to
as “large weighted Venn diagrams” (Johnson, 1993).
A third building block is the depiction of hierarchi-
cal relations using nesting. For example, they can
be found with contour models (Johnston, 1969) and
Nassi-Shneiderman-Diagrams (Nassi and Shneider-
man, 1973), used for depiction of hierarchical com-
ponents of algorithms. A combination of these ap-
proaches resulted in the first treemap visualization
technique (Johnson and Shneiderman, 1991).
Treemap Visualization Pipeline.
We assume that
the creation of visual representations from data, e.g.,
the transformation of tree-structured data into images
from tree maps, can be understood as a visualization
pipeline. This pipeline can be a part of an interactive
feedback loop of creating images from data, perceiving
these images, and gaining insights—the visualization
process (Figure 3). Within this process, the visualiza-
tion pipeline is represented using three phases, namely
Preprocessing, Mapping, and Image Synthesis. The
required algorithms to create a treemap visualization
from raw data are associated to one, or sometimes
multiple, phases of this pipeline. Thereby, some algo-
rithms are specific to treemap visualization and others
are more generally applicable in the fields of data pro-
cessing and information visualization. The specifics
for treemap visualization techniques are prominent
in the mapping phase and the geometry phase, i.e.,
these phases highly contribute to the appearance of a
treemap visualization (Figure 2).
Generalization on Treemaps.
The similarities of
treemap visualizations, as proposed by Shneiderman
and Johnson, to other hierarchy visualization tech-
niques were used before to provide means of general-
ization of hierarchy visualization techniques. As such,
Schulz et al. coined the term implicit hierarchy visual-
izations (Schulz et al., 2011a) as a category of visual-
ization techniques that uses implicit, i.e., non-drawn,
metaphors to represent the parent-child relationships.
Later, Schulz et al. presented a generative layout ap-
proach for rooted tree drawings that could be used to
create a wide range (and mixed use) of visualization
Preprocessing
Mapping
Image Synthesis
Analysis
Preprocessing & Filtering
Layouting
Geometry Creation
Rendering
Problem Data
Visualization Data
TopologyAttributes
Layout
Geometry
Image
Figure 2: Concept of a hierarchy visualization pipeline in-
cluding the tree structure (topology), per-node attributes, and
the spatialization process of this abstract data.
IVAPP 2020 - 11th International Conference on Information Visualization Theory and Applications
274

Visualization Pipeline
User
Preprocessing
Mapping Image Synthesis
Perception
& Cognition
Exploration
API
Problem Data Focus Data
Geometry
Image
KnowledgeConfiguration
Figure 3: Illustration of the visualization process and the included visualization pipeline. Adapted from van Wijk (2005).
techniques with implicit and explicit edge represen-
tations (Schulz et al., 2013). Likewise, Baudel and
Broeksema discussed a design space for rectangular,
sequential, and space-filling treemap layouts (Baudel
and Broeksema, 2012), creating an own set of treemap
visualization techniques.
3 CATEGORIES
Throughout the community of information visualiza-
tion, there seems to be some consensus on the visual-
ization techniques that may be called a treemap. Disre-
garding their differences, the emerged set of common
characteristics is as follows:
•
First, a treemap is a visualization technique suit-
able to depict tree-structured data.
•
There is a representation of the parent-child rela-
tionships without use of explicit edge links, i.e.,
the containment metaphor (Schulz et al., 2011a).
•
The depiction of leaf nodes implies an area or
volume in the geometry space (Park et al., 2018).
•
The representation of sibling nodes should be guar-
anteed to be non-overlapping (Johnson and Shnei-
derman, 1991).
In other words, the prominent property for treemaps is
the visual containment in the depiction, which implies
a containment within the layout as well. Empirically,
the technique in question allows for at least one of
either area, volume, or color for attribute mapping
of leaf nodes. More effective treemap visualization
techniques allow for at least two visual variables for
attribute mapping of leaf nodes.
Based upon this, we believe the term treemap is
not only suitable for the first treemap introduced by
Shneiderman and Johnson but for a broader range of
hierarchy visualization techniques. To contribute to
the discussion, we propose four different sets of char-
acteristics that could be used to distinguish between
treemaps, tree visualization techniques, and general
hierarchy visualization techniques (H ):
• the Space-filling Treemap T
S
,
• the Containment Treemap T
C
,
• the Implicit Edge Representation Tree T
IE
,
• and the Mapped Tree T
MT
.
These categories focus on the characteristics of the
spatialization process (resulting in the layout) and the
visual representation in geometry space. Thereby, each
category is a superset of the previous one, forming a
hierarchy of tree visualization techniques. This prop-
erty allows to categorize the taxonomy itself as a hy-
ponymy. The four categories are motivated and defined
as follows.
Space-filling Treemap.
A space-filling treemap re-
sults from a recursive subdivision of a surface (John-
son and Shneiderman, 1991) or an
n
-dimensional
cube (Johnson, 1993). The main characteristic is the
full subdivision and distribution of a parents’ surface
or volume for its children, resulting in space-filling
depictions of the leaf nodes. This category of treemaps
includes not only subdivisions of rectangles but oth-
ers as general rectangular (Wattenberg, 2005), convex
polygonal (Balzer and Deussen, 2005; Wang et al.,
2019), and non-convex polygonal (Auber et al., 2013)
partitions as well (Figure 5).
Containment Treemap.
The category of Contain-
ment Treemaps extends Space-filling Treemaps by loos-
ening the space-filling property. This still requires that
child nodes are located within their parent surfaces
but they must not utilize all the space of the parent.
Mainly, hierarchy visualization techniques from this
category are currently considered treemap visualiza-
tion techniques. Typically, the corresponding layouts
are created using packing algorithms (Yamaguchi and
Itoh, 2003; Wettel and Lanza, 2008; Scheibel et al.,
2018) (Figure 6). Another approach is the transfor-
mation of the treemap layout, e.g. for Generalized
Treemaps (Vliegen et al., 2006). Similarly to space-
filling treemaps, containment treemaps allow for dif-
ferent geometrical shapes as well, e.g., circles (Wetzel,
2003; G
¨
ortler et al., 2017) and ellipses (Collin et al.,
2007).
A Taxonomy of Treemap Visualization Techniques
275
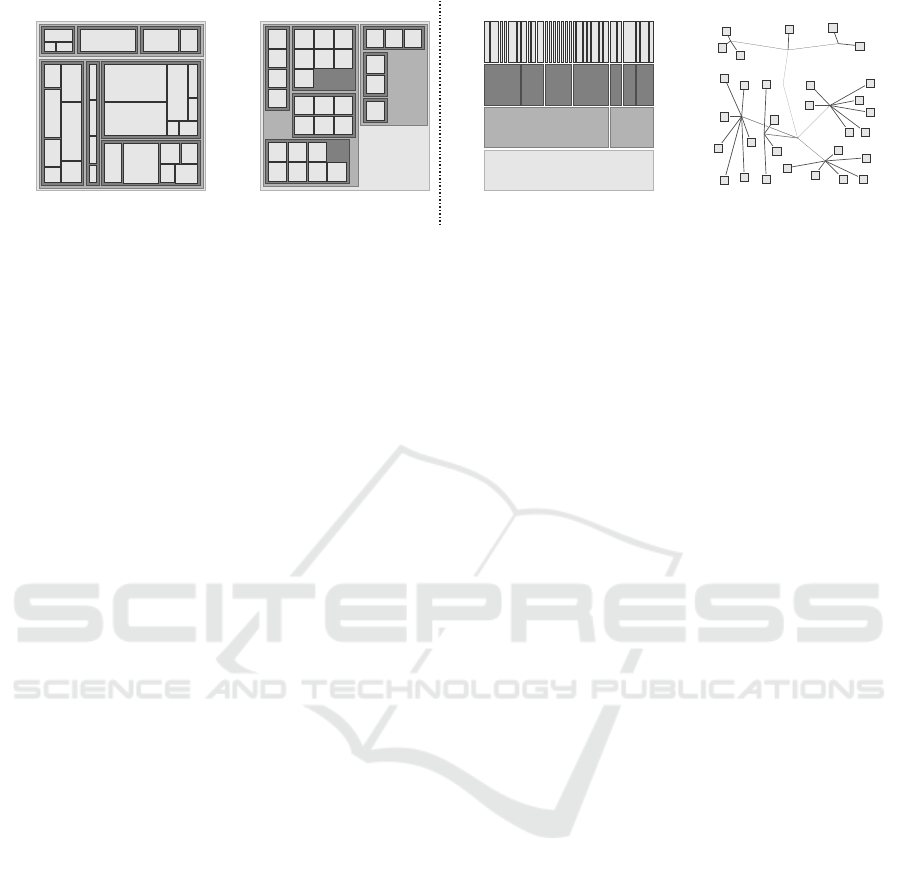
T
S
Space-filling Treemap
T
C
Containment Treemap
T
IE
Implicit Edge Rep-
resentation Tree
T
MT
Mapped Tree
⊂ ⊂ ⊂
Figure 4: The four proposed treemap categories, namely Space-filling Treemap, Containment Treemap, Implicit Edge Represen-
tation Tree, and Mapped Tree. Each category includes their predecessors, building a more general category. The dotted line
highlights the observed current border, whether a visualization technique is called a treemap.
Implicit Edge Representation Tree.
When loosen-
ing the containment property and allowing all types of
implicit edge representations (Schulz et al., 2011a),
i.e., containment, adjacency, and overlap, an even
broader set of visualization techniques can be labeled
as treemaps. With this set of characteristics, visual-
ization techniques that were created using transforma-
tions on treemap layouts, e.g., Cascaded Treemaps (L
¨
u
and Fogarty, 2008) and the BeamTree (van Ham and
van Wijk, 2003), can be considered treemaps as well.
In fact, their goal is to “convey the same contain-
ment relationship” (L
¨
u and Fogarty, 2008) and effec-
tively do so. Applying the idea of layout postprocess-
ings to one-dimensional treemap layouts, the results
are icicle plots (Kruskal and Landwehr, 1983), and
with additional projection they can result in sunburst
views (Stasko et al., 2000), and other derived tech-
niques (Webber et al., 2006; Holten, 2006) (Figure 7).
This is valid as implicit edge representations fulfill the
containment property during layouting as well but the
depiction in geometry space may drop the visual cues
for containment (Johnson, 1993).
Mapped Tree.
While all previously proposed cat-
egories use an implicit edge representation, there
are tree visualization techniques that use other rela-
tion encoding techniques such as vicinity or explicit
links (Schulz et al., 2013). Most of them share the
invariant of overlap-free spatialization across node
siblings, resulting in an unambiguous bidirectional
mapping of the tree-structure to the depiction. Such a
depiction is provided if the underlying tree layout is
based on the property of containment, even if the re-
sulting visualization does not encode the parent-child
relationship using an implicit edge representation. Ex-
emplary visualization techniques for the Mapped Tree
category include space-optimized trees (Nguyen and
Huang, 2002), contour maps (Kubota et al., 2006),
and point-based tree depictions (Schulz et al., 2011b)
(Figure 8). Assuming a bidirectional mapping of lay-
out algorithms, “[c]ontainment based treemap algo-
rithms [. . . ] form the core of a powerful and extensible
grand unified theory of hierarchical visualization—the
treemap” (Johnson, 1993).
4 DISCUSSION
When we categorize techniques of hierarchy visual-
ization we aim at the most specific category. As an
example, the appropriate category of a CodeCity visu-
alization is a containment treemap
T
C
. Through the
taxonomy’s hyponymous nature, the more general cat-
egories
T
IE
and
T
MT
are valid as well, and so is the
category of general hierarchy visualization techniques
H
(Figure 9). However, we want to argue for a more
specific use of terms (Table 1).
The proposed taxonomy is derived from visual fea-
tures of the visualization techniques. Common to all
categories is the property of containment from their
underlying layouts. As alternatives to the focus on vi-
sual features, the categorization could be based on the
initial use of a containment-based layout. This would
render all techniques that are classified as mapped trees
T
MT
as treemap.
The actual boundary between mapped trees
T
MT
and general hierarchy visualization techniques
H
re-
mains to be determined. We argue that only with a
systematic top-down or bottom-up approach that ad-
heres to the containment metaphor during layouting,
the resulting visualization technique can result in a
treemap. That is, hierarchy visualization techniques
using other approaches may not ensure overlap-free
sibling nodes for the underlying layouts, e.g., Pythago-
ras Trees (Beck et al., 2014). For those techniques,
we observe their categorization as mapped tree
T
MT
as
soon as they achieve overlap-free sibling nodes (Munz
et al., 2019).
Regarding the mixed use of treemap visualization
IVAPP 2020 - 11th International Conference on Information Visualization Theory and Applications
276
Hybrid Lay-
out Treemap
Treemap with
Bound Aspect Ratio
Voronoi Treemap
GosperMap
Jigsaw Treemap
T
S
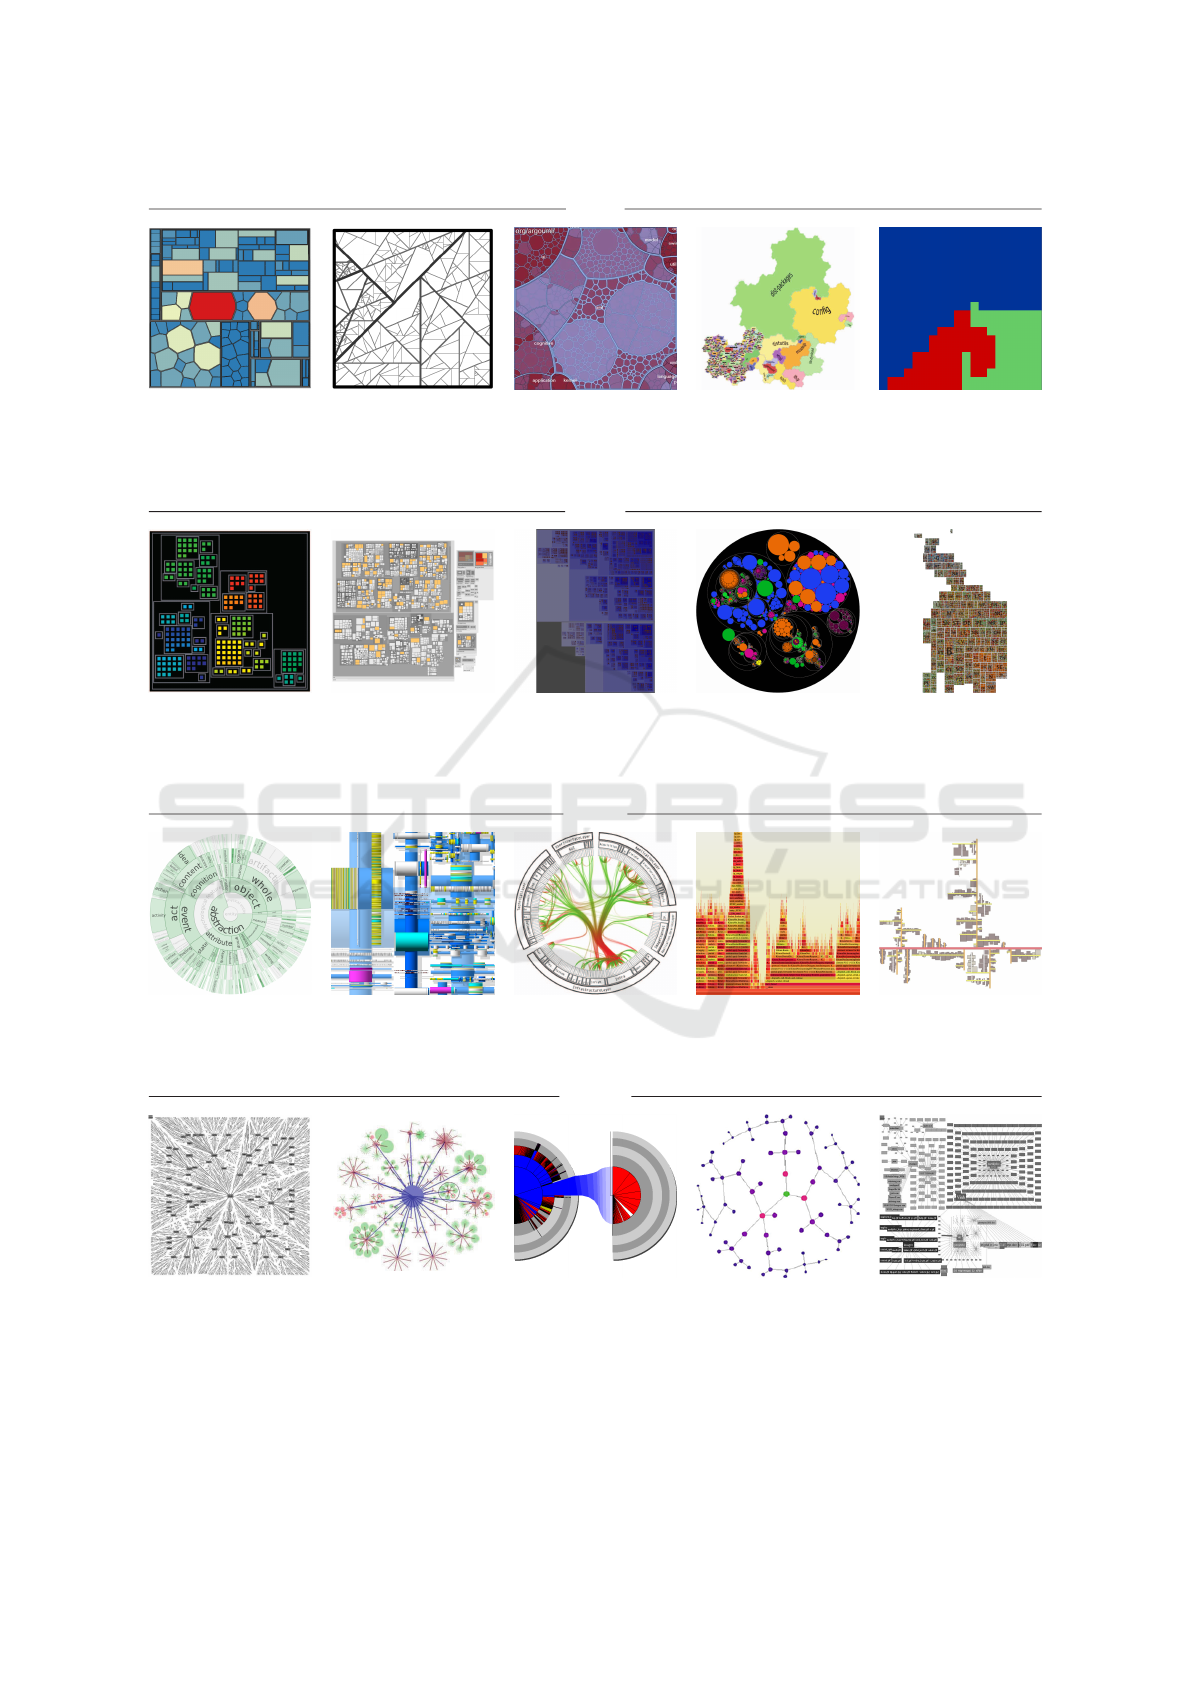
Figure 5: Examples of treemaps from the category Space-Filling Treemap. Image courtesy from left to right: (Hahn and
D
¨
ollner, 2017), (de Berg et al., 2011), (Balzer et al., 2005), (Auber et al., 2013), and (Wattenberg, 2005).
Data-Jewelry Box
EvoCells Treemap
CodeCity
Pebbles Treemap
Rectangular Hier-
archical Cartogram
T
C
Figure 6: Examples of treemaps from the category Containment Treemap. Image courtesy from left to right: (Itoh et al., 2004),
(Scheibel et al., 2018), (Wettel and Lanza, 2007), (Wetzel, 2003), and (Slingsby et al., 2010).
Sunburst View
BeamTree
Bundle View
Flame Graphs
Software Cities
T
IE
Figure 7: Examples of treemaps from the category Implicit Edge-Representation Treemap. Image courtesy from left to right:
(Stasko et al., 2000), (van Ham and van Wijk, 2003), (Holten, 2006), (Gregg, 2016), and (Steinbr
¨
uckner and Lewerentz, 2013).
Space-optimized Tree
RINGS
Information Slices
Tree Drawings
ENCCON
T
MT
Figure 8: Examples of treemaps from the category Mapped Tree. Image courtesy from left to right: (Nguyen and Huang, 2002),
(Tee Teoh and Kwan-Liu, 2002), (Andrews and Heidegger, 1998), (Toosi and Nikolov, 2014), and (Nguyen and Huang, 2005).
A Taxonomy of Treemap Visualization Techniques
277

Thematic Soft-
ware Maps
Bubble Hierarchies
BaobabView
Tree of Percentage
Pythagoras Tree
H
Figure 9: Examples of visualization techniques that does not relate to any proposed class and are therefore associated with
H
.
Image courtesy from left to right: (Kuhn et al., 2010), (Hlawatsch et al., 2014), (Andrews and Heidegger, 1998), (van den
Elzen and van Wijk, 2011), and (Kleiner and Hartigan, 1981), and (Beck et al., 2014).
with other approaches, this taxonomy is explicitly de-
signed ignorant. As a debatable example, the mixed-
projection treemap could be categorized as either
T
S
or
T
IE
(Limberger et al., 2017). Another example is the
adjacent usage of treemaps by means of small multi-
ples. It may not inherently render the whole visualiza-
tion a treemap, although the composition could be la-
beled a space-filling treemap
T
S
(Scheibel et al., 2016).
A constrasting example thereto is the CodeSurveyor
visualization that uses an overlap-free distribution of
Table 1: An association of different hierarchy visualization
techniques to the proposed taxonomy. For direct comparison,
this table includes hierarchy visualization techniques
H
that
are not covered by this taxonomy as well. The
•
and
◦
dots
denote the most specific category and associated hyperonyms
(more general categories), respectively.
Visualization Technique T
S
T
C
T
IE
T
MT
H
BeamTree (van Ham and van Wijk, 2003) • ◦ ◦
Bundle View (Holten, 2006) • ◦ ◦
Cactus Tree (Dang and Forbes, 2017) •
CodeCity (Wettel and Lanza, 2008) • ◦ ◦ ◦
Contrast Treemaps (Tu and Shen, 2007) • ◦ ◦ ◦ ◦
Data Jewelry Box (Itoh et al., 2004) • ◦ ◦ ◦
Ellimaps (Collin et al., 2007) • ◦ ◦ ◦ ◦
EvoCells (Scheibel et al., 2018) • ◦ ◦ ◦
Flame Graph (Gregg, 2016) • ◦ ◦
Gosper Map (Auber et al., 2013) • ◦ ◦ ◦ ◦
Icicle Plot (Kruskal and Landwehr, 1983) • ◦ ◦
Information Slices (Andrews and Heidegger, 1998) • ◦
Overlap-free Pythagoras Tree (Munz et al., 2019) • ◦
Pebbles Treemap (Wetzel, 2003) • ◦ ◦ ◦
Pythagoras Tree (Beck et al., 2014) •
Quantum Treemaps (Bederson et al., 2002) • ◦ ◦ ◦
Slice’n’Dice Treemap (Johnson and Shneiderman, 1991) • ◦ ◦ ◦ ◦
Software Cities (Steinbr
¨
uckner and Lewerentz, 2013) • ◦
Space-Optimized Tree (Nguyen and Huang, 2002) • ◦
Stable Voronoi Treemap (Hahn et al., 2014) • ◦ ◦ ◦ ◦
Sunburst View (Stasko et al., 2000) • ◦ ◦
Tree Drawings (Toosi and Nikolov, 2014) • ◦
Treemaps with Bound Aspect Ratio (de Berg et al., 2011) • ◦ ◦ ◦ ◦
Voronoi Treemap (Balzer et al., 2005) • ◦ ◦ ◦ ◦
the uppermost level and, in fact, should be labeled a
containment treemap T
C
(Hawes et al., 2015).
5 CONCLUSIONS
This paper proposes a taxonomy for treemap visual-
ization techniques, namely Space-filling Treemap
T
S
,
Containment Treemap
T
C
, Implicit Edge Representa-
tion Tree
T
IE
, and Mapped Tree
T
MT
. This is feasible
because all associated techniques adhere to the prop-
erty of containment, either in their visual representa-
tion or in their underlying layout. Furthermore, the
taxonomy should clarify the labeling of visualization
techniques as treemaps and improve communication
on their characteristics, visual metaphors, internally
used algorithms, and interaction techniques.
As future work, the classification of existing hier-
archy visualization techniques by means of the pro-
posed taxonomy should be continued. We suggest
to integrate the conceptual model of these different
classes into hierarchy visualization systems and their
APIs (Scheibel et al., 2019). Right now, we stimu-
late this discussion on a classification of treemaps and,
probably, a broadening of the concept of treemaps and
their role within the field of hierarchy visualization.
ACKNOWLEDGEMENTS
This work was partially funded by the German Federal
Ministry for Economic Affairs and Energy (BMWi,
ZIM) within the project “TASAM”.
REFERENCES
Andrews, K. and Heidegger, H. (1998). Information slices:
Visualising and exploring large hierarchies using cas-
IVAPP 2020 - 11th International Conference on Information Visualization Theory and Applications
278

cading, semi-circular discs. In Proc. InfoVis, pages
9–11. IEEE.
Auber, D., Huet, C., Lambert, A., Renoust, B., Sallaberry, A.,
and Saulnier, A. (2013). Gospermap: Using a gosper
curve for laying out hierarchical data. Transactions on
Visualization and Computer Graphics, 19(11):1820–
1832. IEEE.
Balzer, M. and Deussen, O. (2005). Voronoi treemaps. In
Proc. InfoVis, pages 49–56. IEEE.
Balzer, M., Deussen, O., and Lewerentz, C. (2005). Voronoi
treemaps for the visualization of software metrics. In
Proc. SoftVis, pages 165–172. ACM.
Baudel, T. and Broeksema, B. (2012). Capturing the design
space of sequential space-filling layouts. Transactions
on Visualization and Computer Graphics, 18(12):2593–
2602. IEEE.
Beck, F., Burch, M., Munz, T., Di Silvestro, L., and
Weiskopf, D. (2014). Generalized pythagoras trees
for visualizing hierarchies. In Proc. IVAPP, pages
17–28. ScitePress.
Bederson, B. B., Shneiderman, B., and Wattenberg, M.
(2002). Ordered and quantum treemaps: Making effec-
tive use of 2d space to display hierarchies. Transactions
on Graphics, 21(4):833–854. ACM.
Carpendale, M. S. T. (2003). Considering visual variables as
a basis for information visualization. Technical report,
University of Calgary, Canada. Nr. 2001-693-14.
Chazard, E., Puech, P., Gregoire, M., and Beuscart, R. (2006).
Using treemaps to represent medical data. Studies in
Health Technology and Informatics, 124:522–527.
Collin, P., Otjacques, B., Gobert, X., Noirhomme, M., and
Feltz, F. (2007). Visualizing the activity of a web-based
collaborative platform. In Proc. iV, pages 251–256.
IEEE.
Dang, T. and Forbes, A. (2017). CactusTree: A tree draw-
ing approach for hierarchical edge bundling. In Proc.
PacificVis, pages 210–214. IEEE.
de Berg, M., Speckmann, B., and van der Weele, V. (2011).
Treemaps with bounded aspect ratio. In Proc. ISAAC,
pages 260–270. Springer.
Friendly, M. (2002). A brief history of the mosaic display.
Journal of Computational and Graphical Statistics,
11(1):89–107. Taylor & Francis.
G
¨
ortler, J., Schulz, C., Weiskopf, D., and Deussen, O.
(2017). Bubble treemaps for uncertainty visualization.
Transactions on Visualization and Computer Graphics,
24(1):719–728. IEEE.
Gregg, B. (2016). The flame graph. Communications,
59(6):48–57. ACM.
Hahn, S. and D
¨
ollner, J. (2017). Hybrid-treemap layouting.
In Proc. EuroVis – Short Papers, pages 79–83. EG.
Hahn, S., Tr
¨
umper, J., Moritz, D., and D
¨
ollner, J. (2014).
Visualization of varying hierarchies by stable layout
of voronoi treemaps. In Proc. IVAPP, pages 50–58.
SciTePress.
Hawes, N., Marshall, S., and Anslow, C. (2015). Codesur-
veyor: Mapping large-scale software to aid in code
comprehension. In Proc. VISSOFT, pages 96–105.
IEEE.
Hlawatsch, M., Burch, M., and Weiskopf, D. (2014). Bubble
hierarchies. In Proc. CAe, pages 77–80. ACM.
Holten, D. (2006). Hierarchical edge bundles: Visual-
ization of adjacency relations in hierarchical data.
Transactions on Visualization and Computer Graphics,
12(5):741–748. IEEE.
Itoh, T., Kajinaga, Y., Yamaguchi, Y., and Ikehata, Y. (2004).
Hierarchical data visualization using a fast rectangle-
packing algorithm. Transactions on Visualization and
Computer Graphics, 10:302–313. IEEE.
Jern, M., Rogstadius, J., and
˚
Astr
¨
om, T. (2009). Treemaps
and choropleth maps applied to regional hierarchical
statistical data. In Proc. iV, pages 403–410. IEEE.
Johnson, B. S. (1993). Treemaps: Visualizing Hierarchi-
cal and Categorical Data. PhD thesis, University of
Maryland. UMI Order No. GAX94-25057.
Johnson, B. S. and Shneiderman, B. (1991). Tree-maps:
A space-filling approach to the visualization of hier-
archical information structures. In Proc. VIS, pages
284–291. IEEE.
Johnston, J. B. (1969). Structure of multiple activity algo-
rithms. In Proc. SOSP, pages 80–82. ACM.
Kleiner, B. and Hartigan, J. A. (1981). Representing points
in many dimensions by trees and castles. Journal of the
American Statistical Association, 76(374):260–269.
Kruskal, J. B. and Landwehr, J. M. (1983). Icicle plots: Bet-
ter displays for hierarchical clustering. The American
Statistician, 37(2):162–168. Taylor & Francis.
Kubota, H., Nishida, T., and Sumi, Y. (2006). Visualization
of contents archive by contour map representation. In
Proc. Annual Conference of the Japanese Society for
Artificial Intelligence, pages 19–32. Springer.
Kuhn, A., Erni, D., Loretan, P., and Nierstrasz, O. (2010).
Software cartography: thematic software visualiza-
tion with consistent layout. Journal of Software
Maintenance and Evolution: Research and Practice,
22(3):191–210. Wiley.
Limberger, D., Scheibel, W., D
¨
ollner, J., and Trapp, M.
(2019). Advanced visual metaphors and techniques
for software maps. In Proc. VINCI, pages 1–8. ACM.
Limberger, D., Scheibel, W., Trapp, M., and D
¨
ollner, J.
(2017). Mixed-projection treemaps: A novel approach
mixing 2d and 2.5d treemaps. In Proc. iV, pages 164–
169. IEEE.
L
¨
u, H. and Fogarty, J. (2008). Cascaded treemaps: Examin-
ing the visibility and stability of structure in treemaps.
In Proc. Graphics Interface, pages 259–266. Canadian
Information Processing Society.
McNabb, L. and Laramee, R. S. (2017). Survey of Surveys
(SoS) - mapping the landscape of survey papers in
information visualization. Computer Graphics Forum,
36(3):589–617. EG.
Merino, L., Ghafari, M., Anslow, C., and Nierstrasz, O.
(2018). A systematic literature review of software visu-
alization evaluation. Journal of Systems and Software,
144:165–180. Elsevier.
Munz, T., Burch, M., van Benthem, T., Poels, Y., Beck,
F., and Weiskopf, D. (2019). Overlap-free draw-
ing of generalized pythagoras trees for hierarchy vi-
sualization. arXiv Computing Research Repository,
abs/1907.12845.
A Taxonomy of Treemap Visualization Techniques
279

Nassi, I. and Shneiderman, B. (1973). Flowchart tech-
niques for structured programming. SIGPLAN Notices,
8(8):12–26. ACM.
Nguyen, Q. V. and Huang, M. L. (2002). Improvements of
space-optimized tree for visualizing and manipulating
very large hierarchies. In Selected Papers Pan-Sydney
Workshop on Visualisation, VIP ’02, pages 75–81. Aus-
tralian Computer Society, Inc.
Nguyen, Q. V. and Huang, M. L. (2005). EncCon: An ap-
proach to constructing interactive visualization of large
hierarchical data. Information Visualization, 4(1):1–21.
Palgrave.
Park, D., Drucker, S. M., Fernandez, R., and Elmqvist, N.
(2018). ATOM: A grammar for unit visualizations.
Transactions on Visualization and Computer Graphics,
24(12):3032–3043. IEEE.
Raisz, E. (1934). The rectangular statistical cartogram. Ge-
ographical Review, 24(2):292–296. American Geo-
graphical Society, Wiley.
Roberts, R. C. and Laramee, R. S. (2018). Visualising busi-
ness data: A survey. Information, 9(11):285:1–54.
MDPI.
Scheibel, W., Hartmann, J., and D
¨
ollner, J. (2019). De-
sign and implementation of web-based hierarchy vi-
sualization services. In Proc. IVAPP, pages 141–152.
SciTePress.
Scheibel, W., Trapp, M., and D
¨
ollner, J. (2016). Interactive
revision exploration using small multiples of software
maps. In Proc. IVAPP, pages 131–138. SciTePress.
Scheibel, W., Weyand, C., and D
¨
ollner, J. (2018). EvoCells –
a treemap layout algorithm for evolving tree data. In
Proc. IVAPP, pages 273–280. SciTePress.
Schulz, H.-J. (2011). Treevis.net: A tree visualization refer-
ence. Computer Graphics and Applications, 31(6):11–
15. IEEE.
Schulz, H.-J., Akbar, Z., and Maurer, F. (2013). A generative
layout approach for rooted tree drawings. In Proc.
PacificVis, pages 225–232. IEEE.
Schulz, H.-J., Hadlak, S., and Schumann, H. (2011a). The
design space of implicit hierarchy visualization: A
survey. Transactions on Visualization and Computer
Graphics, 17(4):393–411. IEEE.
Schulz, H.-J., Hadlak, S., and Schumann, H. (2011b). Point-
based visualization for large hierarchies. Transactions
on Visualization and Computer Graphics, 17(5):598–
611. IEEE.
Slingsby, A., Dykes, J., and Wood, J. (2010). Rectangu-
lar hierarchical cartograms for socio-economic data.
Journal of Maps, 6(1):330–345. Taylor & Francis.
Stasko, J., Catrambone, R., Guzdial, M., and McDonald, K.
(2000). An evaluation of space-filling information visu-
alizations for depicting hierarchical structures. Techni-
cal Report 5, Georgia Institute of Technology, Atlanta,
GA, USA. GVU Technical Report;GIT-GVU-00-03.
Steinbr
¨
uckner, F. and Lewerentz, C. (2013). Understanding
software evolution with software cities. Information
Visualization, 12(2):200–216. SAGE.
Tee Teoh, S. and Kwan-Liu, M. (2002). Rings: A tech-
nique for visualizing large hierarchies. In Proc. Graph
Drawing, pages 268–275. Springer.
Toosi, F. G. and Nikolov, N. S. (2014). Circular tree drawing
by simulating network synchronisation dynamics and
scaling. In Graph Drawing, pages 511–512. Springer.
Tu, Y. and Shen, H. W. (2007). Visualizing changes of
hierarchical data using treemaps. Transactions on Vi-
sualization and Computer Graphics, 13(6):1286–1293.
IEEE.
van den Elzen, S. and van Wijk, J. J. (2011). BaobabView:
Interactive construction and analysis of decision trees.
In Proc. VAST, pages 151–160. IEEE.
van Ham, F. and van Wijk, J. J. (2003). Beamtrees: Com-
pact visualization of large hierarchies. Information
Visualization, 2(1):31–39. Palgrave.
van Kreveld, M. and Speckmann, B. (2007). On rectangular
cartograms. Computational Geometry, 37(3):175–187.
Elsevier.
Vernier, E. F., Telea, A. C., and Comba, J. (2018). Quanti-
tative comparison of dynamic treemaps for software
evolution visualization. In Proc. VISSOFT, pages 96–
106. IEEE.
Vliegen, R., van Wijk, J. J., and van der Linden, E. J. (2006).
Visualizing business data with generalized treemaps.
Transactions on Visualization and Computer Graphics,
12(5):789–796. IEEE.
Wang, Y.-C., Lin, F., and Seah, H.-S. (2019). Orthogonal
voronoi diagram and treemap. arXiv Computing Re-
search Repository, abs/1904.02348.
Wattenberg, M. (2005). A note on space-filling visualizations
and space-filling curves. In Proc. InfoVis, pages 181–
186. IEEE.
Webber, R., Herbert, R. D., and Jiang, W. (2006). Space-
filling techniques in visualizing output from computer
based economic models. In Proc. Computing in Eco-
nomics and Finance, volume 67. Soc. for Computa-
tional Economics.
Wettel, R. and Lanza, M. (2007). Visualizing software sys-
tems as cities. In Proc. VISSOFT, pages 92–99. IEEE.
Wettel, R. and Lanza, M. (2008). Visual exploration of
large-scale system evolution. In Proc. WCRE, pages
219–228. IEEE.
Wetzel, K. (2003). pebbles - using circu-
lar treemaps to visualize disk usage.
http://lip.sourceforge.net/ctreemap.html.
Yamaguchi, Y. and Itoh, T. (2003). Visualization of dis-
tributed processes using “Data Jewelry Box” algorithm.
In Proc. CGI, pages 162–169. IEEE.
IVAPP 2020 - 11th International Conference on Information Visualization Theory and Applications
280
