NMF vs. ICA for Light Source Separation under AC Illumination
Ruri Oya, Ryo Matsuoka and Takahiro Okabe
Department of Artificial Intelligence, Kyushu Institute of Technology, Japan
okabe@ai.kyutech.ac.jp
Keywords:
Light Source Separation, Alternating Current, Flicker, NMF, ICA.
Abstract:
Artificial light sources powered by an electric grid change their intensities in response to the grid’s alternating
current (AC). Their flickers are usually too fast to notice with our naked eyes, but can be captured by using
cameras with short exposure time settings. In this paper, we propose a method for light source separation
under AC illumination on the basis of Blind Source Separation (BSS). Specifically, we show that light source
separation results in matrix factorization, since the input images of a scene illuminated by multiple AC light
sources are represented by the linear combinations of the basis images, each of which is the image of the scene
illuminated by only one of the light sources, with the coefficients, each of which is the intensity of the light
source. Then, we make use of Non-negative Matrix Factorization (NMF), because both the pixel values of the
basis images and the intensities of the light sources are non-negative. We experimentally confirmed that our
method using NMF works better than Independent Component Analysis (ICA), and studied the performance
of our method under various conditions: varying exposure times and noise levels.
1 INTRODUCTION
Artificial light sources in our surroundings are of-
ten powered by an electric grid, and therefore their
intensities rapidly change in response to the grid’s
alternating current (AC). Their flickers are usually
too fast to notice with our naked eyes, but can
be captured by using cameras with short exposure
time settings (Vollmer and M¨ollmann, 2015). Such
rapid flickers could make auto white balance unnatu-
ral (Hsu et al., 2008).
Sheinin et al. (Sheinin et al., 2017) propose a
method for light source separation under AC illumi-
nation. Their proposed method decomposes an image
sequence of a scene illuminated by multiple AC light
sources into the images of the scene, each of which is
illuminated by only one of the light sources, and the
temporal intensity profiles of the light sources. They
make use of their self-build coded-exposure camera
synchronized to AC and the dataset of temporal inten-
sity profiles of various light sources, and then achieve
light source separation even for dark scenes such as a
city-scale scene at night. Later, Sheinin et al. (Sheinin
et al., 2018) achieve light source separation under AC
illumination by using consumer rolling-shutter cam-
eras, but still require the dataset of temporal intensity
profiles of various light sources.
In this paper,we propose a method for light source
separation under AC illumination on the basis of
Blind Source Separation (BSS). Specifically, we show
that light source separation results in matrix factoriza-
tion, since the input images are represented by the lin-
ear combinations of the basis images, each of which
is the image of the scene illuminated by only one of
the light sources, with the coefficients, each of which
is the intensity of the light source. Then, we make use
of Non-negative Matrix Factorization (NMF) (Berry
et al., 2007) for BSS, because both the pixel values
of the basis images and the intensities of the light
sources are non-negative.
We conducted a number of experiments and
confirmed that our proposed method using NMF
works better than Independent Component Analy-
sis (ICA) (Hyv¨arinen and Oja, 2000). In addition,
we studied the performance of our method, which is
based on fast flickers of light sources’ intensities, un-
der various conditions: varying exposure times and
noise levels.
Our proposed method based on BSS does not re-
quire the dataset of light sources’ temporal intensity
profiles nor the self-build camera synchronized to AC
in contrast to Sheinin et al. (Sheinin et al., 2017;
Sheinin et al., 2018). Therefore, our method is appli-
cable to image sequences captured by using consumer
cameras and applicable to unknown light sources that
are not included in the dataset, although it is not suited
for dark scenes because the images captured by using
those cameras have low S/N ratios in general.

The main contributions of this study are twofold.
First, we propose a method for light source separation
under AC illumination on the basis of BSS; it does not
require the dataset of light sources’ temporal inten-
sity profiles nor the self-build camera synchronized to
AC. Second, we experimentally confirmed that NMF
works better than ICA for light source separation un-
der AC illumination, and studied the behavior of our
proposed method using NMF under varying exposure
times and noise levels.
2 PROPOSED METHOD
According to the superposition principle of light, an
image of a scene taken under multiple light sources
is represented by a convex combination of the basis
images, each of which is the image taken under one
of the light sources. Specifically, the pixel value i
pcf
of an input image sequence at the p-the pixel (p =
1, 2, 3, ..., P) in the c-th channel (c = 1, 2, 3) and in
the f-th frame ( f = 1, 2, 3, ..., F) is represented as
i
pcf
=
N
∑
n=1
b
pcn
a
nf
. (1)
Here, N is the number of light sources, b
pcn
is the
pixel value of the n-th basis image at the p-th pixel
and in the c-th channel, and a
nf
is the intensity of the
n-th light source in the f-th frame.
We can rewrite eq.(1) in a matrix form as
I
I
I = B
B
BA
A
A, (2)
where I
I
I is the 3P × F matrix consisting of the pixel
values of the input image sequence, B
B
B is the 3P× N
matrix consisting of the pixel values of the N basis
images, and A
A
A is the N × F matrix consisting of the
intensities of the N light sources. Therefore, light
source separation results in the problem of matrix fac-
torization; factorizing the matrix I
I
I of the input image
sequence into the matrix B
B
B of the basis images and the
matrix A
A
A of the light sources’ intensities.
The necessary condition for light source separa-
tion is that the number of equations is larger than or
equal to the number of unknowns: (3P× F) ≥ (3P×
N + N × F). When the number of pixel P is large
enough compared to the number of light sources N,
light source separation is possible if F > N. Our pro-
posed method makes use of NMF (Berry et al., 2007)
for matrix factorization, because both the pixel val-
ues of the basis images and the intensities of the light
sources are non-negative. Specifically, our method es-
timates the matrices B
B
B and A
A
A by the minimization;
min
{B
B
B,A
A
A}
1
2
||I
I
I − B
B
BA
A
A||
2
Fr
(3)
Figure 1: The first three images of the synthetic image se-
quences of (a) Scene 1, (b) Scene 2, and (c) Scene 3.
subject to the conditions that all the elements of the
matrices B
B
B and A
A
A are non-negative. Here, || ||
Fr
stands
for the Frobenius norm of a matrix.
Since the matrix I
I
I is represented by the product
of the matrices B
B
B and A
A
A, there are the ambiguities in
scale and order between those matrices. In addition,
since B
B
BA
A
A = B
B
BU
U
U
−1
U
U
UA
A
A, the ambiguity represented by
the N × N regular matrix U
U
U, that keeps all the ele-
ments of the matrices B
B
BU
U
U
−1
and U
U
UA
A
A non-negative,
could occur.
3 EXPERIMENTS
To confirm the effectiveness of our proposed method,
we conducted qualitative and quantitative evaluation
by using both synthetic and real images.
3.1 NMF vs. ICA
We compared the following three methods for light
source separation under AC illumination.
• NMF (our proposed method) decomposes the in-
put images into the basis images and the light
sources’ intensities according to eq.(3).
• ICA-1 decomposes the input images into the basis
images and the light sources’ intensities so that
the basis images are independent of each other.
• ICA-2 decomposes the input images into the ba-
sis images and the light sources’ intensities so that
the light sources’ intensities are independent of
each other.
In our implementation, we used the alternating least
squares algorithm (Berry et al., 2007) for NMF, and
FastICA (Hyv¨arinen and Oja, 2000) for ICA-1 and
ICA-2.
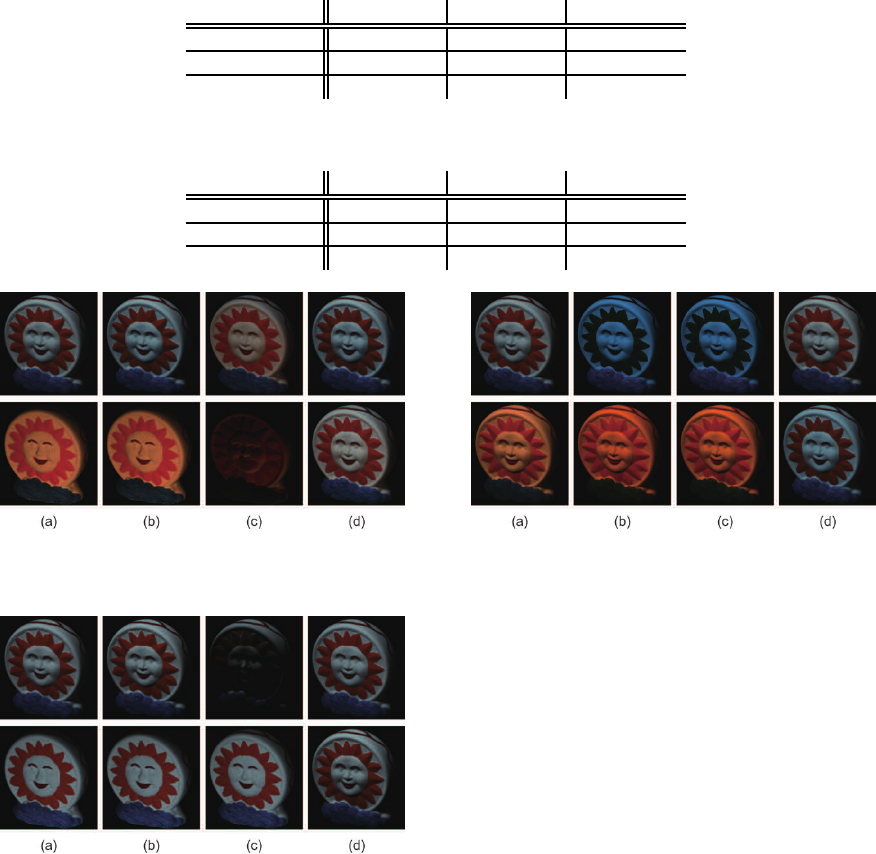
Table 1: The PSNRs of the basis images estimated by using NMF, ICA-1, and ICA-2 for Scenes 1, 2, and 3. The numerical
values in each cell are the PSNRs for the first/second basis images.
method\scene
1 2 3
NMF 52.52/42.22 44.70/53.72 30.97/24.46
ICA-1 17.57/31.06 39.16/20.53 24.39/33.28
ICA-2 23.32/42.20 27.46/46.27 23.38/37.40
Table 2: The RMSEs of the intensity profiles of the light sources estimated by using NMF, ICA-1, and ICA-2 for Scenes 1, 2,
and 3. The numerical values in each cell are the RMSEs for the first/second light sources.
method\scene
1 2 3
NMF 0.001/0.003 0.001/0.004 0.012/0.014
ICA-1 0.023/0.045 0.017/0.017 0.010/0.014
ICA-2 0.036/0.012 0.036/0.012 0.034/0.001
Figure 2: The results of light source separation for Scene 1:
(a) the ground truth of the basis images, and the basis im-
ages estimated by using (b) NMF, (c) ICA-1, and (d) ICA-2.
Figure 3: The results of light source separation for Scene 2:
(a) the ground truth of the basis images, and the basis im-
ages estimated by using (b) NMF, (c) ICA-1, and (d) ICA-2.
Synthetic Images:
We synthesized three input image sequences by using
the two datasets; one is for basis images under vary-
ing light source directions (Barron and Malik, 2015)
and the other is for light sources’ temporal inten-
sity profiles sampled at 26 points per cycle (Sheinin
et al., 2017). We tested three illumination conditions;
a scene is illuminated by two light sources with dif-
ferent colors and from different directions (Scene 1),
those with the same color and from different direc-
tions (Scene 2), and those with different colors and
Figure 4: The results of light source separation for Scene 3:
(a) the ground truth of the basis images, and the basis im-
ages estimated by using (b) NMF, (c) ICA-1, and (d) ICA-2.
from the same direction (Scene 3) as shown in Fig-
ure 1.
Figures 2, 3, and 4 show the results of light source
separation for Scenes 1, 2, and 3 respectively: (a) the
ground truth of the basis images, and the basis images
estimated by using (b) NMF, (c) ICA-1, and (d) ICA-
2. Tables 1 and 2 summarize the PSNRs of the esti-
mated basis images and the RMSEs of the estimated
intensity profiles of the light sources for those scenes
by using NMF, ICA-1, and ICA-2 respectively.
We can see that NMF works well and that its
performance is better than those of ICA-1 and ICA-
2, when both the colors and directions of the light
sources are different (Scene 1) and when only the di-
rections of the light sources are different (Scene 2).
On the other hand, all the methods do not necessarily
work well when the directions of the light sources are
the same (Scene 3). This is because there are shadows
in Scenes 1 and 2. Specifically, since the directions
of the light sources are different in Scenes 1 and 2,
there are some areas that are illuminated by only one
of the light sources. Because we can directly observe
the flickers due to the single light source there, those
shadows could be important clues for light source sep-
aration.
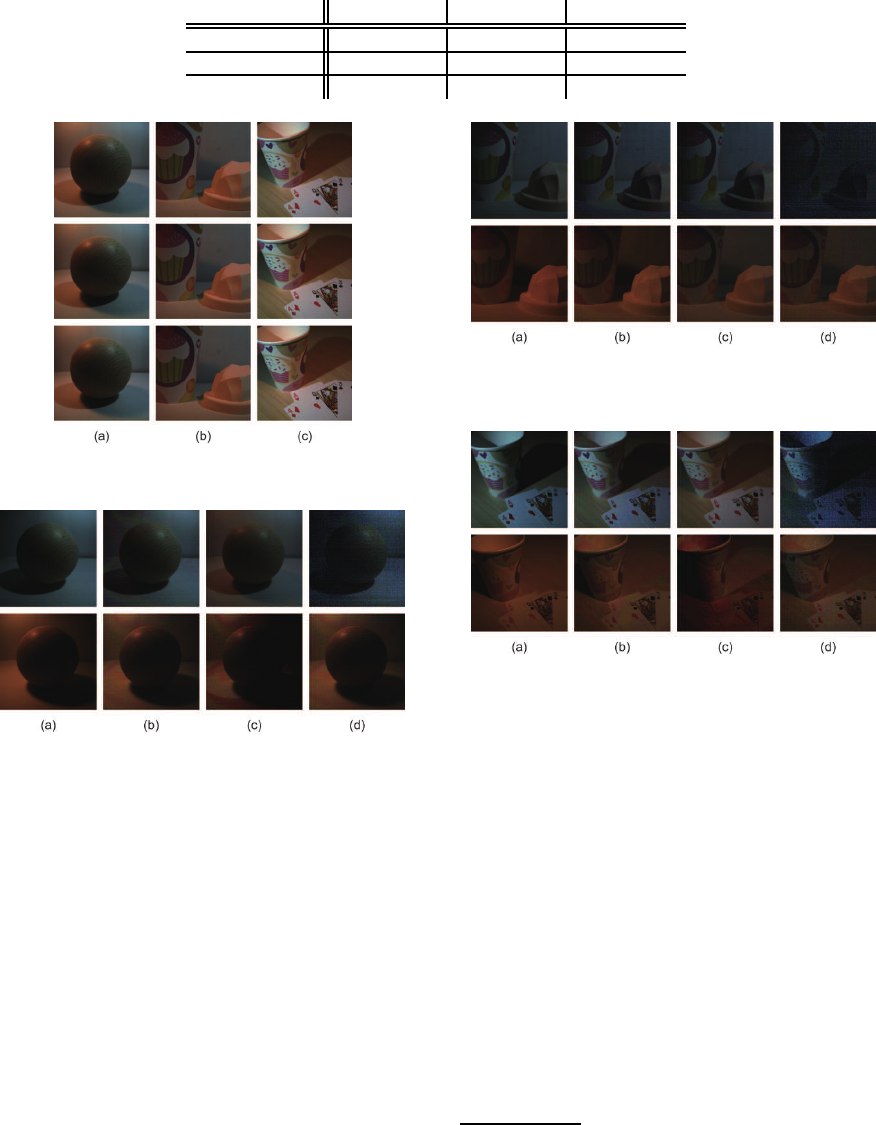
Table 3: The PSNRs of the basis images estimated by using NMF, ICA-1, and ICA-2 for Scenes 4, 5, and 6. The numerical
values in each cell are the PSNRs for the first/second basis images.
method\scene
4 5 6
NMF 31.34/30.44 32.56/31.97 29.72/30.88
ICA-1 23.11/20.47 31.72/25.95 21.39/18.98
ICA-2 26.13/21.31 19.52/25.74 15.61/26.10
Figure 5: The first three images of the real image sequence
of (a) Scene 4, (b) Scene 5, and (c) Scene 6.
Figure 6: The results of light source separation for Scene 4:
(a) the ground truth of the basis images, and the basis im-
ages estimated by using (b) NMF, (c) ICA-1, and (d) ICA-2.
Real Images:
We captured the image sequences of three scenes, i.e.
Scenes 4, 5, and 6, each of which is illuminated by
two light sources powered by an electric grid with 60
Hz as shown in Figure 5. We used the high-speed
camera FASTCAM Mini UX50 from Photolon with
the frame rate of 2,500 fps/1,000 fps and with the ex-
posure time of 0.4 ms/1 ms for Scenes 4 and 5/Scene
6 respectively.
Figures 6, 7, and 8 show the results of light source
separation for those scenes: (a) the ground truth of the
basis images, and the basis images estimated by using
(b) NMF, (c) ICA-1, and (d) ICA-2. We consider the
images captured when turning only one of the light
sources on as the ground truth of the basis images.
Table 3 summarizes the PSNRs of the basis images
Figure 7: The results of light source separation for Scene 5:
(a) the ground truth of the basis images, and the basis im-
ages estimated by using (b) NMF, (c) ICA-1, and (d) ICA-2.
Figure 8: The results of light source separation for Scene 6:
(a) the ground truth of the basis images, and the basis im-
ages estimated by using (b) NMF, (c) ICA-1, and (d) ICA-2.
estimated by using NMF, ICA-1, and ICA-2.
We obtained the results consistent to those using
synthetic images. Figure 6, 7, and 8 qualitatively
show that NMF works better than ICA-1 and ICA-
2. In particular, the colors and shadows in the basis
images estimated by using ICA-1 are often inaccu-
rate, and the basis images estimated by using ICA-2
are often darker than the ground truth due to negative
pixel values
1
. Table 3 quantitatively shows that NMF
works better than ICA-1 and ICA-2 significantly.
3.2 Sensitivity Analysis
The performance of our proposed method using NMF
depends on exposure times as well as image noises,
since light source separation under AC illumination
1
Since the scales of the basis images estimated by using
NMF and ICA are ambiguous, we adjusted the scales of the
estimated basis images so that the PSNRs are maximized
for fair quantitative evaluation
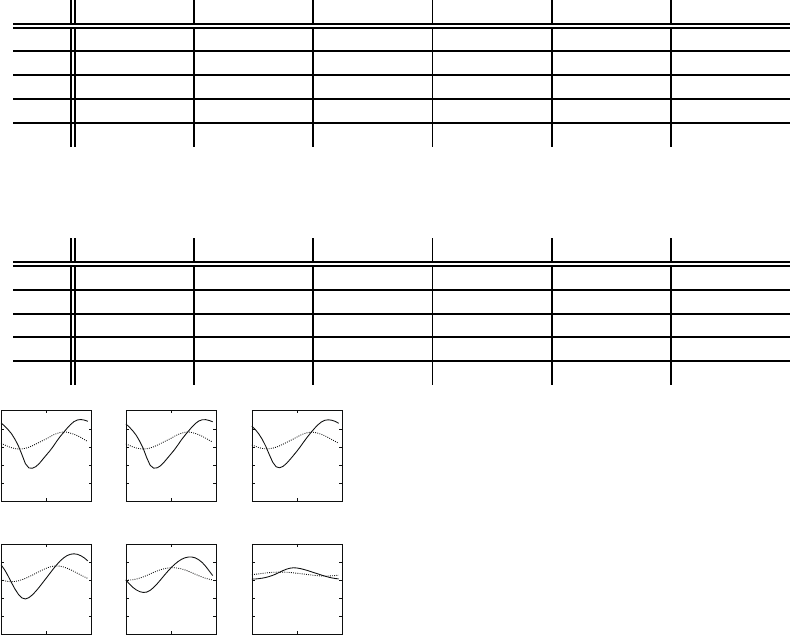
Table 4: The PSNRs of the basis images estimated by using NMF for varying standard deviations of Gaussian noises and
varying exposure times. The numerical values in each cell are the PSNRs for the first/second basis images.
0.25 ms 0.5 ms 1 ms 2 ms 4 ms 8 ms
σ=0 50.03/34.89 50.02/34.88 50.01/34.83 49.90/34.62 49.29/33.87 43.21/32.44
σ=1 46.22/35.07 46.19/35.06 46.05/35.02 45.58/34.86 43.91/34.19 40.02/32.58
σ=2 42.13/34.46 42.11/34.47 42.08/34.41 41.86/34.30 41.24/33.80 39.80/32.54
σ=4 41.08/33.49 41.08/33.48 41.03/33.46 40.89/33.37 40.57/33.03 39.43/32.21
σ=8 39.89/31.78 39.85/31.87 39.83/31.74 39.76/31.59 39.36/31.89 38.22/31.13
Table 5: The RMSEs of the intensity profiles of the light sources estimated by using NMF for varying standard deviations
of Gaussian noises and varying exposure times. The numerical values in each cell are the RMSEs for the first/second light
sources.
0.25 ms 0.5 ms 1 ms 2 ms 4 ms 8 ms
σ=0 0.003/0.000 0.003/0.000 0.003/0.000 0.004/0.000 0.006/0.000 0.023/0.000
σ=1 0.002/0.002 0.002/0.002 0.002/0.002 0.002/0.002 0.004/0.003 0.013/0.010
σ=2 0.003/0.008 0.003/0.008 0.003/0.008 0.003/0.008 0.005/0.010 0.011/0.012
σ=4 0.003/0.012 0.004/0.012 0.003/0.012 0.004/0.012 0.006/0.012 0.011/0.013
σ=8 0.007/0.013 0.009/0.015 0.008/0.015 0.006/0.014 0.015/0.013 0.013/0.015
(a)
0
0.1
0.2
0.3
0.4
0.5
0 0.01 0.02
0
0.1
0.2
0.3
0.4
0.5
0 0.01 0.02
(d)
(b)
0
0.1
0.2
0.3
0.4
0.5
0 0.01 0.02
0
0.1
0.2
0.3
0.4
0.5
0 0.01 0.02
(e)
(c)
0
0.1
0.2
0.3
0.4
0.5
0 0.01 0.02
0
0.1
0.2
0.3
0.4
0.5
0 0.01 0.02
(f)
Figure 9: The intensity profiles of the first (solid lines) and
second (dotted lines) light sources when the exposure times
are (a) 0.25 ms, (b) 0.5 ms, (c) 1ms, (d) 2 ms, (e) 4 ms, and
(f) 8 ms respectively.
makes use of fast flickers of light sources’ intensi-
ties. Accordingly, we studied the sensitivity of our
method using NMF to exposure times and noises by
using synthetic images.
Specifically, we interpolated the temporal inten-
sity profiles (Sheinin et al., 2017), which are sam-
pled at 26 points per cycle, by spline interpolation,
and computed the intensity profiles with the expo-
sure times from 0.25 ms to 8 ms. Then, we syn-
thesized the images with varying exposure times by
combining the basis images for Scene 1 with those
light sources’ intensities, and added zero-mean Gaus-
sian noises, whose standard deviation σ is from 1 to 8
for 8-bit pixel values, to them.
Tables 4 and 5 summarize the PSNRs of the ba-
sis images and the RMSEs of the intensity profiles
of the light sources estimated by using NMF. We can
see that the PSNRs of the basis images are getting
worse as not only the standard deviation of the Gaus-
sian noises but also the exposure time increase. This
is because the intensity profiles of the light sources
are getting smoother and the flickers also becomes
invisible as the exposure time increases as shown in
Figure 9.
4 CONCLUSION
In this paper, we proposed a method for light source
separation under AC illumination on the basis of BSS;
we decompose the image sequence of a scene illumi-
nated by multiple AC light sources into the basis im-
ages and the light sources’ intensities. Specifically,
we show that light source separation results in ma-
trix factorization, and make use of NMF for BSS be-
cause both the pixel values of the basis images and
the intensities of the light sources are non-negative.
We experimentally confirmed that our method using
NMF works better than ICA, and studied the perfor-
mance of our method under various conditions: vary-
ing exposure times and noise levels. Our future work
includes light source separation under more than two
light sources, the improved separation by taking noise
removal into consideration, and the application of the
separation results.
ACKNOWLEDGMENTS
This work was partially supported by JSPS KAK-
ENHI Grant Numbers JP18H05011 and JP17H01766.
REFERENCES
Barron, J. and Malik, J. (2015). Shape, illumination, and
reflectance from shading. IEEE TPAMI, 38(7):1670–
1687.
Berry, M., Browne, M., Langville, A., Pauca, V., and Plem-
mons, R. (2007). Algorithms and applications for ap-
proximate nonnegative matrix factorization. Compu-
tational Statistics & Data Analysis, 52(1):155–173.
Hsu, E., Mertens, T., Paris, S., Avidan, S., and Durand, F.
(2008). Light mixture estimation for spatially varying
white balance. ACM TOG, 27(3):1–7.
Hyv¨arinen, A. and Oja, E. (2000). Independent component
analysis: algorithms and applications. Neural Net-
works, 13(4–5):411–430.
Sheinin, M., Schechner, Y., and Kutulakos, K. (2017).
Computational imaging on the electric grid. In Proc.
IEEE CVPR2017, pages 6437–6446.
Sheinin, M., Schechner, Y., and Kutulakos, K. (2018).
Rolling shutter imaging on the electric grid. In Proc.
IEEE ICCP2018, pages 1–12.
Vollmer, M. and M¨ollmann, K.-P. (2015). Flickering lamps.
European Journal of Physics, 36(035027).
