
Affordable Remote Terminal for Sensor Observation Service
Laura La Gattuta
1
, Alessio Langiu
2
, Luca Sabatucci
2
, Vincenzo Suraci
3
and Mario Sprovieri
1
1
National Research Council, IAS-CNR, Capo Granitola (TP), Italy
2
National Research Council, ICAR-CNR, Palermo, Italy
3
DIIAG A. Ruberti, Univ. Rome La Sapienza, Roma (RM), Italy
mario.sprovieri@cnr.it
Keywords:
Internet of Things, Environmental Monitoring, Sensor Observation Service, Low-cost Data Acquisition.
Abstract:
In the Internet of Things era, where the availability of data connectivity and smart devices is every day spread-
ing more and more, the capability of acquiring sensor data through a simple, affordable and power efficient
solution is a promoting factor for the collaborative creation of data set according to the Open Data philoso-
phy. This setting is particularly fitting the agent environmental monitoring through repetitive measurement of
physical-chemical parameters. This manuscript presents a new software solution for data acquisition based on
a Raspberry PI terminal equipped with a thermal sensor and data connectivity at the system level. It exploits
the features of the Sensor Observation Service (SOS) standard, such as the data model and the communication
formats, and it assumes the availability of an SOS server to archive the data.
1 INTRODUCTION
The purpose of any data acquisition system is to cre-
ate a data set containing a record for each observation.
The standard layout of such a system, particularly in
the case of acquiring physical-chemical parameters,
is composed of sensors or probes, a data logger or a
small processing unit physically interfaced to the sen-
sors, and a local or remote post-processing of data in
order to create a consistent data set compliant to some
format. In many cases, a comma separated values
(csv) file, or collection of files, is used as a data set. In
this scenario, aspects as data validation, standardisa-
tion, data availability, data accessibility and even the
data format specifications are aspects which have to
be manually addressed.
We can summarise the above layout in three con-
ceptual blocks. 1. the physical layer with the sen-
sor and its communication interface to the monitoring
agent; 2. the data layer with the validation and the
handling of the data conversion from a raw reading
on the sensor to a value in a proper unit of measure,
the formatting of such data in some archiving format;
3. the data set layer with the responsibility of collect-
ing the data over time and, desirably, of offering the
data for further use.
Usually, when custom data acquisition solutions
are used, the data set structure and its description are
relegated to a spreadsheet or a csv file with some
heading comments or a database scheme with com-
ments. In this way, any usage of the data set, such
as analysis, retrieval, sharing or publication, requires
manual intervention. Data accessibility is usually an
underestimated problem and common custom solu-
tions are far from the Open Data philosophy which is
lately gaining public attention even from governmen-
tal institutions. Data sharing and data reusability is
a complex task when custom data set format is used,
and it is usually a time consuming task, because it is
necessary to provide, beside the data, a description of
the content. On the contrary, using a standard data
model and a set of standard operations makes pos-
sible to give automatic access to the data which are
self-described.
In the case of sensor observations, a comprehen-
sive solution for the data set layer is the Sensor Ob-
servation Service (sos, ) which is able to provide such
data in an easy and well-described way, also support-
ing spatial query. Furthermore, there are several com-
patible software for displaying data and for data ma-
nipulation. In fact, many Spatial Data Infrastructure
and Geographic Information System platforms recog-
nize the SOS service as a data source.
IoT solutions give easy access to raw sensor data
via a plethora of devices and communication proto-
cols that can be easily attached to a smart device, like
the Raspberry PI (RPI). The RPI is a low-cost pro-
272
Gattuta, L., Langiu, A., Sabatucci, L., Suraci, V. and Sprovieri, M.
Affordable Remote Terminal for Sensor Observation Service.
DOI: 10.5220/0009149802720278
In Proceedings of the 12th International Conference on Agents and Artificial Intelligence (ICAART 2020) - Volume 1, pages 272-278
ISBN: 978-989-758-395-7; ISSN: 2184-433X
Copyright
c
2022 by SCITEPRESS – Science and Technology Publications, Lda. All rights reserved

cessing unit that, having a full Unix-like operating
system, is powerful, flexible and it automatically rec-
ognize many data acquisition devices.
We present in this manuscript a new simple solu-
tion for remote data acquisition based on the Rasp-
berry PI and the SOS standard. The key advantage of
this solution is twofold: to keep simple the tasks to be
accomplished on board of the remote terminal toward
solidity and power efficiency in order to make it fit a
long-term remote monitoring plan; and maximize the
accessibility and reusability of the produced data set
through standardization. The novelty of the presented
approach is the presence of above two key elements
in a single solution, as will be expanded in the fol-
lowing section about related works. In fact, even if
many data acquisition solutions have been presented
in past decades, they suffer of lack of standardisa-
tion or lack of simplicity, that means maintainability,
solidity, configurability and lightness. Assuming to
have access to online SOS services, the presented so-
lution turns a smart device with a sensor into an au-
tonomous, real-time, long-term data acquisition sta-
tion.
2 RELATED WORKS
This section contains an overview of recent works re-
lated to sensor data acquisition systems that make use
of low-cost devices. A comparison of the approach
used and the solution presented in this manuscript is
made for each of them.
A Ferdoush and Li paper (Ferdoush and Li, 2014)
of 2014 describes a wireless sensor network system
that uses a Raspberry PI as base station and some
other a Raspberry PIs as remote acquisition stations
for environmental monitoring. The system is de-
signed to work in indoor small environment. The base
station is in charge of archiving all the data in a lo-
cal database and to run the visualization Web-based
service. This solution has two drawbacks. The data
security and service availability are demanded to a a
Raspberry PI which has notoriously long-term stor-
age issues. Data accessibility is relegated to a visu-
alization Web interface without any data set sharing
service that will allow data usage from third parts.
In 2016, Saraiva et al. (Saraiva et al., 2016) pre-
sented a solution for data acquisition based on a low-
power single board computer as remote terminal and
a free online service for data storage. They witnessed
high latency between data acquisition and data online
publication, together with number precision, due to
the limitation of the online service used as data set
manager. They used a Google spreadsheet as archive
file. Even if the usage of an online data repository of-
fers good data availability, the use of a custom table
format is still a limit for data access and data reuse.
Shete and Agrawal paper (Shete and Agrawal,
2016) of 2016 presents a stand-alone system based on
the Raspberry Pi and Python scripts for environmen-
tal observation. The system provides near real time
data to subscribed clients via Internet, but it lacks a
storage feature. The clients are ad-hoc software that
use an optimized transmission protocol, namely MQTT
which is a machine-to-machine/IoT connectivity pro-
tocol.
Mohanraj et al. paper (Mohanraj et al., 2017) of
2017 presents a solution for monitoring critical pa-
rameters of patients using sensors that uses a low-cost
terminal with connected sensors to collect data and a
standard PC to process and visualise them through a
Lab VIEW interface. This solution is designed for
real-time monitoring on a single station running the
appropriate graphical interface and, so, it lacks any
data access and data availability feature.
Samourkasidis and Athanasiadis paper
(Samourkasidis and Athanasiadis, 2017) of 2017
introduce a Python based software solution for
Raspberry PI able to collect local attached sensor
data, stores the data using a lightweight database and
provides the data according the Sensor Observation
Service specification. It is basically an all-in-one
solution that has the capability of back up the data in
an online service. This approach suffers, on the data
availability side, of the limited computing power of
the Raspberry that might be stressed in the case of
clients intense requests.
Alkandari and Moein paper (Alkandari and
Moein, 2018) of 2018 presents a solution for air qual-
ity monitoring. It uses a Raspberry PI connected to
some sensors to acquire data, then a record is created
into a local excel file and further processing may trig-
ger a warning email along with a local graphics in-
terface that plots the collected data. This solution is
an interesting case of stand-alone station for environ-
mental monitoring but it has a drawback about data
accessibility and security due to the data set design
which is locally managed in a simple spreadsheet.
The Chase et al. paper (Chase et al., 2018) ap-
peared on Sensors (2018) describes a stand-alone
platform based on a low-cost IoT terminal with sen-
sors for in-situ monitoring of environmental param-
eters. It uses ThingSpeak (thi, ) online platform to
archive and analyze data. The paper deeply analyzes
the power consumption of the solution which is de-
signed for applications in remote environment and
then it is designed to be power efficient and mainte-
nance free. Internet connection is provided by a Wi-Fi
Affordable Remote Terminal for Sensor Observation Service
273

router for mobile network. The use of an online data
repository guarantees good data accessibility and se-
curity, but the selected solution is a spreadsheet like
data set which store values as rows. Despite the ef-
forts in maintaining low the power requirement, the
overall hardware solution is not so far from a Rasp-
berry PI in terms of power drain since it uses Wi-Fi,
writes on a SD card and uses IO signals with the sen-
sors. The drawback here is to require a more low level
of programming of the selected hardware with respect
to a Unix-like system that provides IO, networking
and storage management by default. Furthermore, the
presence of an online repository gives to the solution a
good level of data security and data accessibility, also
via REST API, but even this requires a low-level pro-
gramming and a deep knowledge of the data formats
rather than use a standard data model and a standard
communication protocol for sensor data such as SOS.
Del R
´
ıo et al. paper (Del Rio et al., 2018) of
2018 presents a data acquisition solution tailored for
oceanographic sensor observation. It reports the re-
sult of an ongoing project supported by an European
grant. It describes the NeXOS (nex, ) architecture as
a complex system that extends the Sensor Observa-
tion Service and standard. The prototype system is
composed by a low-power terminal that collects sen-
sor data and transmit them to an online server, as de-
scribed in the within referenced paper (Toma et al.,
2014) of some of the same authors. Standardisation
helps to reduce operating costs of the observatory sta-
tion, as well as the risk of failures due to manual er-
rors. Standard protocols and formats also facilitate in-
teroperability, maintenance, data access and reusabil-
ity. To the best of our knowledge, no implementation
is freely available of the low-level acquisition system.
3 ART4SOS SOLUTION
In this section we present a new data acquisition sys-
tem for sensor observations. The goal of this system is
to read data from a sensor attached to a remote smart
device, like a Raspberry PI, and to send the data to an
online SOS server.
Affordable Remote Terminal for Sensor Observa-
tion Service (ART4SOS) is a software solution that
runs on Unix-like systems. It takes sensor data and
puts them on an SOS server as observations. The data
comes from a physical sensor that is recognized at the
system level. The core task is to handle data conver-
sion from a raw reading of a sensor to a SOS com-
patible data format and to transmit the data to a SOS
server. It secondarily address issues like the time syn-
chronization and the connectivity disruptions as de-
scribed later in this section.
The key design points are: Power Efficiency: to
be run on small and low-power device; Flexibility: to
be adapted to any physical IoT device with low man-
ual effort; Reliability: and Maintainability to be used
on remote location with a very low manual interven-
tion rate required; Interoperability: to be connected to
standardised systems; Data Accessibility: to promote
data sharing and even Open Data philosophy.
We assume to have access to a remote SOS server,
for instance the open-source server from 52
◦
North
(52s, ) , that is responsible to create a data set of sen-
sor readings according to the SOS data model. This
implies that the remote terminal is connected to Inter-
net.
ART4SOS addresses three aspects of data acqui-
sition: the temporary management of the data on the
remote terminal in the sensor based raw format; the
validation of the data and therefore the data set based
conversion; and the transmission of the data to the
server.
We have devised a set of three command line
scripts in Python, which satisfied the above design re-
quirement in terms of code simplicity, running perfor-
mance and standard data model and communication
compliant. They accomplish to the following three
steps:
• Data Acquisition
• Data Format
• Data Transmission
Once the raw data are available, a JSON package is
prepared compliant to the Insert-Observation service
of SOS. The data are time and space referenced and
are temporarily buffered on the remote terminal wait-
ing for an Internet access.
In the following section we give a better descrip-
tion of these three steps of the ART4SOS solution,
as well as a description of the system installation, the
configuration, the description of some secondary as-
pects.
3.1 Configuration
ART4SOS configuration file is a text file used for the
configuration of the service parameters via a name-
value pair. It includes various necessary fields such as
the name and the coordinates of the acquisition sta-
tion, that is the feature of interest according to the
SOS model. The spatial definition follows the sam-
pling point standard and it is expressed in latitude,
longitude, altitude and projection values. This static
spatial definition is needed because this version of the
system does not have a GPS installed. It is simple to
ICAART 2020 - 12th International Conference on Agents and Artificial Intelligence
274
[DEFAULT]
FEATUREOFINTEREST = roosvelt
OBSERVABLEPROPERTY = air:temperature
PROCEDURE = temperature
OFFERING = temperature
UNITOFMEASURE = DEG
LATITUDE = 38.190234
LONGITUDE = 13.350320
ALTITUDE = 2.0
PROJECTION = EPSG:4326
VERBOSE = True
PATH = ./data
SERVER = http://art4sos.local/sos/service
USER = user
PASSWORD = pass
Figure 1: ART4SOS configuration file example. It supports
environmental definitions, in this case only DEFAULT en-
vironment is reported. Similarly, TEST and DEVELOP-
MENT environment are present in the complete file.
extend the system to make use of a GPS but it is out of
the scope of this manuscript. We use the PATH vari-
able as the mounting point of a RAM partition, and,
hence, the place where the produced files are buffered.
The configuration includes the SOS service interface,
which is an accessible Internet URL, on which the
data will be loaded. An example is reported in Fig-
ure 1.
The ART4SOS configuration script is a Python
script that prepares the SOS server to receive the re-
mote observations. According to the SOS data model,
an observation, e.g. a measurement, it is accom-
plished through a procedure and the result of the ob-
servation, e.g. the measured value, must be assigned
to an offering in order to be published. The proce-
dure is described by using the SensorML (sen, ) lan-
guage of OpenGIS. The description of the procedure
contains its name, the offering name, the feature of
interest name and the spatial attributes of the fea-
ture of interest (composed of the latitude, the longi-
tude, the altitude and the projection). It also contains
the observed property name, the type of observation,
OM Measurement in the simplest case, and the fea-
ture of interest type, e.g. a sampling point in space.
The configuration script takes these parameters from
the above configuration file and, then, it uses the In-
sertSensor (sos, , Section 10.2.1) service on the SOS
server in order to define the new sensor and all the
related parameters. The JSON package used for the
Insert Sensor call is locally archived. Once this con-
figuration is accomplished, the service is ready for au-
tomatic data entry.
3.2 Data Acquisition
This module deals with querying the sensor making
the syntactic validation of the retrieved value, adapt-
#!/usr/bin/env python
import w1thermsensor
sensor = w1thermsensor.W1ThermSensor()
temp = sensor.get_temperature()
print(‘{:.2f}’.format(temp))
Figure 2: ART4SOS acquisition script.
ing the value to the desired precision, scale and unit
of measure, and returning it to the system shell. It is
voluntarily left simple for the sake of clarity. We as-
sume that a thermal sensor is connected to the GPIO
and mounted to the file system as a file.
The data acquisition task is performed via a sim-
ple Python script which uses a library to handle the
thermal sensor via the 1-wire MicroLAN (one, ). The
code is reported in Figure 2. This script is meant to
be adapted to the actual sensor or sensors accessible
from the remote terminal as long as it returns a value
as OUTPUT. We do not give more details on how to
use different sensors or IoT devices to retrive sensor
data and any further customisation is left to the user.
Anyway, it is straight forward to adapt this script to
many existing sensors as they come with Python sup-
port and, often, Raspberry PI support at the system
level.
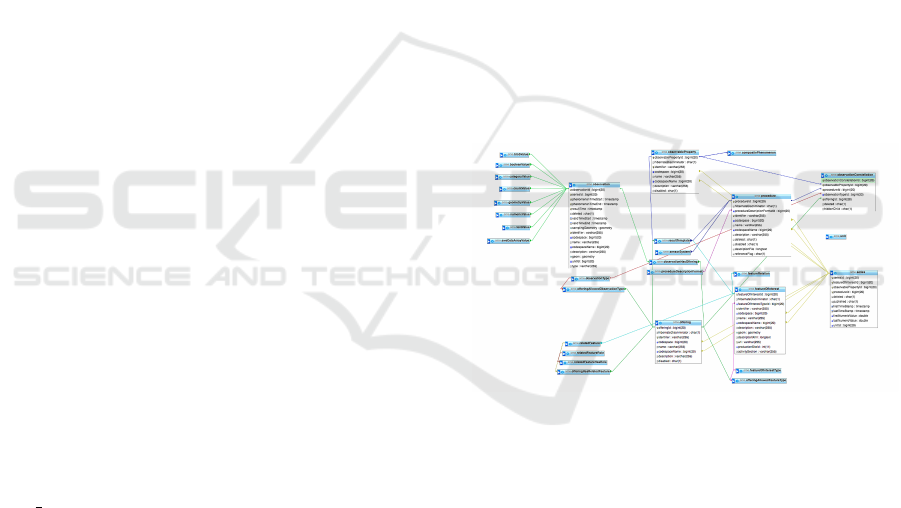
Figure 3: Sketch of the core components of the SOS Data
Model.
3.3 Data Format
ART4SOS format is a Python script that takes a nu-
meric value as INPUT parameter and produces a
JavaScript Object Notation (JSON) package that is
compatible to the SOS Insert Observation service
(sos, , Section 10.4.1).
The SOS Data Model is based on the concept of
observation. An observation is the act of observing
a phenomenon, which might be of physical nature or
might be a virtual, derived or complex operation. The
basic act of observation is the measurement of a pa-
rameter. Different kind of observations are performed
by the means of appropriate procedure. The act of
measuring a phenomenon via a physical probe or sen-
sor produces a numeric value. The feature of interest
Affordable Remote Terminal for Sensor Observation Service
275

{
"request": "InsertObservation",
"service": "SOS",
"version": "2.0.0",
"offering": STRING,
"observation": {
"type": "http://www.opengis.net/def/observationType/
OGC-OM/2.0/OM_Measurement",
"procedure": STRING,
"observedProperty": STRING,
"featureOfInterest": ...,
"phenomenonTime": STRING,
"resultTime": TIME,
"result": {
"uom": STRING,
"value": VALUE
}
}
}
Figure 4: Extract of the Insert Observation template used
by ART4SOS format script where STRING, TIME and
VALUE are the token replaced by the script.
is the presence of a phenomenon in a georeferenced
point in space. The repetition in time of sensor read-
ing referring to the same phenomenon, feature of in-
terest and procedure together with the appropriate unit
of measure are connected to form a time series. Fig-
ure 3 reports a sketch of the core components of the
SOS Data Model as it is reflected in the database im-
plementation.
The data format script uses a Insert Observation
template for measurements and produces a JSON
package with the input value, the current time and
Procedure, Feature of Interest and Observable Prop-
erty taken from the configuration file, as reported in
Figure 4. It is straight forward to extend this script in
order to use the time and the coordinates of the Fea-
ture of Interest coming from a GPS in case of mobile
data acquisition stations. The JSON data file is saved
on the disk.
3.4 Data Transmission
ART4SOS data transmission script is in charge of
making the actual call to the insert observation ser-
vice of the selected SOS server by using the JSON
packages buffered on the local system.
Since the SOS services are accessible via a Web
interface, the data transmission makes a http request
with an attached POST data package by using the
curl tool, which is a command line tool for data ex-
change over internet. ART4SOS data transmission is
designed to run asynchronously with respect to the
data acquisition and the data format scripts in order
to manage connectivity issues like network disruption
or temporary unavailability. At every run, it looks for
local buffered observation files and it tries to trans-
mit each of them to the server. If the transmission
is successfully performed, it removes the transmitted
observation from the local terminal, otherwise the ob-
servation file is left to be later transmitted. Hence, the
answer of the server is analyzed, if it has status "http
200 OK" and it does not contain any "exception"
then the transmission is successfully accomplished
and the observation correctly inserted on the data
set. Figure 5 reports an extract of the code of the
ART4SOS data transmission Python script that han-
dle the service call. According to the SOS specs, the
insert observation service is one of the so called trans-
actional operations which usually require user authen-
tication. User and password authentication is handled
by using configurable variables.
3.5 Secondary Features
Since Art4SOS uses the system time as the time of
the observation, i.e. the reading from the sensor, it
assumes that the system time is properly managed. It
would be easy to extend this service with the addition
of a GPS in order to manage the time synchronization,
and to update the geo-references of the data.
Since the RPI does not have by default a real-
time clock, ART4SOS addresses a time loss issue,
e.g. caused by a system halt, by forcing the system
time to be set at boot to the time of a reliable server
(e.g. google) as described in the installation script of
Section 3.6.
Small computing boards like the RPI do not have
storage disk but they use instead of flash memory data
storage devices. Such kind of devices have limited
write cycles that might lead to a system failure in ap-
plication like long term data acquisition station.
ART4SOS assumes to be normally connected to
Internet and does not guarantee to save data acqui-
sition over a power loss by design. Hence, it uses
a very small disk space for the configuration file, the
scripts, and for buffering the acquired data waiting for
data transmission. In order to save disk write cycles,
ART4SOS uses a virtual disk in RAM for data buffer-
ing as described in Section 3.6. A memory based disk
is a file system that uses a portion of RAM as storage.
This type of storage is ideally suited for applications
which need repetitively small data areas for caching
or using as temporary space.
In a clean installation of Raspian on the RPI there
are about 700 Mega Byte of free RAM that can be
used for the creation of a RAM disk without compro-
mising basic system performance. In ART4SOS typi-
cal setting, which is the acquisition of one value with
a frequency of seconds or minutes, few megabyte of
ICAART 2020 - 12th International Conference on Agents and Artificial Intelligence
276

curl -vs -u USER:PASSWORD -d ’@FILENAME’ -H ’Content-Type:
application/json’ SERVER
Figure 5: ART4SOS data transmission script core. Send-
ing an Insert Observation package FILENAME to the SOS
server SERVER via the Curl command line tool.
space are enough to handle the buffering of a few days
of data. Since ART4SOS produce a file of about one
kilobyte after each acquisition, using the full RAM
capacity it is possible to buffer all the reading of one
week at the rate of one per second. The amount of
space to be devoted to locally buffer the data is meant
to be adapted to the length of the expected loss of In-
ternet connectivity and service availability.
3.6 Installation
The installation of ART4SOS service is performed via
a Bash script as reported in Figure 6. It assumes that
the ART4SOS configuration file has been properly
set. It firstly calls the ART4SOS configuration script
in order to define the observation attributes on the
SOS server. It creates a directory for locally buffer-
ing the observation data files. This directory is used
as mounting point of a RAM disk that is defined at the
system level via the fstab file. For time synchroniza-
tion purpose, due to the lack of a Real Time Clock on
board of the Raspberry PI, a job is defined to be run
at every boot. A simple call to a reliable Web site,
e.g. Google Web site, is used to set the system time
as the time stated in the response header. The CRON
management system is used to set periodic run of the
ART4SOS data acquisition and data format scripts, in
a single system call combining the value through the
system pipe. A further system call is used to periodi-
cally run the ART4SOS transmission script.
ART4SOS is available on GitHub at the following
address: https://github.com/lauralagattutacnr/art4sos
4 EXPERIMENTS
The prototype used for this manuscript uses a Rasp-
berry PI 3+ with a pre-installed Raspbian distribution
and a digital temperature sensor with one-wire con-
nection to the GPIO and Internet connection man-
aged at system level. For simplicity, we suppose
to have Internet access via Wi-Fi with availability
below 100%. The SOS server used in the exper-
iments is an open-source implementation of SOS
ver. 2.0 from 52
◦
North. A demo version of SOS
server is available on http://sensorweb.demo.52north.
org/sensorwebtestbed.
In our prototype environment, the RPI with a clean
#!/bin/bash
python3 art4sosconfigure.py
cat << EOF >> /etc/fstab
tmpfs $PWD/data tmpfs
nodev,nosuid,noexec,nodiratime,size=24M 0 0
EOF
mkdir $PWD/data; mount $PWD/data
(crontab -l && echo "@reboot sleep 30 && date -s
$(wget -qSO- --max-redirect=0 google.com 2>&1 |
grep Date: | cut -d’ ’ -f5-8)Z ") | crontab -
(crontab -u pi -l && echo "* * * * * cd $PWD &&
python3 $PWD/art4sosformat.py
$(python3 $PWD/art4sosacquisition.py)") | crontab -u pi -
(crontab -u pi -l && echo "* * * * * cd $PWD &&
python3 $PWD/art4sostransmission.py") | crontab -u pi -
Figure 6: ART4SOS installation Bash script.
OS uses less of 1% of CPU either with and without
ART4SOS running or installed, according to what re-
ported by the top command line tool. So, the comput-
ing and the power impact on this device is not appre-
ciable at a macro scale. The memory footprint of any
running script of ART4SOS is below ten megabytes,
mostly due to the Python framework. The transmis-
sion bandwidth is proportional to the JSON packages
plus a little overhead due to TCP/IP and http proto-
col. Network load reduction can be obtained by using
common strategies not covered in this manuscript.
An investigation was conducted by using the GNU
time command line tool for each script and the results
are reported in Table 1. The CPU utilisation is low for
acquisition and transmission as they wait for external
resources, such as the sensor IO, the network delay
and the server response. Transmission uses the full
processing power, only for a very short time, because
it uses resources on the RAM disk.
Having a SOS standard services, the visualiza-
tion of sensor data is possible thought the open-source
Helgoland (hel, ) graphical interface, which is a SOS-
compatible Web-based sensor data visualization tool.
Figure 7 reports a graph of data collected in our de-
velopment prototype, where a list and a diagram of
values of sensor is shown.
Table 1: Result of GNU time of Acquisition, Format and
Transmission script, with Time, CPU and memory usage.
Script Time (sec.) CPU (%) Mem. (KB)
Acquisition 0.21 22% 7924
Format 0.21 99% 7896
Trasmission 0.26 67% 8148
Affordable Remote Terminal for Sensor Observation Service
277
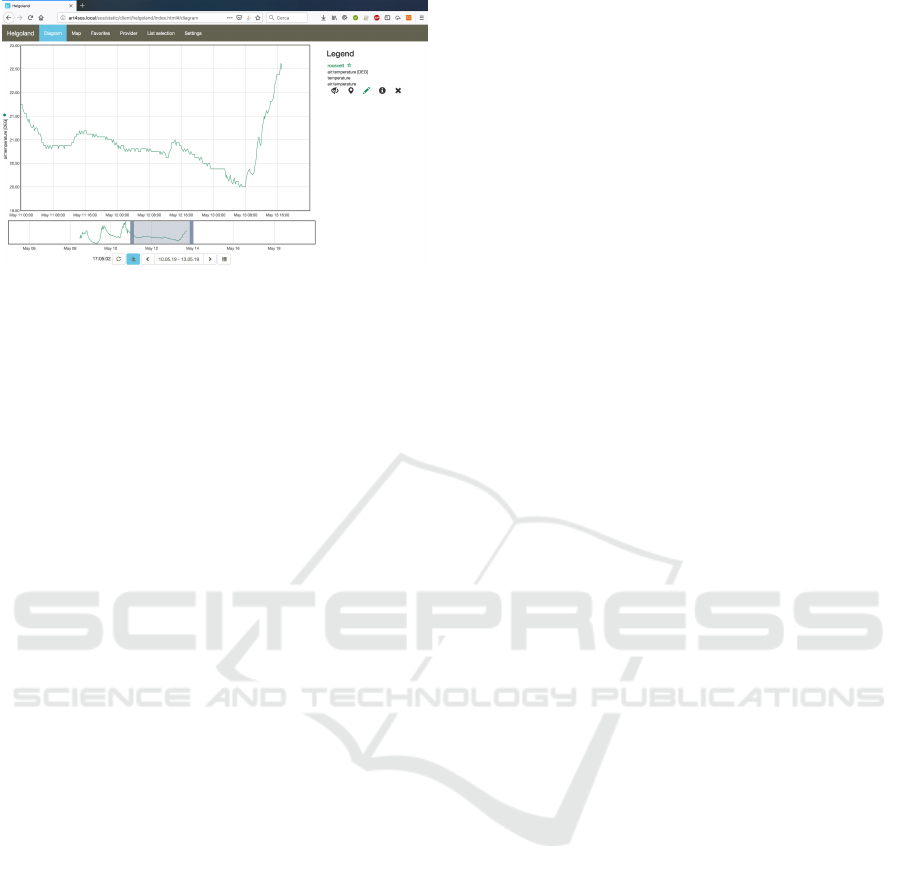
Figure 7: Screenshots of a graphics interface for SOS show-
ing data acquired in ART4SOS experiments.
5 CONCLUSION
This manuscript presents a new software solution for
sensor data acquisition based on a low-cost process-
ing board with sensor and Internet connectivity at sys-
tem level. It exploits Sensor Observation Service fea-
tures such as the data model and the communication
formats and it assumes the availability of a SOS server
to archive the data. This settings is particularly fitting
the environmental monitoring through repetitive mea-
surement of chemical physical parameters. The pre-
sented solution achieves data accessibility, data secu-
rity, interoperability by using a SOS online server and
it achieves maintainability, reusability and reliability
by using basic Linux tools combined in simple Python
and Bash scripts. It can run on common IoT enabled
small devices since it uses very low system resources,
in terms of computing power and memory usage. Its
code simplicity contributes to reducing possible er-
rors from manual intervention. The code is available
online for free use and modification.
ACKNOWLEDGMENTS
This work has been supported by the Italian PON
grant Integrated system for monitoring and protec-
tion of the urban, suburban and marine environment
- MAGINOT, and by the Italian FISR grant Interna-
tional Center for Advanced Studies on Environment,
Ecosystem and Human Health - CISAS.
REFERENCES
52
◦
North helgoland, visual exploration and analysis of sen-
sor web data. https://52north.org/software/software-
projects/helgoland.
52
◦
North SOS server. https://52north.org/software/software-
projects/sos.
Next generation Web-enabled sensors for the monitoring of
a changing ocean. http://www.nexosproject.eu.
A python package for one wire temperature sensors.
https://github.com/timofurrer/w1thermsensor.
Sensor Model Language from
Open Geospatial Consortium.
https://www.opengeospatial.org/standards/sensorml.
Sensor Observation Service standard from Open
Geospatial Consortium, ver. 2.0, 20 april 2012.
http://www.opengis.net/doc/IS/SOS/2.0.
Thingspeak open-source tool and API for IoT from Math-
works. https://thingspeak.com.
Alkandari, A. and Moein, S. (2018). Implementation of
monitoring system for air quality using Raspberry Pi:
Experimental Study. Indonesian Journal of Electrical
Engineering and Computer Science.
Chase, O., Teles, M., Rodrigues, M., de Almeida, J.,
Mac
ˆ
edo, W., and da Costa Junior, C. (2018). A low-
cost, stand-alone sensory platform for monitoring ex-
treme solar overirradiance events. Sensors (Switzer-
land).
Del Rio, J., Toma, D., Martinez, E., O’Reilly, T., Delory, E.,
Pearlman, J., Waldmann, C., and Jirka, S. (2018). A
sensor web architecture for integrating smart oceano-
graphic sensors into the semantic sensor web. IEEE
Journal of Oceanic Engineering.
Ferdoush, S. and Li, X. (2014). Wireless sensor network
system design using Raspberry Pi and Arduino for en-
vironmental monitoring applications. Procedia Com-
puter Science.
Mohanraj, K., Balaji, N., and Chithrakkannan, R. (2017).
IoT based patient monitoring system using Raspberry
Pi 3 and Lab view. Pakistan Journal of Biotechnology.
Samourkasidis, A. and Athanasiadis, I. (2017). A minia-
ture data repository on a Raspberry Pi. Electronics
(Switzerland).
Saraiva, L., Alcaso, A., Vieira, P., Ramos, C., and Cardoso,
A. (2016). Development of a cloud-based system for
remote monitoring of a PVT panel. Open Engineer-
ing.
Shete, R. and Agrawal, S. (2016). IoT based urban climate
monitoring using Raspberry Pi. International Confer-
ence on Communication and Signal Processing.
Toma, D., Del Rio, J., Jirka, S., Delory, E., and Pearlman,
J. (2014). Smart electronic interface for web enabled
ocean sensor systems. 2014 IEEE Sensor Systems for
a Changing Ocean, SSCO 2014.
ICAART 2020 - 12th International Conference on Agents and Artificial Intelligence
278
