
Saliency Maps of Video-colonoscopy Images for the Analysis of Their
Content and the Prevention of Colorectal Cancer Risks
Valentine Wargnier-Dauchelle
a
, Camille Simon-Chane
b
and Aymeric Histace
c
ETIS Lab, ENSEA, 6 Av. du Ponceau, Cergy-Pontoise, France
Keywords:
Colorectal Cancer, Video-colonoscopy, Polyp Detection, Computer Aided Diagnosis, Saliency Maps, Bag of
Features, SVM, Approximate Entropy.
Abstract:
The detection and removal of adenomatous polyps via colonoscopy is the gold standard for the prevention of
colon cancer. Indeed, polyps are at the origins of colorectal cancer which is one of the deadliest diseases in
the world. This article aims to contribute to the wide range of methods already developed for the prevention
of colorectal cancer risks. For this, the work is organized around the detection and the localization of polyps
in video-colonoscopy images. The aim of this paper is to find the best description of a bowel image in order
to classify a patch, that is to say a image fragment, as polyp or not. The classification is achieved thanks
to an SVM (Support Vector Machine) using a bag of features. Different types of features extraction will be
compared. Thus, the traditional SURF (Speeded-Up Robust Features) extractor will be compared to local
features extractors like HOG (Histogram of Oriented Gradient) and LBP (Local Binary Pattern) but also to an
original extractor based on the structural entropy.
1 INTRODUCTION
In France, bowel cancer is the second most common
cancer in women and the third most common in men.
In 2017, 45 000 new cases were reported, and col-
orectal cancer caused the death of 9294 men and 8390
women in France. Survival rates vary greatly based
on the progress of the cancer when it is detected and
the beginning of the medical treatment (surgical or
drugs). Indeed, the chances of survival are around
90% if the cancer is detected during the first stage
whereas they are around only 5% for stage V.
For these reasons, the early detection of polyps
is fundamental. However, studies show that 26%
of polyps present in the gut remain undetected by
doctors during a video-colonoscopy. Some are sim-
ply invisible to the camera, others are present in the
video stream and therefore detectable. Thus, com-
puter aided diagnosis is a major issue in the diagnosis
of colorectal cancer. Many methods have been pro-
posed in recent years to reduce polyp miss rate and
improve detection capabilities. These methods can be
divided into three groups : ad-hoc, machine learning
and hybrid methods.
a
https://orcid.org/0000-0003-1883-791X
b
https://orcid.org/0000-0002-4833-6190
c
https://orcid.org/0000-0002-3029-4412
The majority of ad-hoc methods are based on ex-
ploiting low-level image processing methods to esti-
mate candidate polyp boundaries. For example, (Iwa-
hori et al., 2013) use Hessian filters, (Bernal et al.,
2015), intensity valleys and (Silva et al., 2014), the
Hough transform. The extracted information is then
used to localize polyps using the curvatures analysis
in the work of (Zhu et al., 2010), the ellipsoidal shape
search according to the (Kang and Doraiswami, 2003)
or a combination of both for (Hwang et al., 2007).
For machine learning methods, texture and color
information were often used as descriptors such as
color wavelets in the work of (Karkanis et al., 2003),
coocurrence matrices for (Ameling et al., 2009) or lo-
cal binary patterns (LBP) which are exploited in the
work of (Gross et al., 2009). Some of the most recent
methods use deep learning as in the work of (Ribeiro
et al., 2016) among many others in the last four years.
Finally, hybrid methods combine both methodolo-
gies for polyp detection. For instance, (Tajbakhsh
et al., 2014) combine edge detection and feature ex-
traction, (Silva et al., 2014) use hand-crafted features
to filter non-informative image regions and (Ševo
et al., 2016) mix edge density and convolutional net-
works.
The performances of these methods can be evalu-
ated on two criteria: accuracy and computation time.
106
Wargnier-Dauchelle, V., Simon-Chane, C. and Histace, A.
Saliency Maps of Video-colonoscopy Images for the Analysis of Their Content and the Prevention of Colorectal Cancer Risks.
DOI: 10.5220/0009148401060114
In Proceedings of the 13th International Joint Conference on Biomedical Engineering Systems and Technologies (BIOSTEC 2020) - Volume 4: BIOSIGNALS, pages 106-114
ISBN: 978-989-758-398-8; ISSN: 2184-4305
Copyright
c
2022 by SCITEPRESS – Science and Technology Publications, Lda. All rights reserved
Indeed, a good polyp detection algorithm must detect
most of the polyps without too many false alarms.
To be clinically applicable, it also has to meet real-
time constraints. For videos acquired at 25 frames
per second that corresponds to a maximal processing
time of 40 ms per frame. A comparison of recent
methods performances is achieved in (Bernal et al.,
2017). Ad-hoc method often present good computa-
tion time but a weaker accuracy and conversely for
machine learning methods. Active learning method-
ologies have been introduced in the work of (Anger-
mann et al., 2016) to reinforce the compromise be-
tween performance and computation time.
The recent YOLOv3 deep learning architec-
ture (Redmon and Farhadi, 2018) represents a ma-
jor step further for reliable and real-time polyp de-
tection. Nevertheless, the need for specific computa-
tion resources (GPU), can be seen as a limitation for a
routine to be used and integrated in standard colono-
scope.
Alternatively to "fast" deep learning approach like
Yolo, an improved polyp detector, in terms of sensi-
tivity and specificity, can be designed by defining a
saliency detection approach than can be both used for
direct detection or for the reduction of false alarms
using classic shallow methods. In this paper, as an al-
ternative to deep learning approaches, we propose a
saliency-based strategy which aim is to compare dif-
ferent types of classic but also original feature extrac-
tors in order to find the more relevant for polyp detec-
tion and localization tasks.
Our method is based on the previous work
of (Raynaud et al., 2019) about localization of an-
giodysplasias in videocapsule images. They devel-
oped an active contour segmentation approach for
small bowel lesions characterization using saliency
maps as extractors. These saliency maps are gen-
erated using a dictionary learning strategy (bag of
words) associated with a binary SVM classifier. More
precisely, the classifier allows for a given input image
to create a probability map of angiodisplasia presence
using a sliding window of predefined size all over the
image for which center-pixel is associated to the prob-
ability given by the SVM classifier. We propose here
to investigate this method for polyp detection and lo-
calization.
In this paper, we propose to test and estimate per-
formance of different features extractors that will be
used for the dictionary learning step, including classic
ones from the literature, such as SIFT (Scale-Invariant
Features Transform) but also an original one based on
approximate entropy (Histace et al., 2014).
The paper is organized as follows: in section 2 we
introduce our methodology and present the different
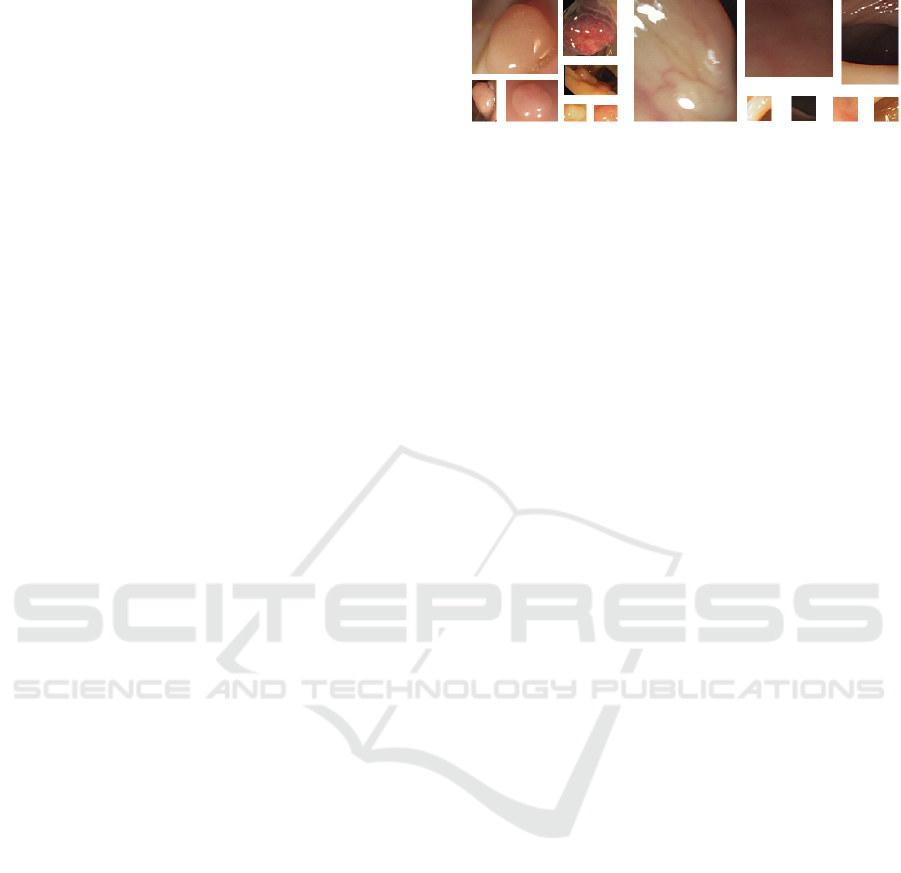
(a) (b)
Figure 1: Examples of patches used for training: (a) Polyp
patches. (b) Non-polyp patches.
features extractor used. Then section 3 presents the
experiments and the results for each extractor. Finally,
section 4 concludes the paper.
2 METHODOLOGY
Our method can be divided into two parts. First, we
have achieved the training and the evaluation of the
different bag of features using patches extracted from
the classic set of colonoscopic data known as CVC-
Clinic and CVC-Colon database (Bernal et al., 2017).
This training aims to learn how to classify a patch as
a polyp or not from features extracted by the bag of
words. The evaluation on patches permits to judge the
capacity of a two-class SVM, based on a specific bag
of words, to correctly classify a given set of patches.
Based on this, for a given image (taken from a differ-
ent set of the videocolonoscopic images as those used
for training), a saliency map is generated and an eval-
uation of obtained saliency map algorithm is achieved
(section 2.2). The aim of this evaluation is to assess
how the different descriptors perform on complete im-
ages to get a first estimation of the performance re-
lated to a given feature extractor.
2.1 Training
In a polyp detection context, we have tested several
type of features in order to find the best description of
images for colonoscopy. The first step consists in gen-
erating all the descriptors for the images, that is to say,
finding the interest points and describing interest ar-
eas around interest points that will be used for the bag
of features dictionary. The next step is to generate the
associated optimal dictionary. For this, we classically
used the k-means clustering over the descriptors to
obtain the representative features of the images which
will be the words of the dictionary. These words will
be used by the SVM for the classification.
The training is done on patches (see examples
Figure 1). All images considered in this paper are
from the CVC Colon and CVC Clinic databases.
Our specific patches database was composed of 4412
Saliency Maps of Video-colonoscopy Images for the Analysis of Their Content and the Prevention of Colorectal Cancer Risks
107
Table 1: Confusion matrix for the SURF descriptor.
PREDICTED
KNOWN Negative Positive
Negative 0.98 0.02
Positive 0.06 0.94
negative patches and 942 positive patches from the
two databases. 80% of them were used for training
and 20% for the evaluation, first made on a patches
classification task. Negative patches were randomly
selected from the negative images whereas positive
patches were generated from the pixel-wise polyp
ground truth. Three images and there associated
patches were kept out of these databases to generate
the saliency map and evaluate the method on complete
images.
The training and the evaluation are repeated three
times on different set of patches for each of these pa-
rameters combinations: the extraction of patches be-
ing random, the training and the evaluation database
were different for each test.
The patch classification is evaluated using the con-
fusion matrix which gives the percentage of true pos-
itives, false negatives, true negatives and false posi-
tives. For the second step, that is the saliency map de-
tection approach, a psychovisual metric is proposed.
In the following section, short descriptions of the
considered feature descriptors are given along with
obtained results for the patch classification tasks.
2.1.1 SURF Descriptor
The SURF descriptor is considered for its improved
performances in terms of robustness and speed com-
pared to the SIFT descriptor. For the purpose of hav-
ing the best bag of features, we have tested several
combination of parameters namely the dictionary size
(from 500 to 4000 visuals words) and the detector
(SURF and square grid with a size varying from 4 x 4
to 12 x 12 pixels). The SVM kernel has also been cho-
sen in accordance with the best obtained performance.
We have tested the Gaussian, the linear and the poly-
nomial (order 2 and 4) kernel. Finally, we have tested
different types of input images: classical RGB image,
but also each component taken separately (red, green
and blue channels).
For this descriptor the best classifier used a dictio-
nary with 800 words, a square grid (4 x 4 pixels) de-
tector, a multi-scale SURF descriptor, a polynomial
kernel (order 2) and the blue channel as input. The
performance results for this classifier are presented in
the confusion matrix of Table 1.
The blue channel is often used in polyp detection
because it is the most representative of the polyp in-
Table 2: Confusion matrix for the SURF + LBP descriptor.
PREDICTED
KNOWN Negative Positive
Negative 0.98 0.02
Positive 0.11 0.89
formation, as shown by (Bernal et al., 2015). Indeed,
they prove that the blue channel permits to mitigate
useless information like blood vessels in a context of
valley detection. But it can be generalized for all
polyp detection approaches. The size of the dictio-
nary, the detector and the kernel will be the same for
all the bags of words tested.
2.1.2 LBP Descriptor
We have decided to use a LBP descriptor in addi-
tion to the SURF descriptor. Indeed, this type of de-
scriptor adds another local information. Moreover, it
has given satisfying results in the study of (Anger-
mann et al., 2016). This can be explained by the fact
that LBP descriptors code texture information and it
has been proven that polyps have a typical texture as
shown in (Ameling et al., 2009).
This is evaluated on the blue channel, as used
in (Angermann et al., 2016) and because it was the
most relevant channel for the SURF descriptor. The
SURF descriptor is the same as in the previous expe-
rience.
Using the same evaluation protocol, we obtain
the confusion matrix presented in Table 2. With an
unchanged True-Negative detection rate, the True-
Positive detection rate is slightly lower than for the
SURF descriptor alone.
2.1.3 HOG Descriptor
Another classic local descriptor is the HOG descrip-
tor. This type of descriptor is especially efficient for
edge detection. (Iwahori et al., 2013) use this type of
descriptor in their polyp detection method with Hes-
sian filters because polyp and non-polyp regions have
approximately the same color which is not taken into
account by the HOG descriptor.
The HOG features are extracted from the same
multi-scale grid as the SURF descriptor. Because
HOG features are very dense, we have decided to
use it alone, without SURF features. This descrip-
tor was tested on both grayscale and blue channel im-
ages. Always with the same validation conditions,
we have obtained the confusion matrices given in Ta-
bles 3 and 4. In this case there is a slight better True-
Positive detection rate on the grayscale images com-
pared to the blue channel.
BIOSIGNALS 2020 - 13th International Conference on Bio-inspired Systems and Signal Processing
108
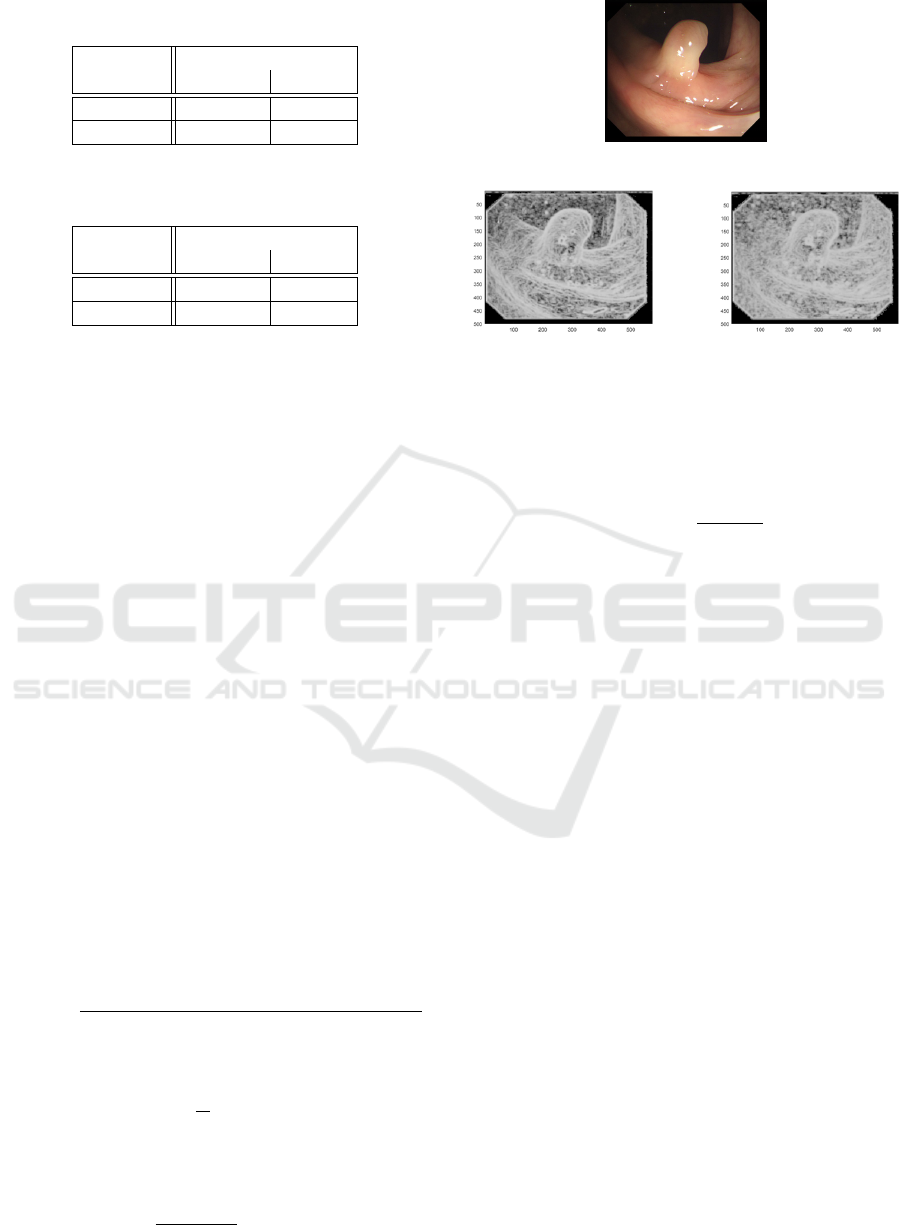
Table 3: Confusion matrix for the HOG descriptor with blue
channel.
PREDICTED
KNOWN Negative Positive
Negative 0.97 0.03
Positive 0.19 0.81
Table 4: Confusion matrix for the HOG descriptor with
grayscale images.
PREDICTED
KNOWN Negative Positive
Negative 0.97 0.03
Positive 0.17 0.83
2.1.4 Classic Descriptors Applied on
Approximate Entropy Maps
In this section, we propose to consider an original ap-
proach for indirect feature extraction, based on Ap-
proximate Entropy (ApEn) formerly introduced for
active contour image segmentation by (Histace et al.,
2014). The ApEn, also called structured entropy, is
a statistical metric which measures the regularity in a
sequence of numerical data. It measures the proba-
bility for two segments, which are extracted from the
same sequence, to stay close if their length is incre-
mented by one.
The parameters are the length of the sequence N,
the length of the extracted segments m and the filter-
ing level r which imposes the necessary similarity be-
tween two sequence to be considered as close. For in-
stance, if we consider the following sequence of num-
bers:
u = [u(1), u(2) ... u(k), u(k + 1) ... u(k + m) ... u(N)]
(1)
We can now construct a series x(i) with N − m + 1
segments from u and where x(i) = [u(i), ...u(i + m)] is
a segment of length m.
Then, we can calculate the coefficient :
C
i
m
(r) =
Number of x( j) such that d(x(i), x( j)) ≤ r
N − m + 1
(2)
where:
d(x(i), x( j)) =
1
m
m
∑
k=1
|x
k
(i) − x
k
( j)| (3)
The average of the coefficients is :
C
m
(r) =
1
N − m + 1
N−m+1
∑
i=1
C
m
i
(r) (4)
(a)
(b) (c)
Figure 2: Approximate entropy images: (a) Original image.
(b) ApEn on grayscale image. (c) ApEn on blue channel
image.
All of this permits to define the approximate en-
tropy as :
ApEn = ln
C
m
(r)
C
m+1
(r)
(5)
Because it measures the regularity in a sequence,
it is efficient to determine homogeneity changes as
Pincus has proven in 1901. For this reason, the metric
can be used to detect edges and in our case, polyps.
(Nagy et al., 2019) use this entropy in order to de-
tect polyps thanks to their specific curves. However,
this entropy has never been used in a machine learn-
ing context. We propose to use it in polyp detection
with this approach.
For this, we have chosen a filtering level r = 1.75,
a sequence length N = 9 × 9 corresponding to a vec-
torised thumbnail (9 × 9 pixels) and a segment length
m = 2 as (Histace et al., 2014) chose. For illustra-
tion, we have computed the distance map in term of
approximate entropy for video-colonoscopy images.
We have applied this on grayscale and blue channel
images. The results are presented on Figure 2.
We show that approximate entropy is a good edge
detector especially when it is applied on grayscale im-
ages. We propose to use this type of image as input
image for our classification thanks to a SURF descrip-
tor which is the most used in features extraction and
a HOG descriptor. Indeed, the HOG descriptor is par-
ticularly appropriate for edges and the approximate
entropy map emphasizes them. The confusion matri-
ces are given in Tables 5 and 6.
Saliency Maps of Video-colonoscopy Images for the Analysis of Their Content and the Prevention of Colorectal Cancer Risks
109
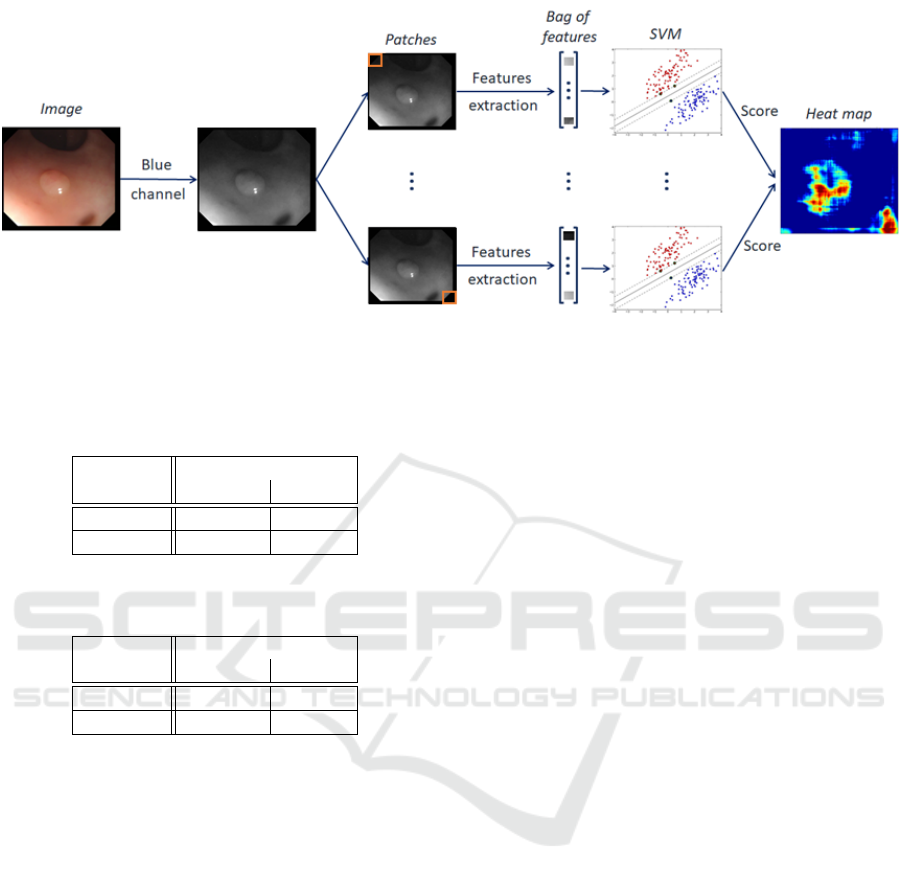
Figure 3: Proposed method. A variant consists in replacing the blue channel by a grayscale image or a distance map.
Table 5: Confusion matrix for the SURF descriptor applied
on ApEn images.
PREDICTED
KNOWN Negative Positive
Negative 0.97 0.03
Positive 0.07 0.93
Table 6: Confusion matrix for the HOG descriptor applied
on ApEn images.
PREDICTED
KNOWN Negative Positive
Negative 0.95 0.05
Positive 0.26 0.74
2.2 Saliency Map Generation
In order to evaluate the capacities of our descriptors
in a clinical context, that is to say on a complete im-
age, we have used the method introduced in (Raynaud
et al., 2019). The saliency map algorithm takes an
image as input (see Figure 3). Only the blue chan-
nel is used for most of our descriptors but grayscales
images and approximate entropy maps are also used.
Then the image is divided in patches shifted by one
pixel in the two direction of the space, thanks to a
moving windows. We have chosen a 100 × 100 pix-
els window size, corresponding to the average size
of polyps in the database. For each patch, features
are extracted according to the bag of features created
during the training. These features permit to feed the
SVM in order to classify the patch and to obtain a re-
lated probability classification. Finally, a heat map is
created from the distance to the positive class for each
patch associated to its central pixel.
3 EXPERIMENTS AND RESULTS
To evaluate performance of the different feature ex-
tractors previously introduced we test the method on
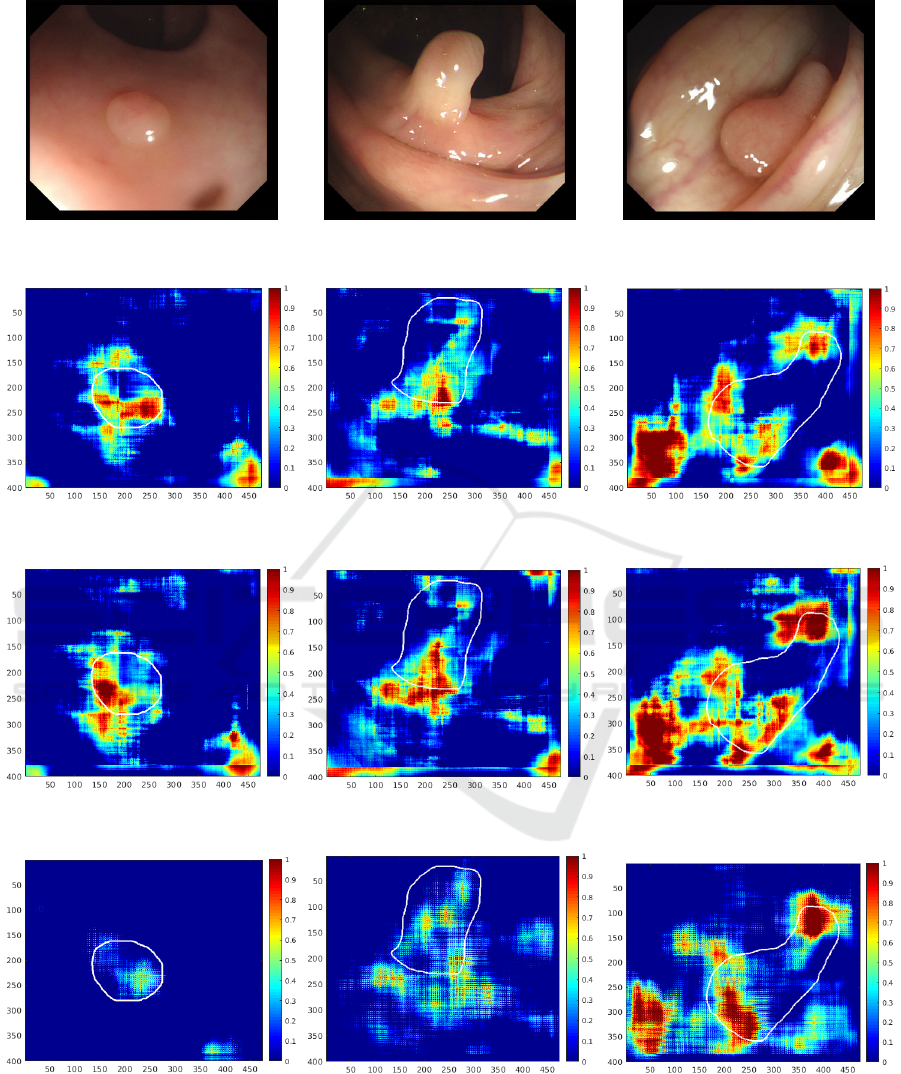
three specific images (first row of Figure 4). These
images were selected from the CVC-Clinic database
for their characteristics, making them representative
of the different types of polyps that can be found in
a clinical context: a flat polyp seen from above, a
pedunculated polyp seen from the side and a polyp
which is slightly hidden by bowel folds. Then we can
create the probability maps with the different descrip-
tors, through the SVM local response as described in
previous section. These results are shown in Figure 4.
We first notice that all the descriptors predict the
specular highlight as a polyp. Indeed, the third image
presents very clearly a specular light spot at the bot-
tom left and the polyp presence probability is high in
this area for all the descriptors. It is due to the typ-
ical form of a polyp, called blob, which predisposes
light reflection. The only exception is the SURF de-
scriptor using the approximated entropy (Figure 4(r)).
It is not sensitive to this type of reflection which is a
major advantage since specular light is a problem in
many polyp detection methods of the literature.
Additionally, results show that the LBP feature in
addition of the SURF descriptor (Figure 4(g, h, i)),
permit to reinforce the decision taken with the SURF
descriptor only (Figure 4(d, e, f)).
The HOG descriptor with grayscale images (Fig-
ure 4(m, n, o)) is not at all specific as almost the entire
image is considered as a polyp. On the other hand,
the HOG descriptor applied on the blue channel (Fig-
ure 4(j, k, l)) of the images is very specific. Indeed,
the polyp presence probability higher than 0,5 only on
the polyp, especially for the flat polyp (Figure 4(j)).
The HOG descriptor using the approximate entropy
BIOSIGNALS 2020 - 13th International Conference on Bio-inspired Systems and Signal Processing
110
(a) (b) (c)
(d) (e) (f)
(g) (h) (i)
(j) (k) (l)
Figure 4: Saliency maps where the ground truth is drawn in white: (a, b, c) Original image. (d, e, f) With SURF descriptor.
(g, h, i) With SURF and LBP descriptor. (j, k, l) With HOG descriptor on blue channel. (m, n, o) With HOG descriptor on
grayscale images. (p, q, r) With SURF descriptor on ApEn images. (s, t, u) With HOG descriptor on ApEn images.
Saliency Maps of Video-colonoscopy Images for the Analysis of Their Content and the Prevention of Colorectal Cancer Risks
111
(m) (n) (o)
(p) (q) (r)
(s) (t) (u)
Figure 4: Saliency maps where the ground truth is drawn in white: (a, b, c) Original image. (d, e, f) With SURF descriptor.
(g, h, i) With SURF and LBP descriptor. (j, k, l) With HOG descriptor on blue channel. (m, n, o) With HOG descriptor on
grayscale images. (p, q, r) With SURF descriptor on ApEn images. (s, t, u) With HOG descriptor on ApEn images (cont.).
(Figure 4(s, t, u)) also presents this feature. The prob-
ability is higher on the polyp with the second but it is
a little bit less specific. This high specificity could be
very interesting in polyp detection.
In fact, all the current methods have a very good
sensitivity but weak specificity. It means that almost
all the polyps are detected but the method introduces a
lot of false alarms. This is a problem because they can
distract the doctor during the colonoscopy. Moreover,
flat polyps are a major challenge of computer aided
diagnosis for colonoscopy because most of the unde-
tected polyps during this exam are flat polyps. Polyps
like the second and third images are easily detectable
by the clinician. Thereby, our method can be use as
a refinement method pre-processed colonoscopy im-
ages. The pre-processing could be performed by a
method among those proposed in the literature. Our
refinement method could then be applied on the parts
of the image defined as polyps by the first method.
This step would eliminate false alarms, improving the
performances of current methods.
4 CONCLUSION AND
DISCUSSION
In this paper, we compared several colonoscopy im-
age descriptors for bag of words. We show that the
HOG descriptor applied on the blue channel of the
BIOSIGNALS 2020 - 13th International Conference on Bio-inspired Systems and Signal Processing
112
(a) (b)
(c) (d)
(e) (f)
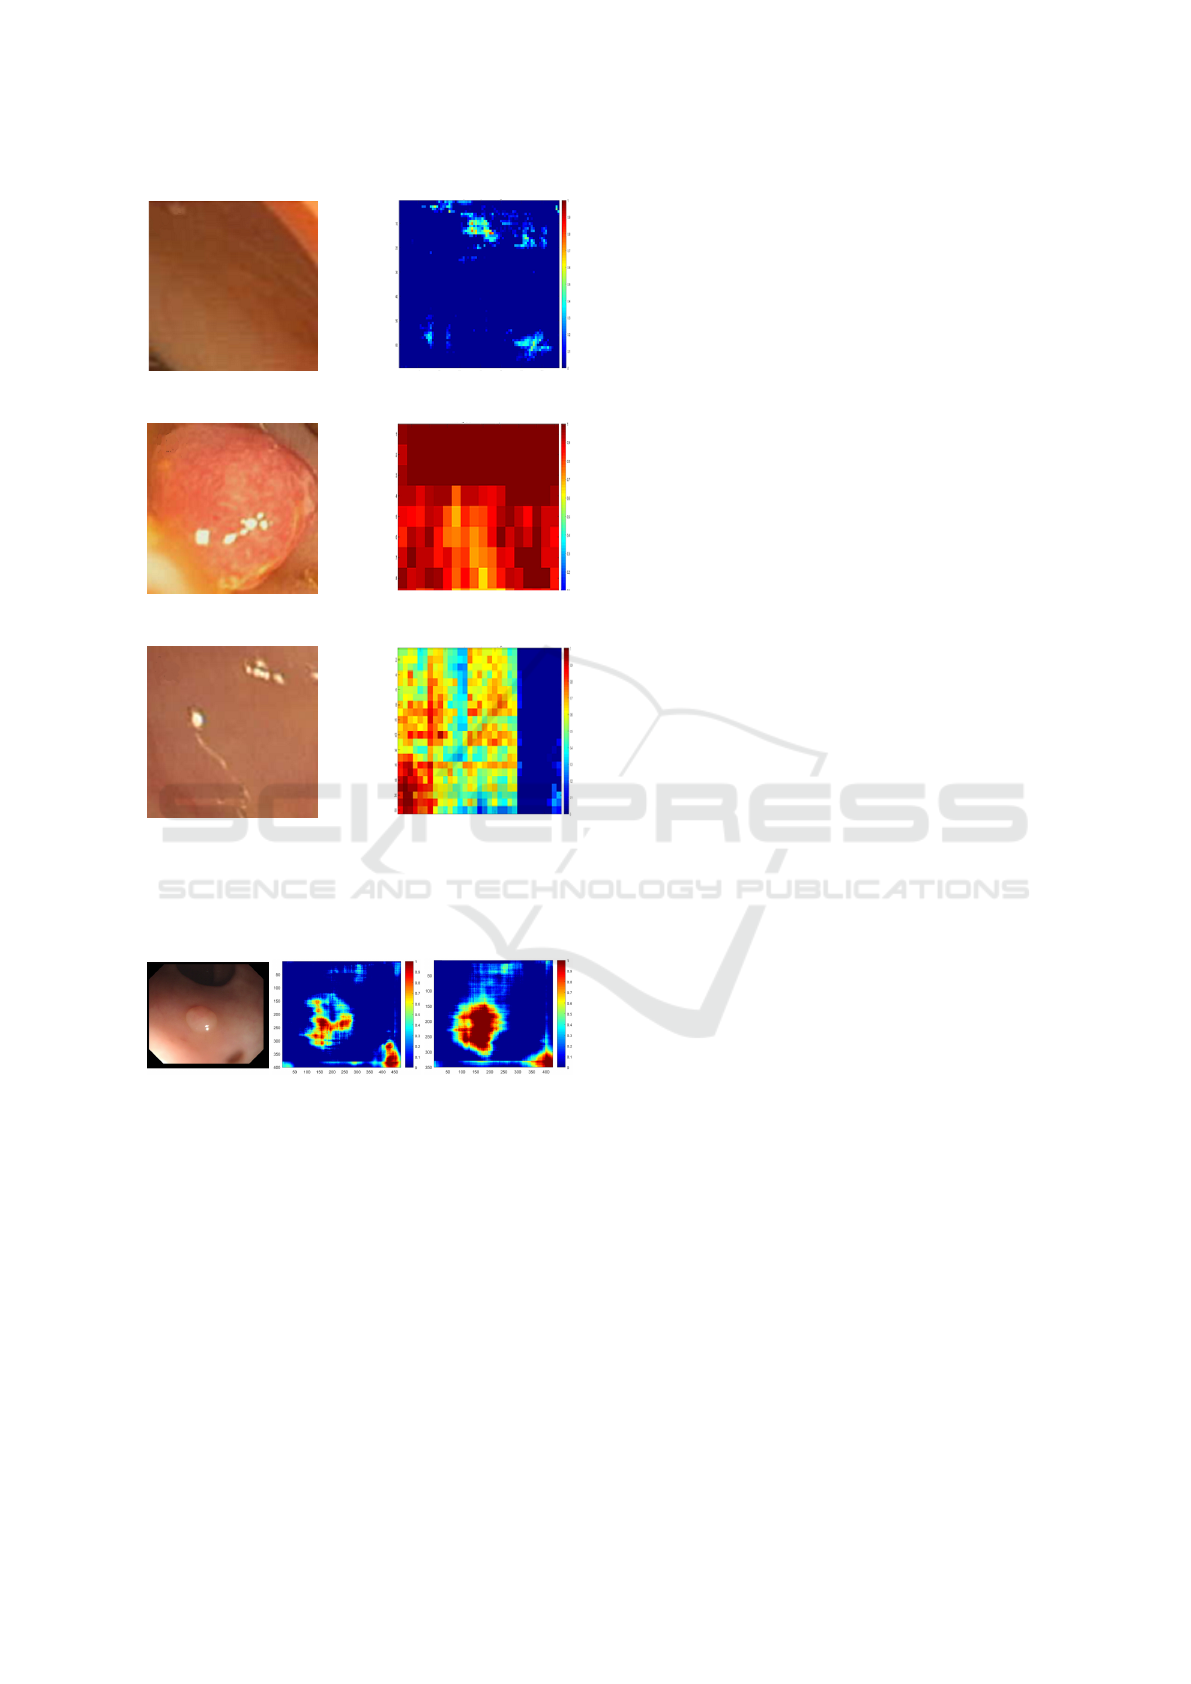
Figure 5: Tests on patches with the SURF descriptor: (a, b)
Patch without polyp and corresponding map. (c, d) Patch
with a easily detectable polyp and corresponding map. (e,
f) Patch with a less visible polyp and corresponding map.
(a) (b) (c)
Figure 6: Patches size test with the SURF descriptor: (a)
Original image. (b) Saliency map with a 100 x 100 pixels
window. (c) Saliency map with a 150 x 150 pixels window.
image could be use as a confirmation in another polyp
detection method. We point also the insensitivity to
specular light of the SURF descriptor associated to
the approximated entropy. As the specular light is
a problem in most of the polyp detection method, it
could be useful associated to another method. An-
other solution is to use images where specular light
has been removed by image processing as in (Sánchez
et al., 2017).
These results also show that the detection spreads
around the ground truth. A solution could be to re-
inforce our training database adding offset patches.
Indeed, our current database only present centered
polyps. For more robustness and to train our algo-
rithm to detect cut or decentered polyps, the diversifi-
cation of the database is necessary.
At last, the confusion matrix and the tests on
patches are good as shown in the Figure 5. Never-
theless, the tests on complete images are not totally
satisfactory. This could be partly due to the weak ro-
bustness of the database but it is also due to the size
of the moving window in the segmentation algorithm.
This parameter is fundamental for the success of our
method. Our work is based on the comparison of im-
ages descriptors with stable settings but, in order to
use the method for polyp detection, this parameter
must be adjusted. Indeed, the results are completely
different according when varying the moving window
size, as shown in the Figure 6.
The study proposed here shows that our method
opens realistic alternative to CNN (Convolutional
Neural Network) approaches, even if the parameter
settings needs to be improved in order to optimize the
saliency map generation. This latter could then be-
come, on its own, a detection map, but also used to
reduce the False-Positive rate related to classic ma-
chine learning methods such as boosting or SVM for
instance.
REFERENCES
Ameling, S., Wirth, S., Paulus, D., Lacey, G., and Vi-
larino, F. (2009). Texture-based polyp detection in
colonoscopy. In Bildverarbeitung für die Medizin
2009, pages 346–350. Springer.
Angermann, Q., Histace, A., and Romain, O. (2016). Ac-
tive learning for real time detection of polyps in video-
colonoscopy. Procedia Computer Science, 90:182–
187.
Bernal, J., Sánchez, F. J., Fernández-Esparrach, G., Gil,
D., Rodríguez, C., and Vilariño, F. (2015). Wm-dova
maps for accurate polyp highlighting in colonoscopy:
Validation vs. saliency maps from physicians. Com-
puterized Medical Imaging and Graphics, 43:99–111.
Bernal, J., Tajkbaksh, N., Sánchez, F. J., Matuszewski, B. J.,
Chen, H., Yu, L., Angermann, Q., Romain, O., Rus-
tad, B., Balasingham, I., et al. (2017). Compara-
tive validation of polyp detection methods in video
colonoscopy: results from the miccai 2015 endo-
scopic vision challenge. IEEE transactions on med-
ical imaging, 36(6):1231–1249.
Gross, S., Stehle, T., Behrens, A., Auer, R., Aach, T., Wino-
grad, R., Trautwein, C., and Tischendorf, J. (2009). A
comparison of blood vessel features and local binary
patterns for colorectal polyp classification. In Medical
Imaging 2009: Computer-Aided Diagnosis, volume
Saliency Maps of Video-colonoscopy Images for the Analysis of Their Content and the Prevention of Colorectal Cancer Risks
113

7260, page 72602Q. International Society for Optics
and Photonics.
Histace, A., Bonnefoye, E., Garrido, L., Matuszewski, B. J.,
and Murphy, M. F. (2014). Active contour segmen-
tation based on approximate entropy - application to
cell membrane segmentation in confocal microscopy.
In BIOSIGNALS 2014 - Proceedings of the Interna-
tional Conference on Bio-inspired Systems and Signal
Processing, ESEO, Angers, Loire Valley, France, 3-6
March, 2014, pages 270–277.
Hwang, S., Oh, J., Tavanapong, W., Wong, J., and
De Groen, P. C. (2007). Polyp detection in
colonoscopy video using elliptical shape feature. In
Image Processing, 2007. ICIP 2007. IEEE Interna-
tional Conference on, volume 2, pages II–465. IEEE.
Iwahori, Y., Shinohara, T., Hattori, A., Woodham, R. J.,
Fukui, S., Bhuyan, M. K., and Kasugai, K. (2013).
Automatic polyp detection in endoscope images using
a hessian filter. In proceedings of MVA conference,
pages 21–24.
Kang, J. and Doraiswami, R. (2003). Real-time image
processing system for endoscopic applications. In
CCECE 2003-Canadian Conference on Electrical and
Computer Engineering. Toward a Caring and Hu-
mane Technology (Cat. No. 03CH37436), volume 3,
pages 1469–1472. IEEE.
Karkanis, S. A., Iakovidis, D. K., Maroulis, D. E., Karras,
D. A., and Tzivras, M. (2003). Computer-aided tumor
detection in endoscopic video using color wavelet fea-
tures. IEEE transactions on information technology in
biomedicine, 7(3):141–152.
Nagy, S., Sziová, B., and Pipek, J. (2019). On structural en-
tropy and spatial filling factor analysis of colonoscopy
pictures. Entropy, 21(3):256.
Raynaud, G., Simon-Chane, C., Jacob, P., and Histace, A.
(2019). Active contour segmentation based on his-
tograms and dictionary learning. In proceedings of
VISAPP conference, pages 609–615.
Redmon, J. and Farhadi, A. (2018). Yolov3: An incremental
improvement. arXiv.
Ribeiro, E., Uhl, A., and Häfner, M. (2016). Colonic
polyp classification with convolutional neural net-
works. In Computer-Based Medical Systems (CBMS),
2016 IEEE 29th International Symposium on, pages
253–258. IEEE.
Sánchez, F. J., Bernal, J., Sánchez-Montes, C., de Miguel,
C. R., and Fernández-Esparrach, G. (2017). Bright
spot regions segmentation and classification for spec-
ular highlights detection in colonoscopy videos. Ma-
chine Vision and Applications, 28(8):917–936.
Ševo, I., Avramovi
´
c, A., Balasingham, I., Elle, O. J., Bergs-
land, J., and Aabakken, L. (2016). Edge density based
automatic detection of inflammation in colonoscopy
videos. Computers in biology and medicine, 72:138–
150.
Silva, J., Histace, A., Romain, O., Dray, X., and Granado,
B. (2014). Toward embedded detection of polyps in
wce images for early diagnosis of colorectal cancer.
International Journal of Computer Assisted Radiology
and Surgery, 9(2):283–293.
Tajbakhsh, N., Gurudu, S. R., and Liang, J. (2014). Au-
tomatic polyp detection using global geometric con-
straints and local intensity variation patterns. In In-
ternational Conference on Medical Image Computing
and Computer-Assisted Intervention, pages 179–187.
Springer.
Zhu, H., Fan, Y., and Liang, Z. (2010). Improved curva-
ture estimation for shape analysis in computer-aided
detection of colonic polyps. In International MICCAI
Workshop on Computational Challenges and Clinical
Opportunities in Virtual Colonoscopy and Abdominal
Imaging, pages 9–14. Springer.
BIOSIGNALS 2020 - 13th International Conference on Bio-inspired Systems and Signal Processing
114
