
Image Quality Comparison between Synthetic 2D Mammograms
Obtained with 15° and 40° X-ray Tube Angular Range: A
Quantitative Phantom Study
R. Lamastra
1,2
,
P. Barca
1,2
, M. G. Bisogni
1,2
, D. Caramella
3
, V. Rosso
1,2
, R. M. Tucciariello
1,2
,
A. C. Traino
4
and M. E. Fantacci
1,2
1
Department of Physics, University of Pisa, Pisa, Italy
2
INFN, Pisa Section, Pisa, Italy
3
Department of Translational Research on New Technologies in Medicine and Surgery, University of Pisa,
Pisa, Italy
4
Unit of Medical Physics, Pisa University Hospital “Azienda Ospedaliero-Universitaria Pisana”, Pisa, Italy
valeria.rosso@pi.infn.it, raffaele.tucciariello@df.unipi.it, c.traino@ao-pisa.toscana.it, maria.evelina.fantacci@unipi.it
Keywords: Synthesized Mammography, Digital Breast Tomosynthesis, Image Quality, Angular Range.
Abstract: In this work we present an image quality comparison between synthesized mammograms (SMs) obtained
from Digital Breast Tomosynthesis (DBT) acquisitions with 15° (SM
15
) and 40° (SM
40
) X-ray tube angular
range. In fact, since wide-angle DBT is characterized by a better spatial resolution in depth but also by worse
performance in detecting microcalcifications than narrow-angle DBT, an objective image quality analysis of
SM images could be of pratical interest. Four phantoms were employed in this study and their images were
acquired using an Amulet Innovality mammographic device. The image quality comparison was conducted
by evaluating spatial resolution, contrast and noise properties of the images. Our results show that SM
40
images are characterized by better spatial resolution performance than SM
15
in terms of Modulation Transfer
Function but also by worse performance in the detection of low-contrast details. In fact, higher contrast-to-
noise ratio values were obtained with SM
15
than with SM
40
. Noise properties of the images were also
investigated through the Noise Power Spectrum (NPS) calculation: no differences in NPS shapes were found
in both modalities, while noise magnitude results significantly different. In addition, Signal-to-Noise Ratio
(SNR) spatial distribution evaluation was assessed by computing SNR maps, in which different pattern were
observed.
1 INTRODUCTION
Digital Breast Tomosynthesis (DBT) is a pseudo-3D
X-ray breast imaging method that reduces the tissue
superposition problems associated with 2D Digital
Mammography (DM), facilitating discrimination
between normal tissue and lesions (Sechopoulos et
al., 2013; Sechopoulos et al., 2013; Vedantham et al.,
2015).
In DBT modality, the X-ray tube rotates along a
fixed axis through a limited angular range and a
projection of the compressed breast is acquired every
few degrees. Starting from these projections data, a
set of fixed-thickness image planes is reconstructed
applying filter back-projection or iterative algorithm
(Vedantham et al., 2015). The resulting reconstructed
images are characterized by a poor spatial resolution
in depth due to the limited angular range (Marshall et
al., 2012; Sechopoulos et al., 2013).
In recent years, a number of DBT systems have
been developed with different geometries and
technical characteristics. In particular, some systems
offer the possibility to adopt different angular range
of acquisition. Generally, devices with a wide angular
range express a better spatial resolution in depth than
those equipped with a narrow angular range (Marshall
et al., 2012; Yoshinari et al., 2014). In this regard,
Chan et al. have shown that wide-angle DBT allows
a better identification of the breast lesions (Chan et
al., 2017). On the other hand, other studies concluded
that narrow-angle DBT performs better than wide-
angle DBT in the identification of microcalcifications
(Chan et al., 2014; Hadjipanteli et al., 2016).
However, although DBT allows a tissue
separation along the z axis, the in-plane spatial
184
Lamastra, R., Barca, P., Bisogni, M., Caramella, D., Rosso, V., Tucciariello, R., Traino, A. and Fantacci, M.
Image Quality Comparison between Synthetic 2D Mammograms Obtained with 15
o
and 40
o
X-ray Tube Angular Range: A Quantitative Phantom Study.
DOI: 10.5220/0009147601840191
In Proceedings of the 13th International Joint Conference on Biomedical Engineering Systems and Technologies (BIOSTEC 2020) - Volume 2: BIOIMAGING, pages 184-191
ISBN: 978-989-758-398-8; ISSN: 2184-4305
Copyright
c
2022 by SCITEPRESS – Science and Technology Publications, Lda. All rights reserved

resolution of the DBT images is generally worse than
the spatial resolution of a DM image (Marshall et al.,
2012; Mackenzie et al., 2017); so radiologists could
have greater difficulty in detecting
microcalcifications, if only DBT images are
examinated. Several studies showed that DM
modality is the procedure with the best performance
in detecting microcalcifications (Rodriguez-Ruiz et
al., 2016; Rose et al., 2013; Hadjipanteli et al., 2017).
Therefore, DBT has been employed in conjunction to
DM acquisition to increase the diagnostic accuracy,
i.e. specificity and sensitivity (Houssami, 2018; Shin
et al., 2014; Svahn et al., 2010). However, the
combined use of DBT with DM procedure leads to a
relevant increase in breast absorbed dose and in breast
compression time compared to DM or DBT alone
(Durand, 2018; Zuckerman et al., 2017; Alshafeiy et
al., 2017). To avoid a DM extra acquisition and
reduce the total dose to the patient, manufacturers
have recently introduced the “synthesized
mammograms” (SMs): projection-like images
obtained by combining the DBT data (Durand, 2018;
Zuckerman et al., 2017; Smith, 2015).
Since wide-angle DBT is characterized by a better
spatial resolution in depth but also by worse
performance in detecting microcalifications with
respect to narrow-angle DBT, SM images could play
an important role as a support for DBT examinations.
Therefore, in order to better determine which
could be the more appropriate approach to adopt for
investigating a given clinical task, a comparison
between SMs obtained with wide and narrow angle is
essential. In this context, the aim of our study is to
compare the image quality between the SMs in wide-
DBT and those obtained in narrow-DBT modality.
2 MATERIALS AND METHODS
An Amulet Innovality (Fujifilm Medical System
USA Inc., USA) mammographic device was
employed in this phantom-study for acquiring SM
images in different X-ray tube angular ranges.
The Amulet Innovality model allows the selection
of two different DBT acquisition modes: the standard
(ST) mode, which uses a narrow angular range of
projections (15°), and the high resolution (HR) mode,
which uses a wide angular range of projections (40°).
SM images obtained in ST and HR mode are
characterized by pixel dimensions of 0.15 mm and
0.10 mm respectively.
Four different phantoms were used in this study
for quantitatively investigating the image quality of
SM images obtained from DBT acquisitions with 15°
(SM
15
) and 40° (SM
40
) X-ray tube angular range. The
phantoms were imaged by using the exposure
parameters closest to the automatic exposure (AE)
settings related to 4 cm thick PMMA slab phantom
(31 kVp and 36 mAs for 15° and 31 kVp and 42 mAs
for 40° case).
The image quality comparison between the SM
15
and SM
40
was performed by evaluating: the
Modulation Transfer Function (MTF), the Contrast-
to-Noise Ratio (CNR), the Noise Power Spectrum
(NPS) and maps of Signal-to-Noise Ratio (SNR).
For spatial resolution evaluation, a home-made
phantom with a tungsten wire of 12.5 µm diameter
(Fig. 1) was specifically assembled. The tungsten
wire was tilted by about 3 degrees and was placed on
1 mm thick PMMA slab.
Figure 1: Image of the home-made phantom (4 x 2 cm
2
)
with a tungsten wire tilted by about 3 degrees employed to
evaluate the Line Spread Function.
In order to simulate a standard 4.5 cm thick breast, a
4 cm thick PMMA slab was placed above the home
made phantom (EUREF, 2006). Spatial resolution
was assessed by calculating the MTF through the
Line Spread Function (LSF) approach (EUREF
2016). A series of profiles were extracted and
combined to obtain the over-sampled LSF. Then, a
Gaussian fit was performed and finally the Fourier
Transform was applied. The MTF was calculated
along the tube-motion direction for both modes, in
order to investigate the influence of the angular range
on the spatial resolution of the system.
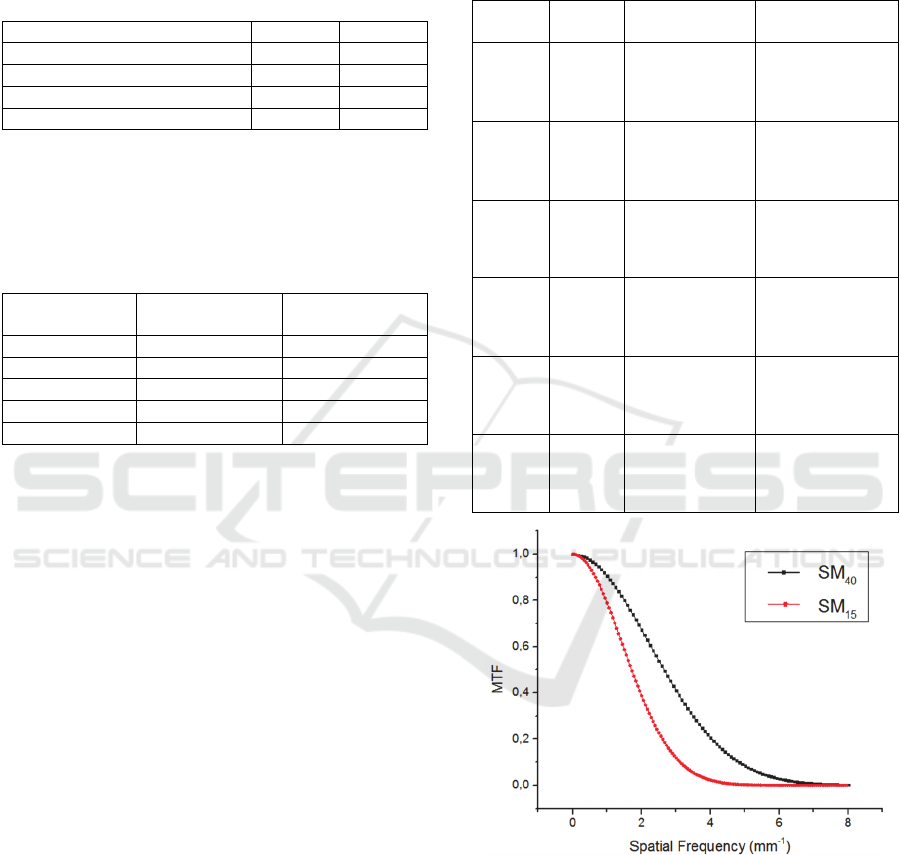
The CNR evaluation was performed examining
the four larger masses of the ACR phantom (Fluke
Biomedical, Everett, WA, USA, Fig. 2) and the 6
groups of low-contrast inserts of the TORMAM
phantom (Leeds Test Objects Ltd, North Yorkshire,
UK, Fig. 3).
To reproduce the standard 4.5 cm thick breast, the
TORMAM phantom was placed on top of a 2.5 cm
thick PMMA plate, while the ACR phantom was
positioned
directly on the breast support plate
Image Quality Comparison between Synthetic 2D Mammograms Obtained with 15
o
and 40
o
X-ray Tube Angular Range: A Quantitative
Phantom Study
185
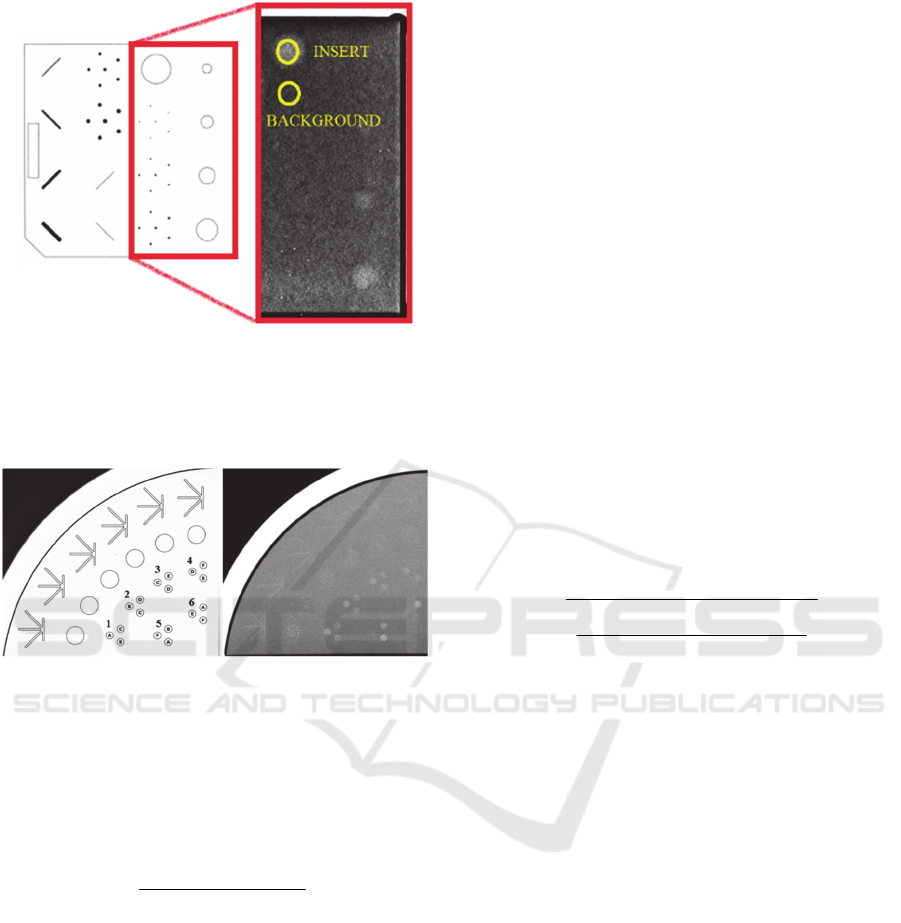
Figure 2: On the left, a detailed picture of the whole ACR
mammographic phantom is presented; on the right, an SM
image of the ACR phantom is highlighted in red. An
example of circular region of interests employed for the
CNR calculation is also shown.
Figure 3: On the left, a detailed picture of the TORMAM
phantom is presented; on the right, an SM image of the 6
groups of low-contrast inserts of the TORMAM phantom is
shown.
(EUREF 2006; EFOMP 2015; Fluke Biomedical
2005). For the CNR calculation, the following
relationship was adopted (Goodsitt MM et al., 2014):
background
backgroundinsert
σ
PVPV
=CNR
−
(1)
where PV
insert
and PV
background
are the mean pixel
values in a region of interest (ROI) placed within the
insert and in the background region respectively;
σ
background
is the standard deviation computed in the
background ROI. Circular ROIs of 15 and 23 pixels
in diameters were used for CNR analysis in the
TORMAM phantom for SM
15
and SM
40
respectively.
These ROI diameters correspond to a spatial
dimension of about 2.3 mm. Conversely, since the
ACR inserts are of different sizes, the ROI
dimensions were adapted to the size of the each detail.
For each phantom, three acquisitions were performed
adopting the same exposure parameters; the average
and the standard deviation were then calculated.
A 4 cm thick PMMA plate (30x24x4 cm
3
) was
employed to study the noise spectral properties of the
system. Specifically, noise properties of SM
15
and
SM
40
were investigated through the calculation of the
NPS. The NPS was computed by applying the
Siewerdsen approach (Siewerdsen et al., 2002). A set
of radial profiles of the 2D NPS was extracted from a
circular ROI centered to the origin of the frequency
space. The dimension of the ROI radius was fixed to
the Nyquist frequency. The average of the radial
profiles was then calculated to better visualize the
shape of the spectrum.
Besides, to further investigate the noise properties
of SMs, SNR maps were calculated averaging 30
acquisitions of the homogeneous 4 cm thick PMMA
phantom. Starting from these 30 acquisitions, the
average and the standard deviation (SD) across the
image set were computed for each pixel to determine
average and SD maps. SNR maps were obtained from
the ratio between the average map and the SD map.
Finally, the SNR map was normalized to the
maximum value. To quantify the differences in SNR
maps, the following non-uniformity index (NUI) was
adopted:
+
−
2
)min()max(
)min()max(
i
i
ROI
i
ROI
ROI
i
ROI
PVPV
PVPV
=NUI
(2)
where PV
ROI
i
is the mean pixel value within the i
th
-
ROI. This index was evaluated on a ROI selected
from the obtained SNR map and by excluding about
1 cm from the edge to avoid edge effects. The NUI
was computed by considering a set of sub-ROIs of
100x100 pixels spanning the whole image. For each
sub-ROI, the mean pixel value was calculated and
then the minimum and maximum values were
employed in Eq. (2).
Image analysis was performed by using ImageJ
(Wayne Rasband, National Institute of Health, USA)
and Origin (Origin-Lab Corporation, MA, USA)
software packages.
3 RESULTS
The spatial resolution of the system was evaluated by
computing the MTF along the tube-motion direction.
The MTFs for SM
15
and SM
40
are shown in Fig 4. The
MTF associated to SM
40
images resulted higher with
respect to the MTF of SM
15
for all spatial frequencies.
Table (1) summarises the spatial frequency values
BIOIMAGING 2020 - 7th International Conference on Bioimaging
186
corresponding to 50%, 20% and 10% of MTF curves
of Fig. 4.
Table 1: Spatial frequency values corresponding to MTF
50%,
MTF
20%
and MTF
10%
for SM
15
and SM
40
images
respectively. The presented values were extracted from MTF
curves shown in Fig. 4.
SM
15
SM
40
N
yq
uist Fre
q
uenc
y
(
m
m
-1
)
3.3 5.0
MTF
50%
Frequenc
y
(m
m
-1
) 1.7 2.7
MTF
20%
Frequency (m
m
-1
) 2.6 4.0
MTF
10%
Frequency (m
m
-1
) 3.1 4.8
Tables (2) and (3) show the results for CNR calculation
obtained for low contrast inserts of the ACR and the
TORMAM phantom respectively.
Table 2: CNR values for SM
15
and SM
40
images, calculated
for four larger masses of the ACR phantom.
Insert size
(
mm
)
CNR
SM
15
CNR
SM
40
2 4.4 ± 0.8 2.0 ± 0.1
1 3.0 ± 0.4 1.0 ± 0.2
0.75 2.5 ± 0.1 1.2 ± 0.2
0.5 1.8 ± 0.6 0.9 ± 0.2
0.25 Not visible Not visible
A lower number of the TORMAM phantom low-
contrast inserts were clearly identifiable in SM
40
images (Table 3), hence they were excluded from our
analysis. At the same time, the mass corresponding to
0.25 mm of thickness of ACR phantom was detectable
neither in SM
15
nor in SM
40
images, while the other
masses were clearly visible in both modalities (Table
2). Both for ACR and TORMAM analysis, the CNR
values obtained for the SM
15
resulted higher with
respect to those obtained in SM
40
images for all the
analyzed inserts. It is possible to observe a clear trend
in these values: more in detail, the CNR values related
to SM
15
images were always about twice than CNR
values related to SM
40
images, for most of the inserts
of the two phantoms. These results are mainly due to a
significant difference in terms of the standard deviation
values of the background which resulted higher
(approximately twice) for SM
40
with respect to SM
15
images. Conversely, the mean pixel value was roughly
the same in both acquisition modes.
The radial NPS obtained from SM
15
and SM
40
images are shown in Fig. 5. It is possible to emphasize
some similarities and some differences in the obtained
NPS curves: firstly, both NPS curves show the same
trend (i.e. the presence of a peak at low frequencies and
a fall-off at high spatial frequencies). However, the
magnitude of the two curves is significantly different:
since the area under the NPS curve is proportional to
the square of the image noise (standard deviation
calculated in a ROI), the SM
40
images result affected
by a higher noise than SM
15
.
Table 3: CNR values for SM
15
and SM
40
images, calculated
for the 6 groups of low contrast inserts of the TORMAM
phantom.
Insert
g
rou
p
Insert
t
yp
e
CNR
SM
15
CNR
SM
40
B 4.6 ± 0.9 2.1 ± 0.4
1 A 4.3 ± 0.5 2.3 ± 0.3
C 1.3 ± 0.3 0.8 ± 0.2
C 2.0 ± 0.7 1.0 ± 0.2
2 B 3.8 ± 0.9 1.9 ± 0.3
D 1.6 ± 0.4 0.6 ± 0.5
D 1.1 ± 0.2 0.4 ± 0.1
3 C 1.5 ± 0.1 1.1 ± 0.2
E 1.1 ± 0.1 Not visible
E 2.8 ± 0.6 Not visible
4 D 1.6 ± 0.6 1.3 ± 0.2
F Not visible Not visible
A 6.1 ± 0.7 3.3 ± 0.2
5 F Not visible Not visible
B 3.9 ± 0.4 2.4 ± 0.2
F Not visible Not visible
6 E 0.8 ± 0.3 Not visible
A 5.6 ± 0.2 2.7 ± 0.1
Figure 4: MTFs computed through the LSF method both for
SM
15
and SM
40
images. LSFs were extracted from a 12.5 µm
diameter tungsten wire tilted by about 3° (Fig. 1).
Fig. 6 presents normalised SNR maps related to
SM
15
and SM
40
images. Clear differences in the non-
uniformity pattern of the two SNR maps can be
observed. A quantitative comparison was done by
computing the NUI: values of 0.40 and 0.26 were
found for SM
15
and SM
40
respectively (i.e. SM
40
Image Quality Comparison between Synthetic 2D Mammograms Obtained with 15
o
and 40
o
X-ray Tube Angular Range: A Quantitative
Phantom Study
187
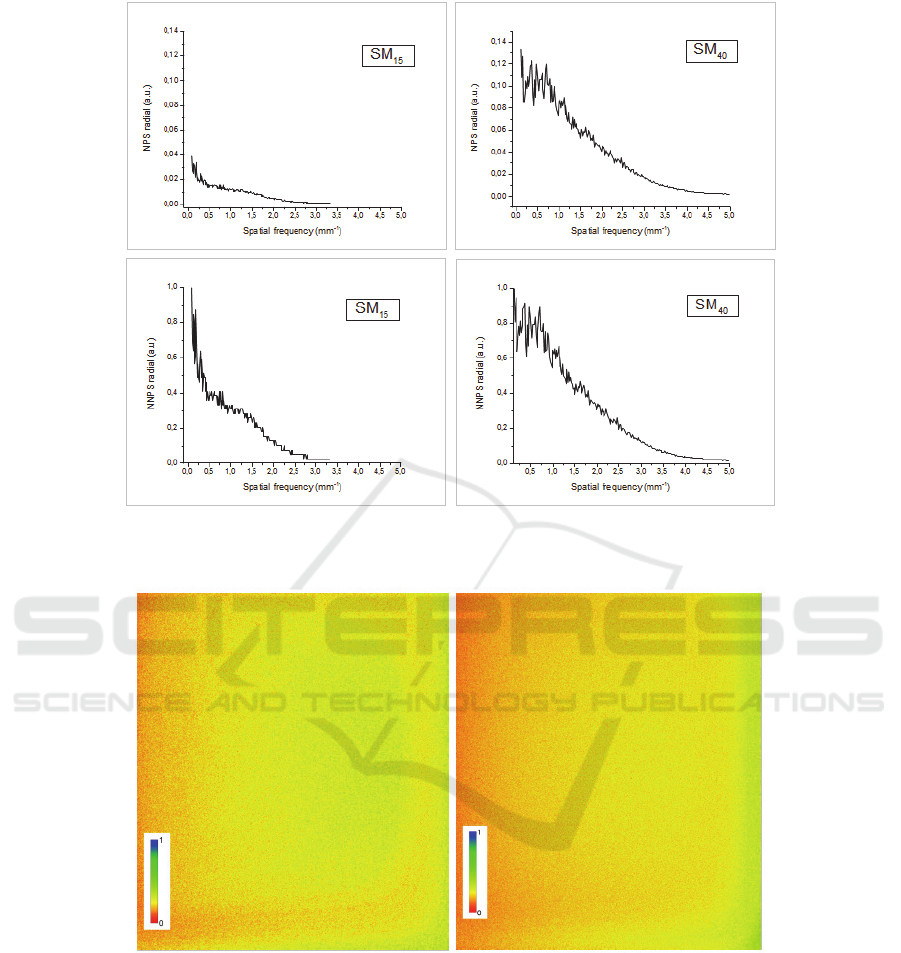
Figure 5: Examples of radial NPS and the normalized radial NPS (NNPS) for SM
15
(on the left) and SM
40
(on the right)
images respectively. The NNPS was computed by normalizing the NPS to the maximum value.
Figure 6: SNR maps obtained from 30 images of the homogeneous PMMA phantom acquired in the same conditions for SM
15
(on the left) and SM
40
(on the right) images. The image dimensions were 21.6 x 27.6 cm
2
. The maps were normalised to the
maximum value in order to obtain a better visualisation of SNR distribution across the image.
images resulted more homogeneous in terms of SNR
spatial distribution).
4 DISCUSSION
The synthesized mammograms were recently
introduced in the clinical practice with the goal of
reducing additional breast dose due to an extra DM
acquisition in DBT examinations. The possibility of
replacing the DBT+DM acquisition with DBT+SM is
currently being evaluated by comparing the image
quality in both modalities. Although SMs exhibit
different image quality properties as compared to DM
images, a number of qualitative and semi-quantitative
studies have highlighted similar results in clinical
performance for both modalities (Alshafeiy et al.,
BIOIMAGING 2020 - 7th International Conference on Bioimaging
188

2017; Zuley et al., 2018; Zuckerman et al., 2016;
Wahab et al., 2018; Murphy et al., 2018). In addition,
few studies have objectively compared some aspects
of SM and DM image quality finding different and
contrasting results. Therefore, to date, it is not clear if
SMs could completely replace the DM images
(Nelsen et al., 2016; Ikejimba et al., 2016; Baldelli et
al., 2018; Barca et al., 2019).
However, the SMs represent a useful diagnostic
support to DBT images, especially for wide-angle
DBT which is characterized by a better spatial
resolution in depth but also by worse performance in
detecting microcalifications with respect to narrow-
angle DBT and DM (Marshall et al., 2012; Yoshinari
et al., 2014; Chan et al., 2014; Hadjipanteli et al.,
2016; Rodriguez-Ruiz et al., 2016; Rose et al., 2013;
Hadjipanteli et al., 2017).
For these reasons, in this phantom study we aimed
to study how the image quality of the SMs was
influenced by different X-ray tube angular range (15°
and 40°). Spatial resolution, contrast and noise
properties of phantom images were assessed.
Specifically, the spatial resolution of the system
was evaluated by computing the MTF. Our results
showed a better performance of SM
40
with respect to
the SM
15
. In fact, the MTF related to SM
40
images
resulted higher with respect to the MTF of SM
15
over
all the spatial frequencies. These results are probably
due to the larger pixel size in SM
15
images than SM
40
(0.15 mm for SM
15
and 0.10 mm for SM
40
images in
our case). In fact, even the projection images express
higher MTF in HR mode than ST mode (National
Health Service UK, 2018). Notice that our
mammographic device allowed to obtain SM images
only with these fixed parameters (i.e. fixed values of
pixel sizes and fixed number of projections for both
modalities). It would be interesting to investigate how
the resolution properties of the system are influenced
by varying the number of projections and by using the
same pixel size.
The CNR values were evaluated for the four larger
masses of the ACR phantom and for the low-contrast
inserts of the TORMAM phantom. Higher values
were found for SM
15
images with respect to SM
40
for
all analyzed inserts; besides, a lower number of
inserts resulted visible in SM
40
images analysis.
Therefore, wide-DBT expresses worse performance
in the detection of low-contrast details: this aspect
could be mainly due to a greater presence of noise in
SM
40
images than in SM
15
, as has been confirmed by
evaluating the standard deviation values in both the
images and by the NPS results. Notice that the
number of projections acquired is the same in both
modalities. It follows that in HR mode each
acquisition is performed after a wider angular step;
this could partially explain why SM
40
images express
higher noise with respect to SM
15
.
Noise properties of the SM
15
and SM
40
images
were also investigated through the calculation of the
NPS. More in detail, the NPS curves obtained in the
two acquisition modes exhibit the same trend,
characterized by the presence of a peak at low
frequencies and by a fall-off at high spatial
frequencies. However, the magnitude of the two
curves is significantly different: the area under the
SM
15
NPS curve results lower than that of SM
40
one,
in agreement with the standard deviation values found
for CNR calculation.
SNR spatial distribution was evaluated by
computing SNR maps. From a first visual inspection,
a different distribution of SNR can be observed. This
spatial distribution was then quantified by calculating
the NUI: values of 0.40 and 0.26 were found for SM
15
and SM
40
respectively. In addition, SM
40
are
characterized by lower SNR values with respect to
SM
15
(Fig. 6): this is related to the previous
mentioned results in terms of noise magnitude of the
two modes.
5 CONCLUSIONS
In this phantom study, the image quality of SM
15
and
SM
40
was evaluated in terms of several parameters.
Better spatial resolution performance was found for
SM
40
while higher CNR values were obtained for
SM
15
, which also showed a lower noise magnitude.
No differences in NPS dependence as a function of
the spatial frequency were found in both modes, while
different pattern of SNR distribution were observed.
Even though further studies are required in terms of
contrast-detail analysis and detectability assessment,
this work could help to better interpret the implication
of the choice between the two modalities as well as
the quality of SM images obtained at different angular
ranges on a specific DBT system.
ACKNOWLEDGMENTS
The presented work is part of the RADIOMA project
which is partially funded by "Fondazione Pisa",
Technological and Scientific Research Sector, Via
Pietro Toselli 29, Pisa.
Image Quality Comparison between Synthetic 2D Mammograms Obtained with 15
o
and 40
o
X-ray Tube Angular Range: A Quantitative
Phantom Study
189

REFERENCES
Sechopoulos I. 2013. A review of breast tomosinthesis. Part
I. The image acquisition process. Med Phys;
40(1):014302
Sechopoulos I. 2013. A review of breast tomosinthesis. Part
II. Image reconstruction, processing, analysis, and
advanced applications. Med Phys; 40(1):014302
Vedantham S, Karellas A, Vijayaraghavan GR, Kopans
DB. 2015. Digital breast tomosynthesis: state
of the art. Radiology; 277(3): 663-684
Marshall NW, Bosmans H. 2012. Measurements of system
sharpness for two digital breast tomosynthesis systems.
Phys. Med. Biol. (57) 7629-7650
Yoshinari ODA, Takaaki ITO, Keiichiro SATO, Morita J.
2014. Development od Digital Mammography System
“AMULET Innovality” for examining breast cancer.
Fujifilm research & development (No.59)
Chan HP, Helvie MA, Hadjiisky L, Jeffries DO et al. 2017.
Characterization of breast masses in digital breast
tomosynthesis and digital mammograms: an observer
performance study. Acad Radiol; 24(11):1372-1379
Chan HP, Goodsitt M, Helvie MA, Zelakiewicz S et al.
2014. Digital Breast Tomosynthesis: observer
performance of clustered microcalcification detection
on breast phantom images acquired with an
experimental system using variable scan angles,
angular increments and number of projection views.
Radiology 273(3)
Hadjipanteli A, Elangovan P, Looney P, Mackenzie A,
Wells K, Dance DR, Young KC. 2016. Detection of
microcalcification clusters in 2D-Mammography and
Digital Breast Tomosynthesis and the relation to the
standard method of measuring image quality. XIV
Mediterranean Conference on Medical and Biological
Engineering and Computing 2016, IFMBE
Proceedings 57, DOI: 10.1007/978-3-319-32703-7_44
Mackenzie A, Marshall NW, Hadjipanteli A, Dance DR,
Bosmans H, Young KC. 2017. Characterisation of
noise and sharpness of images from four digital breast
tomosynthesis systems for simulation of images for
virtual clinical trials. Phys. Med. Biol. (62):2376-2397
Rodriguez-Ruiz A, Castillo M, Garayoa J, Chevalier M.
2016. Evaluation of the technical performance of three
different commercial digital breast tomosynthesis
systems in the clinical environment. Med Phys;
32(6):767-777
Rose SL, Tidwell AL, Bujnoch LJ, Kushwaha AC,
Nordmann AS, Sexton R. 2013. Implementation of
breast tomosynthesis in a routine screening practice: an
observational study. AJR Am J Roent
genol.;200(6):1401–8
Hadjipanteli A, Elangovan P, Mackenzie A, Looney PT,
Wells K et al. 2017. The effect of system geometry and
dose on the threshold detectable calcification diameter
in 2D-mammography and digital breast tomosynthesis.
Phys. Med. Biol. 62:858-877
Houssami N. 2018. Evidence on Synthesized Two-
dimensional Mammography Versus Digital
Mammography When Using Tomosynthesis (Three-
dimensional Mammography) for Population Breast
Cancer Screening. Clinical Breast Cancer 18(4):, 255-
260.e1
Shin SU, Chang JM, Bae MS, Lee SH, Cho N, Seo M, Kim
WH, Moon WK. 2014. Comparative evaluation of
average glandular dose and breast cancer detection
between single-view digital breast tomosynthesis
(DBT) plus single-view digital mammography (DM)
and two-view DM: correlation with breast thickness
and density. Eur Radiol;25(1): 1-8
Svahn T, Andersson I, Chakraborty D, Svensson S, Ikeda
D, Förnvik D, Mattsson S, Tingberg A, Zackrisson S.
2010. The diagnostic accuracy of dual-view digital
mammography, single-view breast tomosynthesis and a
dual-view combination of breast tomosynthesis and
digital mammography in a free-response observer
performance study. Radiat Prot Dosim; 139(1-3):113-
117
Durand MA. 2018. Synthesized Mammography: Clinical
Evidence, Appearance, and Implementation.
Diagnostics; 8(2).pii:E22
Zuckerman SP, Maidment ADA, Weinstein SP, McDonald
E.S, Conant EF. 2017. Imaging With Synthesized 2D
Mammography Differences, Advantages, and Pitfalls
Compared With Digital Mammography. AJR;
209(1):222–229
Alshafeiy TI, Wadih A, Nicholson BT , Rochman CM,
Peppard HR, Patrie JT, Harvey JA. 2017. Comparison
Between Digital and Synthetic 2D Mammograms in
Breast Density Interpretation. AJR Am J
Roentgenol.;209(1):W36-W41
Smith A. Synthesized 2D Mammographic Imaging -
Theory and Clinical Performance. C-View White
Paper. Available online: www.lowdose3d.com/
images/C-View-White Paper.pdf (accessed on 1
November 2018)
EUREF. 2006. European guidelines for quality assurance in
breast cancer screening and diagnosis. Fourth edition.
EUREF. 2016. Protocol for the Quality Control of the
Physical and Technical Aspects of Digital Breast
Tomosynthesis Systems.
EFOMP. 2015. Mammo Protocol. Quality controls in
digital mammography - Protocol of the EFOMP
mammo working group.
Fluke Biomedical. 2005. Mammographic Accreditation
Phantom Operators Manual, Manual No. 18-220-1 Rev.
2
Goodsitt MM, Chan HP, Schmitz A, Zelakiewicz S, Telang
S, Hadjiiski L et al. 2014. Digital breast tomosynthesis:
studies of the effects of acquisition geometry on
contrast-to-noise ratio and observer preference of low-
contrast objects in breast phantom images. Phys Med
Biol 59(19):5883-902
Siewerdsen JH, Cunningham IA and Jaffray DA. 2002. A
framework for noise-power spectrum analysis of
multidimensional images. Medical Physics;
29(11):2655-71
Zuley ML, Guo B, Catullo VJ, Chough DM, Kelly AE et al.
2014). Comparison of two-dimensional synthesized
mammograms versus original digital mammograms
BIOIMAGING 2020 - 7th International Conference on Bioimaging
190

alone and in combination with tomosynthesis images.
Radiology 271(3):664-71
Zuckerman SP, Conant EF, Keller BM et al. 2016.
Implementation of synthesized two-dimensional
mammography in a population-based digital breast
tomosynthesis screening program. Radiology
281(3):730-6
Wahab RA, Lee SJ, Zhang B, Sobel L, Mahoney MC .
2018. A Comparison of full-field digital mammograms
versus 2D synthesized mammograms for the detection
of microcalcifications on screening. Eur J Radiol.
107:14-19
Murphy MC, Coffey L, O’Neill AC, Quinn C, Prichard R
McNally S. 2018. Can the synthetic C view images be
used in isolation for diagnosing breast malignancy
without reviewing the entire digital breast
tomosynthesis data set?. Ir J Med Sci 187(4): 1077-81
Nelsen JS, Wells JR, Baker JA, Samei E. 2016. How does
c-view image quality compare with conventional 2D
FFDM?. Med. Phys. 43(5):2538
Ikejimba LC, Glick SJ, Samei E, Lo JY. 2016. Assessing
task performance in FFDM, DBT and synthetic
mammography using uniform and anthropomorphic
physical phantoms. Med. Phy. 43(10):5593
Baldelli P, Bertolini M, Contillo A, Della Gala G, Golinelli
P, Pagan L, Rivetti S, Taibi A. 2018. A
comparative study of physical image quality in digital
and synthetic mammography from commercially
available mammography systems. Phys Med
Biol;63(16):165020
Barca P, Lamastra R, Aringhieri G, Tucciariello RM,
Traino AC, Fantacci ME. 2019. Comprehensive
assessment of image quality in synthetic and digital
mammography: a quantitative comparison. Australas
Phys Eng Sci Med DOI 10.1007/s13246-019-00816-8
National Health Service UK. 2018. Technical evaluation of
Fujifilm AMULET Innovality digital breast
tomosynthesis system. NHS Breast Screening
Programme equipment report.
Image Quality Comparison between Synthetic 2D Mammograms Obtained with 15
o
and 40
o
X-ray Tube Angular Range: A Quantitative
Phantom Study
191
