
Optical Spectroscopy for the Quality Control of ATMP Fabrication:
A New Method to Monitor Cell Expansion and to Detect
Contaminations
B. Wacogne
1,2
, D. Legrand
1
, C. Pieralli
1
and A. Frelet-Barrand
1
1
FEMTO-ST Institute, Univ. Bourgogne Franche-Comte, CNRS,
15B Avenue des Montboucons, 25030, Besançon, Cedex, France
2
Centre Hospitalier Universitaire de Besançon, Centre d’Investigation Clinique,
INSERM CIC 1431, 25000, Besançon, France
Keywords: Optical Spectroscopy, Advanced Therapy Medicinal Product, Cell Growth Monitoring, Contamination
Detection.
Abstract: Fabrication of Advanced Therapy Medicinal Products takes currently place in clean and sterile environment
and is highly sensitive to any contamination sources. It lasts for several days and is extremely expensive.
Quality controls must be performed throughout the process, especially to monitor cell growth during the
expansion phase and to detect any contaminations. Regular sampling of the bioreactor’s content is required
and subsequent biological investigation are conducted. Major drawbacks are first, a delayed result of the
quality control and second, an added risk to induce new contaminations when sampling the content of the
bioreactor. Here, we present a real time optical spectroscopy method which can be used in a closed system
manner, hence reducing the risk of sampling-related contamination. Analysing the shape of the absorption
spectrum of the bioreactor content allows monitoring the cell growth and alerting users in case of
contamination. Cell concentrations are measured with an accuracy of ± 5% and contamination can be detected
about 3 hours after it occurred. This allows stopping the fabrication as soon as a problem arises leading to
several tens of thousand dollars savings. Consequently, the price of these products should be greatly reduced
and they may be proposed to more patients.
1 INTRODUCTION
ATMPs (Advanced Therapy Medicinal Products)
have recently emerged to offer new treatment
solutions for patients with no further therapeutic
options. For some, they are based on the use of "drug"
cells derived from genetic modification or tissue and
cell engineering. These "living" drugs are subject to
substantial manipulations that allow cells to acquire
new physiological functions, biological
characteristics or reconstruction properties. The
development of new biological drugs is inspired by
the natural processes of the body such as the use of
stem cells for tissue regeneration, lymphocytes for
cancer immunotherapy or apoptotic cells for anti-
inflammatory purposes.
However, the fabrication of these drugs requires
the implementation of complex technologies of cell
sorting, amplification, genetic transduction,
amplification-division, activation, and this at several
stages of production and in sterile clean room type
environment. As for industrial products, their
production is expensive, mainly because of the
complex infrastructure required, the time needed to
complete the production stages and the complex
quality control processes. A schematic description of
the fabrication process of CAR-T cells is given in
figure 1 (Wang 2016). It also applied to other ATMPs
fabrications.
The basic principle consists in sampling the
patient's blood and extract the cells of interest (T cells
for figure 1). These cells are transduced to acquire the
desired therapeutic properties. A sorting step then
makes it possible to keep only the correctly
transduced T cells. From this moment, these
genetically modified cells are amplified/expanded in
a bioreactor for a period that can extend up to 1 week.
At the end of the process, the ATMP is injected to the
patient or cryo-preserved before injection. The goal
of our project (see acknowledgements) is to realize all
64
Wacogne, B., Legrand, D., Pieralli, C. and Frelet-Barrand, A.
Optical Spectroscopy for the Quality Control of ATMP Fabrication: A New Method to Monitor Cell Expansion and to Detect Contaminations.
DOI: 10.5220/0009130000640072
In Proceedings of the 13th International Joint Conference on Biomedical Engineering Systems and Technologies (BIOSTEC 2020) - Volume 1: BIODEVICES, pages 64-72
ISBN: 978-989-758-398-8; ISSN: 2184-4305
Copyright
c
2022 by SCITEPRESS – Science and Technology Publications, Lda. All rights reserved

Figure 1: Fabrication process of CAR-T cells (Wang 2016).
these operations within a miniaturized and
autonomous device. One of the main constraints that
needs to be lifted is the following.
The requirement of no contamination of the
products requires working in a controlled
environment and preserving the closed system as
often as possible. This is frequently made difficult by
the absence of containers, reagents or materials
adapted to the protocol. This constraint implies many
samplings during the protocol such as sampling for
the evaluation of bacteriological contamination. This
increases the risk of contamination, the time of
completion and requires increased traceability. These
evaluations being long, the fabrication process
continues in parallel, sometimes requiring to stop
production after several days in case of a
contamination. These stops actually increase the cost
and delay or even stop the delivery of the drug to the
patient.
The work presented in this paper addresses the
constraint of closed system and real time control of
what happens in the bioreactor during the expansion
phase. The goal is twofold, monitor the cell growth
and detect early contaminations. In-line or real time
measurement techniques have been widely studied
either for cell culture or contaminant development
monitoring, very rarely for both.
For example concerning cell culture, various
techniques have been presented in Teixeira review
(Teixeira, 2009). Techniques based on ultrasonic
measurements (Melchor, 2018) or capacitive
techniques (Lee, 2016) have been proposed.
Impedance monitoring, either in a bulk system
(Cacopardo, 2019) or in a microfluidic chip (Fong
Lei, 2014) has also been presented. In these
references however, indications whether or not the
proposed method can be adapted in a closed system
configuration were not discussed.
Concerning bacteria detection or monitoring,
different sensors to detect Escherichia coli (hereafter
E. coli) have been proposed by Ikonen (Ikonen,
2017). These bacteria can also be detected using
modified Field Effect Transistors (Thakur, 2018).
Detecting several contaminants with a single device
has been demonstrated. The use of fiber optic Fourier
Transform Infra-Red spectroscopy (Hassan, 2016),
quartz crystal sensors (Chang, 2006), and
electrochemistry (Safavieh, 2014) has been reported.
Only very few papers mention both cell
monitoring and contaminant detection. For example
in (Liu, 2017), advanced signal processing applied to
Raman spectroscopy has been proposed. Together
with normal operation condition monitoring, authors
demonstrated the detection of growth problems 5
hours after they stopped feeding the cells. They also
detected effects of contamination with their
monitoring algorithm. However, the nature of the
contamination and the time required to detect it was
not specified.
In this paper, we propose a proof of concept based
on white light absorption spectroscopy used to
continuously monitor the evolution of cells
concentration in a bioreactor and to issue an alarm
signal about 3 hours after a contamination occurred.
The next section of the paper describes the
experimental set-up and biological samples used in
this study. Section 3 presents the results obtained
using two methods based on spectra shape analysis
and Principal Component Analyses (PCA)
respectively. Short discussions of these early results
and aspects concerning socio-economic impacts will
be given in section 4.
2 MATERIALS AND METHODS
For this proof of concept, measurements are not
performed in a closed system configuration.
Adaptation of the method in this particular
environment is shortly discussed in section 4.
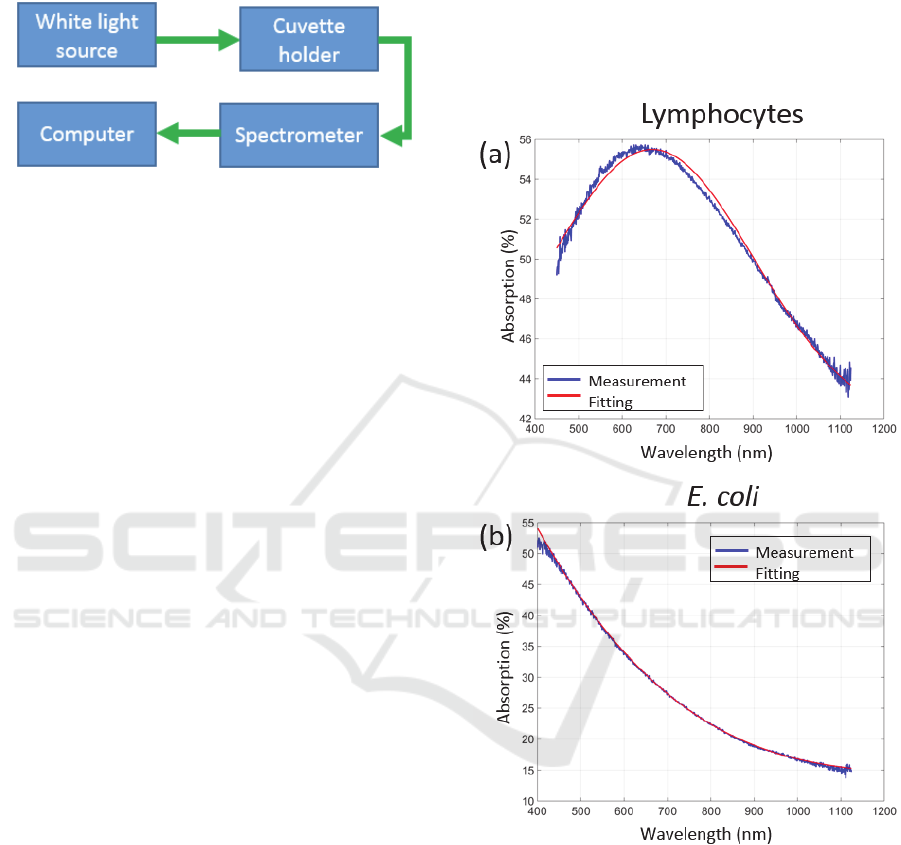
2.1 Experimental Set-up
The extremely simple experimental set-up is
schematically presented in figure 2.
The set-up was composed of a white light source
(Ocean Optics HL 2000) connected to a cuvette
holder (Avantes CUV-UV/VIS) via conventional step
index optical fibers (Thorlabs M25L01). After
propagation through the cuvette, light was launched
into a spectrometer for absorption spectra acquisition
(Ocean Optics QE-Pro). Fluorimeter
Optical Spectroscopy for the Quality Control of ATMP Fabrication: A New Method to Monitor Cell Expansion and to Detect
Contaminations
65
polymethacrylate cuvettes were filled up to 3 mL with
solutions of cells and bacteria (Sigma-Aldricht
C0793-100EA).
Figure 2: Description of the experimental set-up.
Absorption spectra were measured using the
specific feature available in the SpectraSuite software
from Ocean Optics. Reference was obtained with a
cuvette filled with PBS only. After transfer to PC,
data processing was performed using MATLAB™
R2014b version. Spectra used in section 3.2 were
slightly smoothed using a cubic spline algorithm in
order to maximize the R
2
of the spectra fittings.
Principal Component Analysis was performed with
smoothed and normalized spectra.
2.2 Lymphocyte and E. coli
Preparation
Lymphocyte cell lines (Ramos, ATCC, USA) were
cultured in X-Vivo (Lonza, Switzerland) with 5%
FBS (Gibco™ 10270106) and 10%
streptomycine/penicillin (100 µg/mL+100 UI/mL,
CABPES01-0U, Eurobio) in a humidified 37°C, 5%
CO
2
incubator. Cells were recovered after 2-3 days
culture by centrifugation at 700 g, 10 min, 25°C.
Different cell concentrations (10
4
×[1, 2, 4, 6, 8, 10,
20, 30, 40, 50, 60, 70, 80, 90, 100] cells/mL) were
prepared after dilution in autoclaved PBS 1x pH7.4
(Sigma, USA).
Escherichia coli DH5α (NEB, USA) were
cultured in Luria Bertani overnight at 37°C, 180 rpm
in a MaxQ incubator. They were recovered by
centrifugation at 5000 g, 15 min, 20°C and re-
suspended in autoclaved PBS 1x pH7.4 (Sigma,
USA). Optical density of the re-suspension was
measured in a spectrophotometer Shimadzu at 595
nm. Afterwards, different bacteria concentrations
(10
6
×[1, 2, 4, 6, 8, 10, 20, 30, 40, 50, 60, 70, 80, 90,
100] bacteria/mL) were prepared for experiments.
In this work, so-called contaminated spectra
presented below are artificial and made by adding
spectra of lymphocyte and E. coli. This aspect will be
discussed in section 4.
3 EXPERIMENTAL RESULTS
3.1 Calculating Concentrations of Both
Species: A Difficult Way
Examples of spectra recorded with lymphocytes and
E. coli are given in figure 3.
Figure 3: Examples of absorption spectra. (a) Lymphocytes,
(b) E. coli.
Noting that the shapes of the spectral absorptions
of the two species are different, the goal was to
measure the absorption spectrum of the contents of
the bioreactor continuously. For each recorded
spectrum, the idea is to analyse the shape, to separate
the part due to the contribution of lymphocytes from
that due to E. coli and to calculate their respective
concentrations.
To do this, it was necessary to determine the
evolution of the spectra of the two species as a
BIODEVICES 2020 - 13th International Conference on Biomedical Electronics and Devices
66
function of the concentration. Concentration ranges
of the two species were used and, by fitting, it was
possible to express their spectral evolutions as a
function of their concentrations.
Equations (1) to (5) represents the evolution for
lymphocytes.
Spec
(
λ
)=p1.exp−
λ
−p2
p3
(1)
Here, λ is the wavelength and functions “pi”
functions are given by:
p1=a1.exp−
𝐂−a2
a3
(2)
p2=b1.𝐂+b2
(3)
p3=c1.𝐂
+c2.𝐂+c3
(4)
p4=d1.𝐂
+d2.𝐂+d3
(5)
where C is the lymphocytes concentration.
Equations (6) to (10) represents the evolution for
lymphocytes.
Spec
.
(
λ
)
=q1
λ
+q2
λ
+q3
λ
+q4
(6)
Here, λ is the wavelength and functions “qi”
functions are given by:
q1=e1.𝐂
+e2.𝐂+e3
(7)
q2=f1.𝐂
+f2.𝐂+f3
(8)
q3=g1.𝐂
+g2.𝐂+g3
(9)
q4=h1.𝐂
+h2.𝐂+h3
(10)
where C is the E. Coli concentration.
Coefficients used in these equations are given in
table 1.
Table 1: Coefficients used in the above equations.
p1
a1=14.32
a2=4.1×10
5
a3=6.145×10
5
p2
b
1=7.21×10
-5
b2=647
p3
c1=1×10
-10
c2=-1.9×10
-5
c3=325.7
p4
d1=-5×10
-11
d2=1.3×10
-3
d3=6.791
q1
e1=1.2×10
-23
e2=-1.6×10
-15
e3=1.2×10
-9
q2
f1=-3.3×10
-20
f2=5.1×10
-12
f3=-1.7×10
-6
q3
g1=2.8×10
-17
g2=-5.5×10
-09
g3=-8.3×10
-4
q4
h1=-1×10
-14
h2=2.4×10
-6
h3=1.234
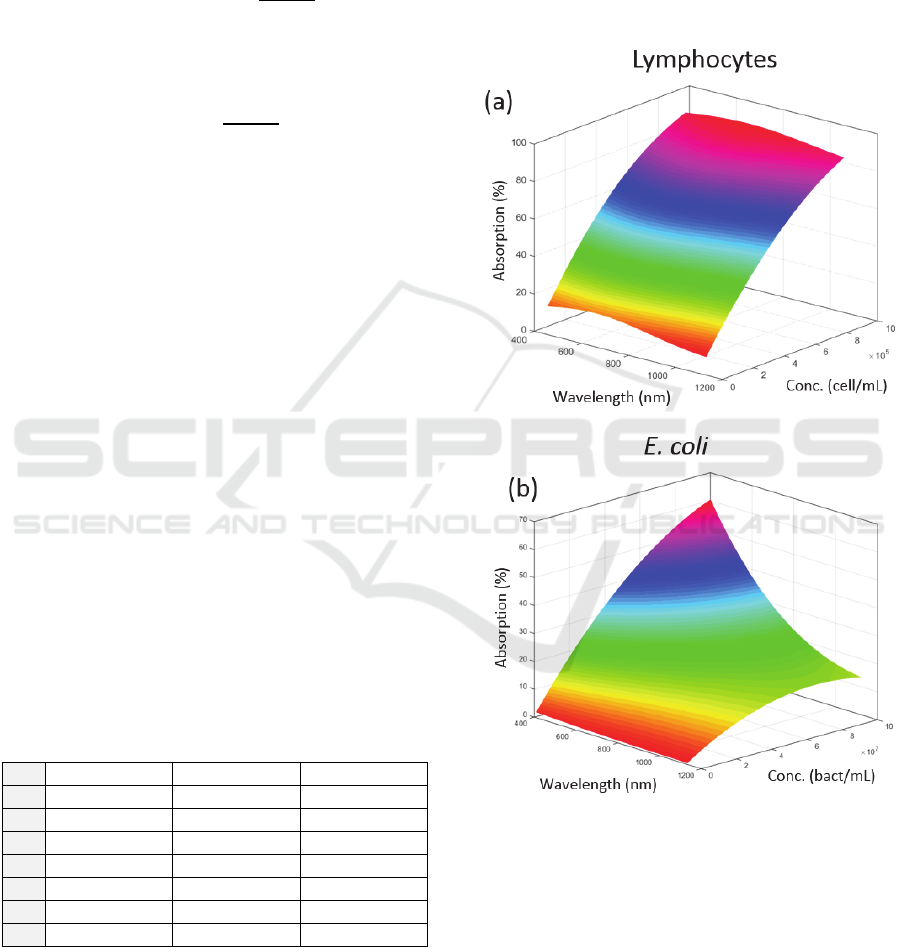
These evolutions are represented in figure 4 (they
were used to fit the experimental spectra presented in
figure 3 (red curves)).
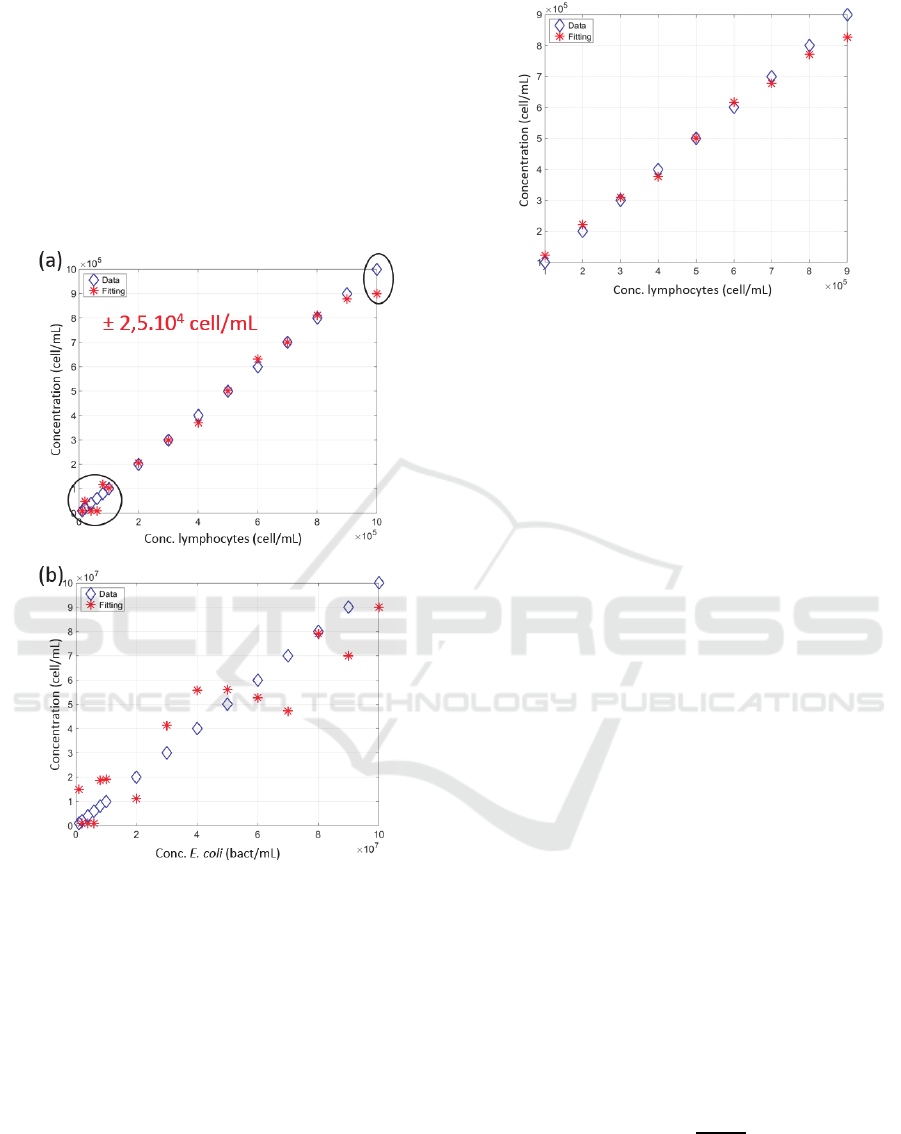
From there, for each recorded spectrum and
considering either lymphocytes or E. coli, we
compared the actual concentration values with those
calculated with the above functions by fitting the
spectra. Figure 5 shows the results obtained.
It was found that the exploitation of the shape of
the spectra to calculate concentrations was effective
only for lymphocyte concentrations ranging from 10
5
to 9×10
5
cell/mL (black circles in figure 5(a) where
the fitting was not effective). In the validity range, an
accuracy of ± 5% was measured.
Figure 4: Theoretical evolutions of the absorption spectra
with concentrations. (a) Lymphocytes, (b) E. coli.
We have also studied other descriptors of the
spectra. By considering their associated colour, it is
shown that, in the HSV base, the “Value” variable
made it possible to describe the concentrations of the
two species. The same is true if we consider the
entropy of spectra. However, when considering
spectra of lymphocytes and E. coli mixtures, it is
extremely difficult to separate their respective
Optical Spectroscopy for the Quality Control of ATMP Fabrication: A New Method to Monitor Cell Expansion and to Detect
Contaminations
67
contributions. The problem becomes insoluble when
several types of pathogens are considered.
Indeed, as long as only lymphocytes are present in
the bioreactor (no contamination), fitting the shape of
the spectra to monitor the cell growth leads to the
same accuracy as what we obtained using
conventional turbidimetry as presented in figure 6.
For the concentration range considered, the area
under the spectra can be modelled using a second
order polynomial function.
Figure 5: Calculating the concentration from the shape of
experimental spectra (a) Lymphocytes, (b) E. coli. Blue
diamonds: real concentrations, red crosses: fitted
concentrations. Black circles in (a): concentration ranges
for which the method does not work.
However, detecting contaminations can be
achieved by considering things differently. This is the
subject of the next section.
Figure 6: Calculating the lymphocyte concentrations from
the area under the spectra (turbidimetry). Blue diamonds:
real concentrations, red crosses: fitted concentrations.
3.2 Monitoring Cell Concentrations
and Detecting Contaminations: A
New Approach
3.2.1 Fitting the Shape of the Absorption
Spectra
We must understand the problem differently. During
the expansion phase, as long as everything is normal
(no contamination), cells concentration can be
monitored using turbidimetry. Now, if contamination
occurs, the shape of the spectrum resulting from the
contribution of the lymphocytes and the contaminant
differs from the ones corresponding to lymphocytes
alone.
The idea is this. During the expansion phase,
absorption spectra are recorded and fitted with a
function representing the shapes of the lymphocytes
spectra when they are alone. An accurate fitting (high
R
2
) means that no contamination has occurred and
lymphocyte concentration is calculated by integrating
the area under the spectra. On the contrary, a bad
fitting (R
2
less than a threshold to be determined)
means that contamination occurred indicating that the
production must be stopped.
This can be achieved using a much simpler
equation than the one depicted in figure 4(a). Indeed,
we do not calculate a concentrations, we only fit the
shape of the recorded spectrum. The following
spectrum description can efficiently be used.
𝐴
𝑏𝑠
(
𝜆
)
=𝑎.𝑒𝑥𝑝−
𝜆−𝑏
𝑐
+𝑑
(11)
The goal is to fit any spectra with this equation.
To do this, constraints were put to coefficients a, b, c
and d. Otherwise, the fitting algorithm (“trust region”
BIODEVICES 2020 - 13th International Conference on Biomedical Electronics and Devices
68
in Matlab™ Curfitting toolbox) always find set of
parameters to describe even contaminated spectra.
The fitting bounds and starting points are summarized
in table 2.
Table 2: Bounds and starting points for fitting lymphocytes
spectra.
Coefficient
Lower
bound
Upper
bound
Starting
p
oint
a 0 200 100
b 600 750 675
c 0 500 250
d 0 200 100
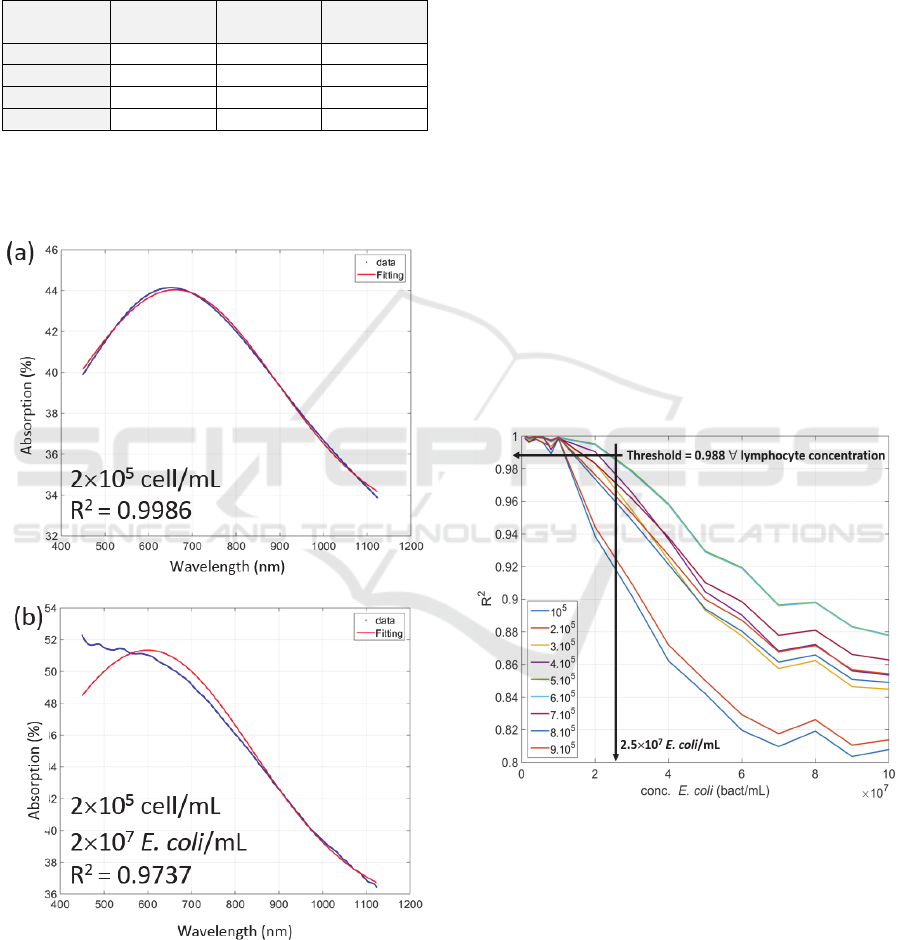
Figure 7 shows example of lymphocytes
absorption spectra fittings using equation (11).
Spectra were slightly smoothed as mentioned above.
Figure 7: Examples of spectra fitting using equation (11).
(a) Lymphocyte concentration = 2×10
5
cell/mL, R
2
=
0.9986. (b) Lymphocyte concentration = 2×10
5
cell/mL, E.
coli concentration = 2×10
7
bact/mL, R
2
= 0.9737.
Figure 7(a) shows a fitting performed with pure
lymphocytes at 2×10
5
cell/mL with R
2
=0.9986.
Considering only pure lymphocyte solutions, R
2
coefficients were always greater than 0.99 for except
for 10
4
and 10
6
cell/mL. Indeed, for these
concentrations, absorption is either too weak or too
strong for our method to work. We did not consider
these concentrations in what follows.
Figure 7(b) shows a fitting performed with the
same lymphocyte concentration contaminated with
2×10
7
E. coli/mL. Because of the contamination, R
2
decreases to 0.9737.
The evolution of R
2
with increasing
concentrations of E. coli for different initial
lymphocyte concentrations is shown in figure 8. Each
curve corresponds to one lymphocyte concentration.
For each lymphocytes concentration, the evolution of
R
2
is plotted as a function of E. coli concentration.
It was found that, whatever the lymphocyte
concentration is, the bacterial detection limit was
about 2.5.10
7
cells/mL with a positivity threshold R
2
= 0.988 (arrows in the figure). Knowing that E. coli
divides every 20 min and considering that the
contamination is due to 1000 bacteria, the warning
signal can be issued 4h52 min post contamination.
Figure 8: Evolution of the R
2
coefficient with the
concentration in E. coli for different lymphocytes
concentrations. The legend corresponds to lymphocyte
concentrations in cell/mL.
3.2.2 Using Principal Component Analysis
Principle Component Analysis was used to further
reduce the time required to issue the alert signal.
Spectra used here were smoothed and normalized as
mentioned above.
Optical Spectroscopy for the Quality Control of ATMP Fabrication: A New Method to Monitor Cell Expansion and to Detect
Contaminations
69
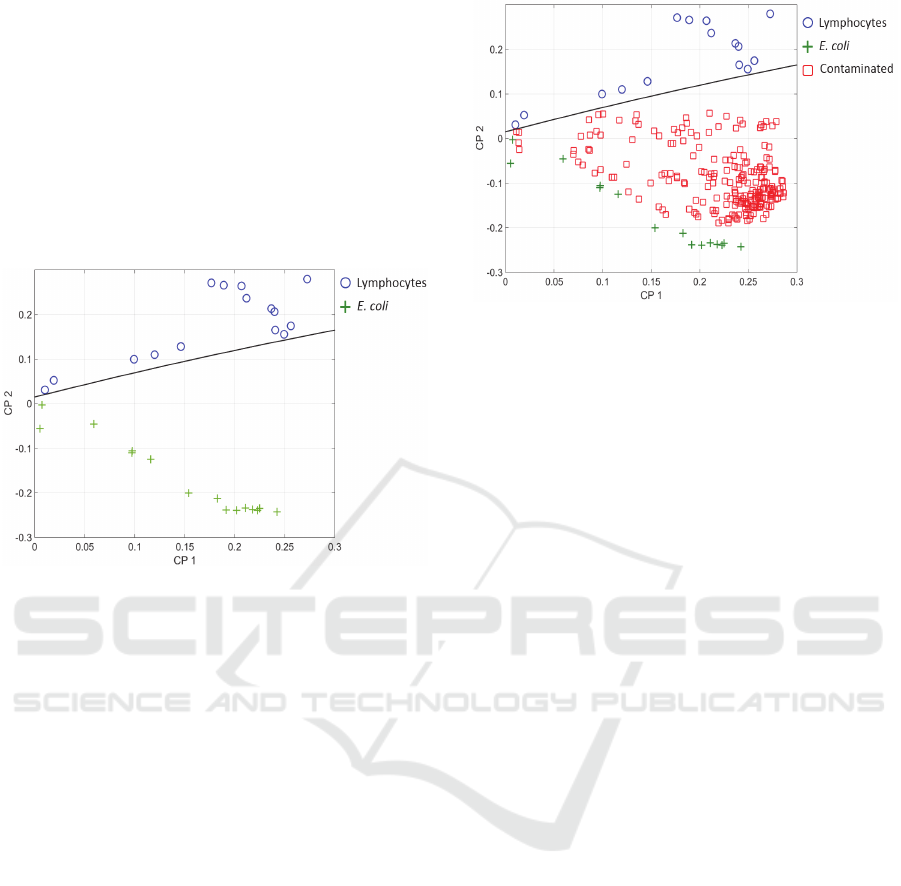
First, it was applied to spectra of pure lymphocytes
and E. coli. The result considering PC1 and PC2 is
shown in figure 9. The two populations were clearly
separated. The black line represents the frontier
between these populations. It was defined by either the
minima of the coordinates of lymphocytes (circles) and
maxima of E. coli (crosses) or the analysis of the mean
and variance of the two distributions. Taking into
account these data, a straight line which separates the
CP1-CP2 domain in two zones was defined (Janné,
2001).
Figure 9: Principal Component Analysis. Blue circles:
lymphocytes, green crosses: E. coli, black line: separation
between lymphocytes and E. coli.
Second, we added the so-called contaminated
spectra. The 30 data used to generate figure 9 form a
base for the pure lymphocytes and E. coli populations.
Contaminated spectra correspond to all possible
combinations of lymphocyte spectra added to E. coli
spectra. They were processed one by one. Each
contaminated spectrum was considered as a 31
rst
data
in the above mentioned base before a new PCA was
performed. This was iterated for the 225 possible
combinations. The result is shown in figure 10 with the
contaminated spectra marked with red squares.
Spectra corresponding to contaminated culture
were all situated in the E. coli region. This means that
the bacteria detection limit was 10
6
cells/mL (the
minimum E. coli concentration considered in this
study). Comparing with the method based on the
spectra shape analysis and considering that the
contamination is due to 1000 bacteria, the warning
signal can now be issued about 3h19 min post
contamination.
Figure 10: Principal Component Analysis. Blue circles:
lymphocytes, green crosses: E. coli, red squares:
contaminated cultures, black line: separation between pure
and contaminated cultures.
4 DISCUSSION
4.1 Technical Aspects
Figures 5, 6, 8 and 10 show that analysing the
absorption spectra of cells in culture not only allows
monitoring the expansion phase during the fabrication
of ATMPs, but also provides powerful tools to issue an
alert signal about 3 hours after a contamination with
1000 bacteria occurred. These results were obtained
using absorption spectra of various concentrations of
lymphocytes and E. coli.
Bacterial contamination spectra are artificial
spectra made by adding spectra of lymphocytes and E.
coli. This could introduce a bias in the results presented
here. Indeed, adding absorption spectra may lead to an
artificial absorption greater than 100%. However, the
method based on the estimation of the shape of the
absorption spectra will still be valid because only the
shape is considered and not the value of the maximum
absorptions. We recall that the R
2
coefficient is only
used to issue an alert signal. As long as no
contamination is detected, equation depicted in figure
4 remains valid to monitor the expansion phase. This
cell growth monitoring can also be performed
considering conventional turbidimetry as mentioned
above.
Results obtained using Principal Component
Analysis do not suffer from this because it is performed
using normalized spectra. In all cases, a more realistic
study will involve real spectra recorded with actual
mixture of lymphocytes and E. coli.
In this work, we only considered a contamination
due to E. coli. We still need to extend this study to the
BIODEVICES 2020 - 13th International Conference on Biomedical Electronics and Devices
70
case of other bacteria and other containments like
yeasts and fungi. The methods presented here will still
be valid as long as the shapes of the absorption spectra
of contaminants are different enough from the ones of
lymphocytes.
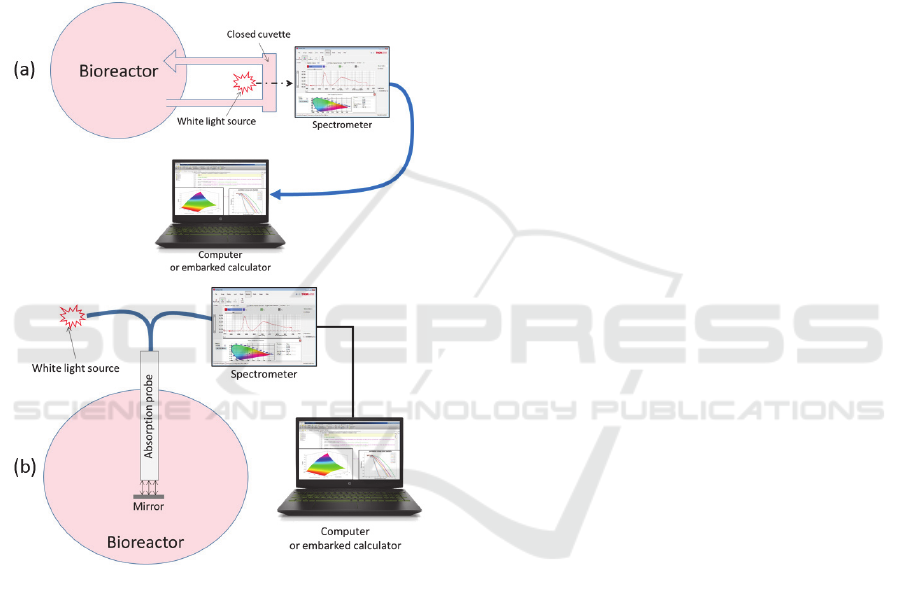
Also, the use of white light spectroscopy through
conventional cuvettes makes possible an easy
adaptation in a closed system configuration using a
derivation from the bioreactor as proposed in figure
11(a). Note that it is also possible to envision the
fabrication of a sterile absorption probe directly
included in the bioreactor as depicted in figure 11(b).
Figure 11: A possible integration of the method in a closed
system environment. (a) Using a derivation. (b) Using a
sterilized reflection probe coupled to a mirror.
4.2 Socio-economic Impacts
As mentioned above, we shortly discuss socio-
economic aspects of this work. We recall that the
duration of the expansion phase is several days. Each
day increases the price of ATMPs and the quality
control imposes regular samples, themselves risk of
contamination. The results presented above are
therefore particularly interesting since they allow
quality control without sampling and make it possible
to stop the expansion phase rapidly (and therefore the
cost associated with inefficient manufacture) about
than 3 hours post contamination if the latter is due to
1000 E. coli.
Designed to treat patients with pathologies that
are currently incurable, ATMPs are likely to create a
real therapeutic revolution in the coming years. It is
currently difficult to estimate the number of
pathologies that these medicines from the living can
address and the number of patients likely to benefit.
At the industrial level, only a few ATMPs are
available on the market and some have had their
marketing authorization cancelled (Glybera,
Sipuleucel-T, ChondoCelect) mainly because of the
enormous cost of their production. As far as we know,
only the following treatments are available (note the
price for a single treatment):
• KYMRIAH ($ 475,000)
• YESCARTA ($ 373,000)
• Strimvelis ($ 594,000)
Included in these costs are losses due to
fabrications, which are found to be contaminated
during the final conformity test, and those due to late-
stage fabrication stops due to the scheduling of
controls at precise dates.
Having a real-time and closed system monitoring
and quality control method is of great interest in terms
of research, industrial manufacturing and more
importantly in terms of benefit to the patients.
5 CONCLUSION
In this paper, we have presented methods to
continuously perform a quality control during the
expansion phase of the fabrication of ATMPs and this
in a closed system environment. These methods are
based on analysing the absorption spectra of what
happens in the bioreactor. Spectral shape analysis is
used to monitor the cells growth and to issue an alert
signal about 4h52 post contamination. Principal
Component Analysis does not allow determining the
lymphocyte concentration but it allows reducing the
time required to issue the alert signal to 3h19
(durations calculated considering that contamination
is due to 1000 E. coli). Advantages of such methods
can be summarized as follows.
It is no longer necessary to sample the content of
the bioreactor for analysis and detection of potential
pathogens. There is no longer risk of product
contamination due to sampling. The idea is no longer
to seek to identify pathogens but just reveal the fact
that the cell culture is not going as planned and stop
production. The use of planned sampling at a fixed
date and time without even knowing whether
Optical Spectroscopy for the Quality Control of ATMP Fabrication: A New Method to Monitor Cell Expansion and to Detect
Contaminations
71

contamination will be detected is avoided. The cell
growth is monitored in real time as long as the culture
is normal. Contamination is detected extremely early.
The production cost can be greatly reduced by
stopping the production as soon as a contamination is
detected.
Indeed, in order to guarantee access to the largest
number of patients, a new conception of the current
mode of production and qualification of the ATMPs
is necessary. Currently, our studies are focussed on
the validation of these above described methods
considering other types of pathogens.
ACKNOWLEDGEMENTS
This work was supported by the MiMedi project
funded by BPI France (grant No. DOS0060162/00)
and the European Union through the European
Regional Development Fund of the Region
Bourgogne-Franche-Comte (grant No. FC0013440).
REFERENCES
Cacopardo, L., et al, 2019. Real-time cellular impedance
monitoring and imaging of biological barriers in a dual-
flow membrane bioreactor, Biosensors and
Bioelectronics Vol. 140, pp. 111340
Chang, K-L., et al, 2006, Series quartz crystal sensor for
remote bacteria population monitoring in raw milk via
the Internet, Biosensors and Bioelectronics Vol. 21, pp.
1581–1590
Fong Lei, K., et al, 2014. Real-time and non-invasive
impedimetric monitoring of cell proliferation and
chemosensitivity in a perfusion 3D cell culture
microfluidic chip, Biosensors and Bioelectronics,
Vol.51, pp.16–21
Hassan, M., et al, 2016. Detecting bacteria contamination
on medical device surfaces using anintegrated fiber-
optic mid-infrared spectroscopy sensing method,
Sensors and Actuators B Vol. 231, pp. 646–654
Ikonen, J., et al, 2017. On-line detection of Escherichia coli
intrusion in a pilot-scale drinking water distribution
system », J. of Environmental Management, Vol. 198,
pp. 384-392
Janné K. et al, 2001. Hierarchical principal component
analysis (PCA) and projectionto latent structure (PLS)
technique on spectroscopic data as adata pretreatment
for calibration, J. Chemometrics, Vol. 15, pp. 203-213
Lee, S-L., et al, 2016. Real-time monitoring of 3D cell
culture using a 3D capacitance biosensor, Biosensors
and Bioelectronics, Vol. 77, pp. 56–61
Liu, Y-J, et al, 2017. Multivariate statistical process control
(MSPC) using Raman spectroscopy for in-line culture
cell monitoring considering time-varying batches
synchronized with correlation optimized warping
(COW), Analytica Chimica Acta Vol. 952, pp. 9-17
Melchor, J., et al, 2018. In-bioreactor ultrasonic monitoring
of 3D culture human engineered cartilage, Sensors and
Actuators B Vol. 266, pp. 841–852
Safavieh, M., et al, 2014. High-throughput real-time
electrochemical monitoring of LAMP for pathogenic
bacteria detection, Biosensors and Bioelectronics, Vol.
58, pp. 101–106
Teixeira, A.P., et al, 2009. Advances in on-line monitoring
and control of mammalian cell cultures: Supporting the
PAT initiative, Biotechnology Advances, Vol. 27, pp.
726–732
Thakur, B. et al, 2018. Rapid detection of single E. coli
bacteria using a graphene-based field-effect transistor
device, Biosensors and Bioelectronics, Vol. 110, pp.
16–22
Wang, X., et al, 2016. Clinical manufacturing of CAR T
cells: foundation of a promising therapy, Molecular
Therapy-Oncolytics, Vol. 3, pp. 16015
BIODEVICES 2020 - 13th International Conference on Biomedical Electronics and Devices
72
