
A Fuzzy Cognitive Map Approach to Investigate the Sustainability of
the Social Security System in Jordan
George Sammour
1a
, Ahmad Alghzawi
2
and Koen Vanhoof
2b
1
Business Technology Department, Princess Sumaya University for Technology, Amman, Jordan
2
Department of Business Informatics, Hasselt University, Hasselt, Belgium
Keywords: Fuzzy Cognitive Maps, Time Series Prediction, Economic Modelling, Social Security System.
Abstract: Fuzzy Cognitive Maps are emerging as an important new tool in economic modelling. The aim of this study
is to investigates the use of fuzzy cognitive maps with their learning algorithms, based on genetic algorithms,
for the purposes of prediction of economic sustainability. A Case study data are extracted from the Jordanian
Social Security system for the last 120 months; The Real-Code genetic algorithm and structure optimization
algorithm were chosen for their ability to select the most significant relationships between the concepts and
to predict future development of the Jordanian social security revenues and expenses. The study shows that
fuzzy cognitive maps models clearly predict the future of a complex financial system with incoming and
outgoing flows. Therefore, this research confirms the benefits of fuzzy cognitive maps applications as a tool
for scholarly researchers, economists and policy makers.
1 INTRODUCTION
The Social Security is a package of social insurances,
where each insurance defines and meets the citizens’
needs in accordance with a legislation outlining the
obligations and rights, and sets up a balance between
them. Accordingly, Social Security is a general
insurance symbiotic system aims to protect people
socially and economically where the law defines its
benefits and funding sources; the government,
through institutions or bodies established under this
system, achieves these benefits in case of any social
risk such as old-age, disability, death, work injuries,
and unemployment. Such benefits are financed by
contributions paid by insured persons and employers.
This system is interested in the achievement of social
competency considerations.
Social security systems all over the world face
financial problems. This phenomenon has a number
of reasons like underfinancing, unclear and too lavish
rules to benefit from them and insufficient control.
Pension systems more specifically also suffer from a
growing number of beneficiaries giving the increased
life expectancy in many countries due to better
medical conditions and improved life styles. As a
a
https://orcid.org/0000-0001-5080-8292
b
https://orcid.org/0000-0001-7084-4223
result, governments struggle with the development of
social security systems, more specifically pension
systems that are sustainable over a longer period.
The construct of an optimal pension system
should be based on data available. However, there
are limited research addressing the issue of
sustainable social security and pension systems. The
data available on any of these social security systems
are vast, relatively complicated and cover many
different variables like age, gender, family
composition, average of salary, years of contribution,
eventual reduction systems and so on. As a result,
scientific analysis of the sustainability of a social
security system, in particular a pension system needs
very specific data analysis methods.
Fuzzy Cognitive Maps (FCMs) have been
developed as a knowledge-based tool to model and
analyze complex systems using causal relations
(Kosko, 1986). From the structural perspective, an
FCM can be defined as a fuzzy digraph that describes
the underlying behavior of an intelligent system in
terms of concepts (objects, states, variables or
entities) and causal relations. Essentially, FCMs are a
kind of recurrent neural networks that support
backward connections that sometimes form cycles in
Sammour, G., Alghzawi, A. and Vanhoof, K.
A Fuzzy Cognitive Map Approach to Investigate the Sustainability of the Social Security System in Jordan.
DOI: 10.5220/0009128304810489
In Proceedings of the 22nd International Conference on Enterprise Information Systems (ICEIS 2020) - Volume 1, pages 481-489
ISBN: 978-989-758-423-7
Copyright
c
2020 by SCITEPRESS – Science and Technology Publications, Lda. All rights reserved
481

the causal graph (Tsadiras, 2008). This implies that
concepts in the information network can be
understood as neural processing entities with
inference capabilities
The objectives of this research is to investigate
the sustainability of the Jordanian Social Security
(JSS) system, as a case study, using FCMs with time
series as a predictive method. This will be achieved
by predicting the revenues and expense using real
time series data extracted from the JSS system.
2 LITERATURE REVIEW AND
RESEARCH MOTIVATION
Among earlier studies on the field of retirement is the
study of Sala and Xavier (1996), the study considered
the theory of social security. The author argued that
programs of social security around the world connect
public pensions to retirement. For example,
individuals do not lose their pensions if they make a
million dollars a year in the stock market, but they do
face marginal tax rates of up to 100 % if they decide
to work. In that context, the study constructed a
positive theory that is compatible to resolve such
issues. Furthermore, the study concluded that when
the difference between the level of skill of the young
and that of the old is big enough, total output in an
economy where the old-aged do not work is higher.
Thomas and Soares (1999), analysed the welfare
implications of the social security system and
compared overall equilibrium measures of welfare to
the commonly used notion of actuarial fairness. The
study revealed that social security has a considerable
impact in the extent of the capital stock and the rate
of return to private saving.
In many cases some retired people have to get
back to the Labour field, that depends on many
reasons among which the work on the informal work,
which does not provide the pension according to the
conditions of work (ILO, 2014). In support of this
issue, the International Labour Organization (ILO)
(2014) published a report “Social protection for older
persons: Key policy trends and statistics”. The report,
included 178 (including Jordan) countries, revealed
that in many countries with high percent of informal
employment, only minority of people can access
pensions, and many older people can count only on
family support. The report also concluded that, nearly
half (48 %) of all people over pensionable age do not
obtain a pension. Many of those who obtains a
pension, the level of income is not adequate. Thus, the
majority of the world's older people have no income
security, have no right to retire and have to work as
long as they are able to and often badly paid and in
insecure conditions.
In the context of Jordan, Alhawarin (2014) studied
the issue of getting back to the Labour field. The
author collected data from about 5000 households
containing about 6000 individuals. The study
revealed that nearly 85% of male retirees had retired
early, and about 45% of them got back to the labour
market and took jobs, which were characterized, to
some extent by informality. Economically active
early retired persons; however, seem to suffer from
high unemployment rates, particularly those who
retire from the private sector. The results of analysis
showed that individuals retired from the Jordanian
armed forces were more probably to retire early and
to get back to labor market. Whereas the household
wealth appears to affect the probability of early
retirement, family size has a positive effect.
Mohammed and Najim (2014) conducted a study
aimed at identifying the influence of the services
provided by the Public Institutions for JSS at the level
of satisfaction on the work of the institution in the city
of Amman. The study found that the level of services
of public institutions and the level of satisfaction for
Social Security. The outcomes also found a
statistically significant effect of the services on the
level of satisfaction with the work of the institution.
In their study, Enoff and McKinnon (2011) aimed to
promote sharing of knowledge and good practice on
contribution collection and the compulsion of
compliance. The data proposes that seven core factors
unite often to form the basis of success in contribution
collection and consent. Additionally the improvement
of benefit adequacy and public standing of programs
and the financial health, such success may support
both national and international efforts to expand
social protection coverage.
Early retirement is an important factor that affects
the sustainability of social security systems. Fenge
and Pestieau (2005) investigated theoretical and
empirical evidence, which explains why early
retirement became such a burden for systems of social
security and suggested pension system reforms,
which will reverse the trend. The study used evidence
from the European Union (compared with other
industrialized countries including Canada and the
United States). The study showed that the effective
retirement age is impacted by social security
regulations (as a change in eligibility age) and
discussed ways of measuring those embedded
stimulus. Furthermore, pushing older workers to
retire does not free jobs for young unemployed
individuals. Finally, the study concluded that the gap
ICEIS 2020 - 22nd International Conference on Enterprise Information Systems
482

between productivity and salaries is a stimulus for
employers to release themselves from older workers
and claim that governments must not support this
behavior by recompensing the elderly workers for the
difference between salaries and severance payments
in early retirement programs.
In their study, Imrohoroğlu and Kitao (2012),
aimed to assess the efficacy of proposed Social
Security reforms and its influence on sustainability of
the US pension system. It was revealed that Social
Security reform to raise retirement ages could have a
large impact on the sustainability of the US pension
system through changes in life-cycle savings and
labor supply. In particular, labor force participation of
older workers and their benefit take-up behavior react
strongly to certain reforms. The study revealed that an
increase in the earliest retirement age would not have
any significant effect on the budget of the Social
Security system since the benefits will be
permanently raised by forcing individuals to postpone
retirement. The study suggested that policies that
encourage the participation and work effort of older
workers as well as individuals' own saving for
retirement could help enhance the sustainability of the
system.
A study conducted on Middle East and North
African (MENA) countries addressed the question of
removing deficits about equity, efficiency, and
financial sustainability and how the prospects are for
more profound reforms in the future. The study
revealed that the countries of MENA have hardly
conducted any noteworthy pension reforms in the
past and claim that this reluctance is because of
political considerations of the ruling regimes and to
the fact that most countries of MENA until now were
able to finance the deficits of their pension schemes
(Loewe, 2014). It was concluded, “The prospects of
reforms that go beyond simple changes in
contribution rates or pension formulas remain
bleak.”
Based on the above discussions, it is important
to note that most of the research conducted to
investigate the sustainability of social security
systems are based on questionnaires and statistically
analyze the collected data. Few researches used real
time series data to address the concern specifically
FCMs. The main advantage in the analysis of the use
of FCM’s is they incorporate learning algorithms,
which time series do not.
In recent years, the use of FCMs in time series
forecasting has been noticeable due to the
transparency of FCM-based models. For example,
the approaches proposed in Pedrycz (2010), Pedrycz
et al. (2016), Lu et al. (2014), and Froelich and
Pedrycz (2017) rely on fuzzy information granules to
forecast the time series with high accuracy. The
values of the learning part of the time series are
clustered, where the number of clusters is a user-
defined parameter, using the fuzzy 𝑐-means
algorithm (Bezdek et al., 1984). At each time
iteration, the value of the time series fits to each
cluster with some membership degree with
presumption that every cluster (i.e., concept) plays
the role of a fuzzy set. On the other hand, other
algorithms proposed a low-level approach where
neurons represent attributes instead of comprising
information granules (Froelich and Salmeron, 2014;
Poczęta and Yastrebov, 2015; Papageorgiou, et al.,
2015; Salmeron and Froelich, 2016). Nevertheless,
these methods suffer from the same drawback that is;
there is no guarantee that the produced weight set
encompasses a realistic interpretation for the system.
Even though the model is able to achieve good
prediction rates. Consequently, this implies that the
modelled system cannot be interpreted, although the
FCM reasoning is still transparent.
In this paper, we investigate this complex issue
using a real case study data extracted from the
Jordanian Social Security System (JSS). More
precisely, the contribution of this research is twofold.
On the one hand, a FCM-based system is developed
to forecast the social security revenues and expenses
in Jordan. This will allow experts to forecast the
revenues in next years and understand the underlying
behaviour behind such predictions. On the other hand,
to investigate the trade-off between interpretability
and accuracy of FCMs, as we include expert
knowledge to the system. To achieve this first, an
initial FCM will be developed without any
restrictions, and second, a FCM model will be
developed using knowledge coming from experts.
3 FUZZY COGNITIVE MAPS
Cognitive mapping has become a convenient
knowledge-based tool for modelling and simulation
(Kosko, 1986). FCMs can be thought of as recurrent
neural networks with learning capabilities, consisting
of concepts and weighted relations among them.
Concepts denote entities or variables, which are
equivalent to neurons in neural network models.
While weights associated to connections denote the
causality among such nodes or concepts. Each link
takes values in the range [−1, 1], denoting the
causality degree between two concepts because of
the quantification of a fuzzy linguistic variable,
which is often assigned by experts during the
A Fuzzy Cognitive Map Approach to Investigate the Sustainability of the Social Security System in Jordan
483

modeling phase (Nápoles, et al., 2016). The
activation value of neurons is also fuzzy in nature and
regularly takes values in the range [0, 1]. The higher
the activation value of a neuron, the stronger its
influence over the investigated system, offering
decision-makers an overall picture of the systems
behaviour.
Mathematically FCMs are used to demonstrate
and to model the knowledge on the examining system
in terms of concepts. It can be defined by using a 4-
tuple (𝐶, 𝑊, 𝐴, 𝑓) where 𝐶 = {𝐶1, 𝐶2, … , 𝐶𝑀}
denotes a set of 𝑀 neural processing entities, 𝑊: (𝐶𝑖,
𝐶𝑗) → 𝑤𝑖𝑗 is a function that associates a causal weight
𝑤𝑖𝑗 ∈ [−1,1] to each pair of neurons (𝐶𝑖, 𝐶𝑙).
Similarly, 𝐴: (𝐶𝑖) → 𝐴𝑖 is a function that associates
the activation degree 𝐴𝑖 ∈ ℝ to the 𝐶𝑖 neuron at each
iteration-step moment 𝑡 (𝑡 = 1,2, … , 𝑇). Finally, a
transformation function 𝑓: ℝ → [0,1] is used to keep
the neurons’ activation value in the allowed interval.
Equation (1) portrays the inference mechanism
attached to an FCM-based system, using the (0)
vector as the initial activation. This neural procedure
is repeated until either a fixed-point attractor is
discovered or a maximal number of iterations is
reached.
𝑨
𝒊
𝒕𝟏
𝒇𝒘
𝒋𝒊
𝑨
𝒋
𝒕
𝑴
𝒋
𝟏
𝒘
𝒊𝒊𝑨
𝒊
𝒕
,𝒊𝒋
(1)
The three most widely used threshold functions
are the bivalent function, the trivalent function, and
the sigmoid variants. Bivalent or trivalent are discrete
FCMs, which cannot properly represent the degree of
an increase or a decrease of a concept. Nevertheless,
since discrete FCM are deterministic models they can
always converge to a fixed-point attractor or limit
cycle. Thus, the number of distinct states is finite.
Continuous FCM (e.g. sigmoid FCM) on the other
hand are able to simulate numerical changes of the
activation value of concepts. They are consequently
recommended for both qualitative and quantitative
scenarios, as their prediction capability is much
higher than discrete FCM (Nápoles, et. al, 2016). The
increase of the numerical precision of predictions
however may also lead to fully chaotic behavior
offering no guarantee of convergence. Furthermore,
as reported by Bueno and Salmeron (2009), the
results revealed that the sigmoid function
outperformed other functions using the same decision
model. Consequently, the threshold function is a
crucial issue for the system behaviour and
performance. Therefore, in this research we will focus
on Sigmoid FCMs.
FCMs can be constructed either using the
knowledge coming from domain experts or using a
learning method. In the next sub-section, an
evolutionary procedure to derive the network
structure in a supervised fashion is described.
3.1 Fuzzy Cognitive Maps Learning
The literature indicates that, when forecasting using
time series, the use of the appropriate regression is of
the highest importance. Likewise, the use of the right
concepts in the FCM will influence the forecasting
accuracy of the models (Salmeron and Froelich,
2016). This signifies that the weight matrix
constructed in the FCM will be of the highest
importance when obtaining forecasting accuracy. The
learning process of the FCM itself or the opinion of
experts will be the most important factor in this
regard, resulting in an optimal weight matrix. The
reason is that FCMs derive their strength from their
simplicity. Thus, an expert opinion has to be present
to predict accurately.
Assume that Z(t) = [Z
1
(t), Z
2
(t), …, Z
N
(t)] is the
desired system response for the (𝑡−1) activation
vector, A(t) = [A
1
(t), A
2
(t), …, A
N
(t)] is the FCM
output for the (𝑡−1) initial vector, while 𝑇 is the
number of the learning records. Equation (2) displays
an error function used in the context of time series
forecasting, where 𝑊 represents the candidate
weight matrix, N is the number of neurons, while 𝑡
indexes the iteration steps (i.e., the learning records).
In short, this learning scheme attempt minimizing the
dissimilarity between the expected outputs and the
predicted ones.
𝐸𝑊
1
𝑇1
𝑛
𝑍
𝑡
𝑋
𝑡
(2)
In this supervised learning model, a continuous
search method (i.e., Particle Swarm Optimization,
Genetic Algorithms) generates the weights matrices
to be evaluated by the algorithm. Equation (3) shows
the structure of the weight set.
𝑊
𝑊
,
,…,𝑊
,
,𝑊
,
,…,𝑊
,
,…,𝑊
,
(3)
In this research, we adopt the Real-Coded
Genetic Algorithm (RCGA) as standard continuous
optimizer. The RCGA is an evolutionary search
method that codifies genes directly as real numbers
and can be used to optimize parametrical problems
for continuous variables (Herrera et. al, 1998).
Therefore, each chromosome involves a vector of
ICEIS 2020 - 22nd International Conference on Enterprise Information Systems
484

floating point numbers that involves a candidate
solution. The size of the chromosomes is identical to
the length of the vector, which is the solution to the
optimization problem. In this way, each gene
represents a variable of the problem, i.e. a weight
component. Genetic operators only have to observe
the fact that the values of the genes remain within the
interval established by the variables they represent.
Each chromosome in the population is evaluated
based on a fitness function according to the error
function. Because Genetic Algorithms are frequently
expressed like maximization-type problems, the
previous error function is expressed in terms of a
fitness function, which is formalizes as follows:
𝐹𝑊
1
𝑎∗𝐸𝑊1
(4)
Where 𝛼 > 0 is a user-specified parameter, 𝑊 is
the candidate weight set computed by the RCGA
optimizer, while (𝑊) is the error function. During the
optimization, parents are selected and new
population of chromosomes are generated with some
probability. In this research, we use the well-known
roulette wheel method as standard selection operator.
4 SUSTAINABILITY OF SOCIAL
SECURITY SYSTEM IN
JORDAN
The aim of this research is focused on predicting the
revenue and expense values and understanding the
underlying interrelation between concepts; the latter
is the main motivation to use cognitive mapping
models. To achieve that, we introduce a case study
case of forecasting social security revenues and
expenses in Jordan. The dataset used for analysis are
extracted from the JSS system, related to revenues
and expense in Jordan for the period of 120 months
(from 2006 until 2015). Each data set contains a set
of variable that contribute to the overall value (i.e.
revenues or expenses). The data set variables (map
concepts) for both revenues and expenses are listed in
Table 1.
Table 1: Revenues and Expenses Datasets.
Dataset Variables
Revenues
C1: Aging subscription
C2: Work related injuries
C3: Maternity insurance
C4: Years earlier service
C5: Optional Subscriptions
C6: Miscellaneous revenue
C7:Stamps
Expenses
C1: Pensions
C2: One time
C3: Work injuries
C4: Maternity insurance
Table 2 reports descriptive statistics about the
aggregated revenues and expenses and Figure 1
below depicts the trend of the aggregated revenues
and expenses. Over the past 120 months, the revenues
were higher than expenses, which implies that the JSS
is financially sustainable. Furthermore, the gap
between the trend lines of the revenues and expenses
has increased in recent months.
Figure 1: Observed revenues and expenses time series trend lines.
0
20000000
40000000
60000000
80000000
100000000
120000000
140000000
May‐05 Oct‐06 Feb‐08 Jul‐09 Nov‐10 Apr‐12 Aug‐13 Dec‐14 May‐16 Sep‐17
Jordanian Dinar (JOD)
month
RevenuesandExpensesTimeSeries
Revenues Expenses
A Fuzzy Cognitive Map Approach to Investigate the Sustainability of the Social Security System in Jordan
485

Table 2: Revenues and expenses descriptive statistics.
Variable Revenues Expenses
Observations 120 120
missing data 0 0
Minimum 23579730 16040461
Maximum 127734545 71242897
Mean 62829093 39864540
Std. deviation 23903670 14576539
In order to activate the neurons with values inside
the activation interval the data were normalized to the
[0,1] range using the min-max normalization method.
Furthermore, the datasets were randomly divided into
two disjoint subsets: the learning set (95%) and the
test set (5%). Aiming at evaluating the quality of the
FCM-base forecasting model, we adopt the Mean
squared Error (MSE).
Due to the stochastic nature of the heuristic
search methods, we perform 20 trials and average the
quality measures. Moreover, we use the following
parametric setting in all the simulations: 50
chromosomes as in the artificial population, 200
generations, the 𝛼 parameter is set to 10, the
crossover probability is set to 0.8, and the mutation
probability is set to 0.1, while the 𝐹𝑚𝑎𝑥 parameter is
set to 0.999. In addition, the models will be
experimented using two different configurations. In
the first one, genes can take values in the [-1, 1]
range, and this will be referred to as the unrestricted
model. Whereas, in the second configuration we
include expert knowledge related to the sign of
causal weights which be referred to as the restricted
model. For example, considering the revenues, the
longer an individual is subscribed with age (C1:
Aging subscription) the value of the optional
subscription (C5: Optional Subscriptions) will be
increased, which implies a positive casualty between
these two concepts. On the other hand, it is obvious
that the fewer the years an individual is subscribed
the lower
his optional subscription (i.e. there is a negative
casualty relation between C4: year’s early service
and C5: Optional subscription.
It is important to note that the goal is not to
increase performance but to preserve the coherence in
the causal cognitive network. Weights are freely
estimated in the [-1, 1] range which may actually
produce improved prediction rates due to the attached
freedom degree. However, there is no way to ensure
that weights produced by a heuristic search method
contains a causal meaning for the problem under
investigation. In the next sub-section, the results of
the FCM analysis for both configurations are
presented.
4.1 Analysis of the Results
Table 3 depicts the MSE error rates for the revenues
and expenses models. The average MSE of the test
set of the revenues model for the unrestricted model
are 0.0431, while for the restricted model, the
reported MSE is 0.1992. As for the expenses model,
the unrestricted model reported lower MSE measure
as well. As a result, one can note that promoting the
FCM interpretability leads to higher forecasting
errors. Thus, the question that arises here is that why
when attempting to promote the interpretability of
the FCMs leads to higher forecasting error, since in
principle, a neuron naturally produces a times series?
Table 3: Error rates of the revenues and expenses models
(restricted and unrestricted models).
Dataset
Configuration (Model
type)
MSE
Revenues
Unrestricted Model 0.0431
Restricted Model 0.1992
Expenses
Unrestricted Model 0.026
Restricted Model 0.064
To answer this question, we must take note of the
convergence properties of the causal network. In
most FCM-based systems, ensuring convergence is
mandatory, otherwise making reliable decisions is
not possible (Nápoles et. al, 2016;
Homenda et. al,
2014). Nevertheless, in the time series context,
convergence is not desirable since it decreases the
network’s capability of computing both short and
long-term predictions. Consequently, producing
truly interpretable casual cognitive models may be
produced on the expense of performance. This is the
price we pay to produce truly interpretable causal
cognitive models. Nevertheless, whether such
forecasted values are acceptable for this real-world
problem is questionable.
Figures 2 and 3 shows the actual and fitted values
for the unrestricted and restricted models of revenues
and expenses respectively. The horizontal axis
represents time steps, while the vertical axis shows
the activation values. The results depicted in the
figures confirms our hypothesis, the convergence
properties of the FCM-based system affect the
ICEIS 2020 - 22nd International Conference on Enterprise Information Systems
486
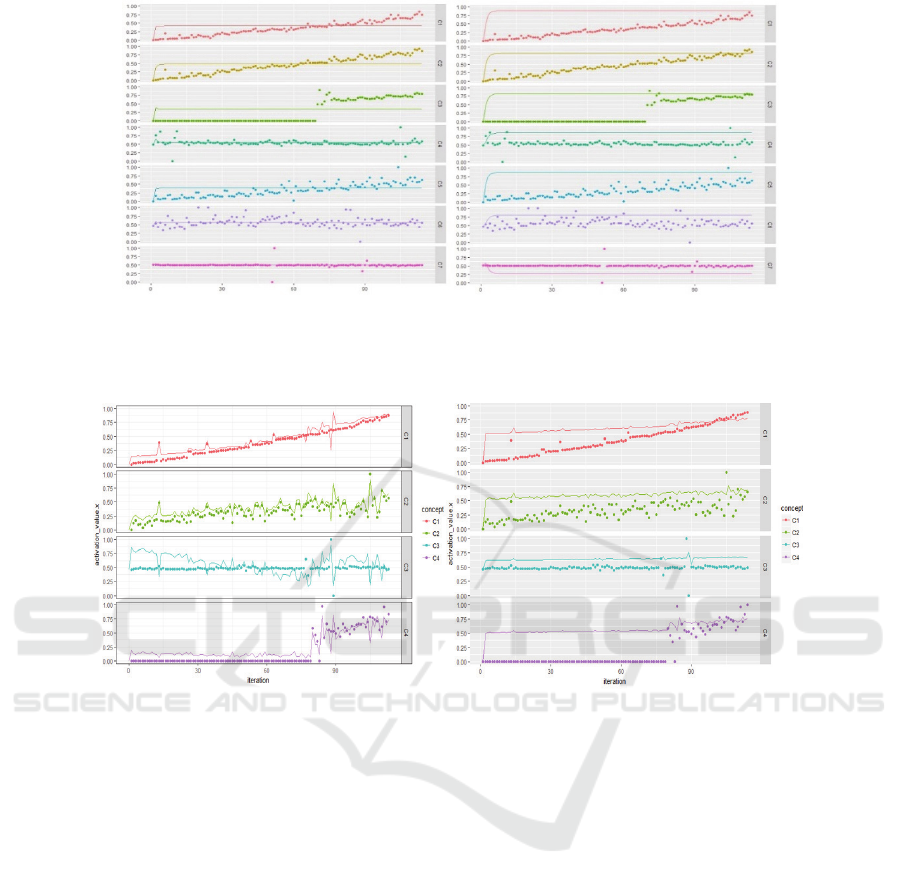
Figure 2: Actual versus forecasted revenues values using the using the current activation values to predict the next time series
point.
Figure 3: Actual versus forecasted expense values using the using the current activation values to predict the next time series
point.
quality of forecasted values for both revenues and
expenses. Forecasting error increases because of
decreasing the degree of freedom. This can be shown
in the forecasted values line trend for both models
(revenues and expenses) noticeably deviates from the
actual values.
At the aggregated level of revenues and
expenses, Figure 4 shows the actual and forecasted
models (C1 represents revenues and C2 represents
expenses). The trend lines for the forecasted
revenues and expenses (straight line) follows the
same trend in the actual values. Furthermore, the
revenues are higher than expenses with the gap
between them increases with time. Thus, the JSS is
financially sustainable.
5 CONCLUSIONS
In this paper, we proposed an FCM-based time
series-forecasting model to investigate the factors
affecting revenues and expenses of the social
security in Jordan. The proposed model uses a
RealCode Genetic Algorithm to learn the map
structure together with well-known methods for
FCM learning. As a first step, we allowed the
algorithm to indicate a relationship value between
the neurons to fluctuate between -1 and 1 without
constraints, which was referred to the unrestricted
model. However, the model occasionally computed a
positive relation where it should be a negative one
and vice versa, therefore producing a forecasting
model that does not have a coherent meaning for this
real-world problem.
(a) Unrestricted model (b) Restricted model
(a) Unrestricted model (b) Restricted model
A Fuzzy Cognitive Map Approach to Investigate the Sustainability of the Social Security System in Jordan
487

In order to produce meaningful weights, we
included domain knowledge related to the sign of
each causal relation. The numerical simulations have
shown that using the current value to forecast the
revenue values leads to higher error rates since the
model converges to an equilibrium attractor.
Furthermore, when using FCMs, it is key to
promote the network’s transparency, otherwise the
model will behave like a black box and as a result,
there is no reason to employ other (perhaps more
accurate) forecasting models. In the context of the
Jordanian Social Security financial sustainability, the
resulting models predicted that with time, the
revenues would still be higher than expenses. Future
research will be focused on increasing the
forecasting accuracy rates while retaining the
network capability.
Figure 4: Actual and forecasted revenues and expenses.
REFERENCES
Alhawarin, I., 2014. Patterns and Determinants of Early
Retirement: The Case of Jordanian Men. Jordan.
Journal of Economic Sciences, Vol. 1(1).
Bezdek, J. C., Ehrlich, R., Full, W., 1984. FCM: The fuzzy
c-means clustering algorithm. Computers &
Geosciences. 10, pp. 191-203.
Bueno, S., Salmeron, J. L., 2009. Benchmarking main
activation functions in fuzzy cognitive maps. Expert
Systems with Applications. Vol. 36, pp. 5221-5229.
Enoff, L. and R. McKinnon, 2011. Social Security
Contribution Collection and Compliance: Improving
Governance to Extend Social Protection. International
Social Security Review Vol. 64 (4) pp. 99-119.
Froelich, W., Pedrycz, W., 2017. Fuzzy cognitive maps in
the modeling of granular time series. Knowledge-Based
Systems, Vol. 115, pp. 110-122.
Froelich, W., Salmeron, J. L., 2014. Evolutionary learning
of fuzzy grey cognitive maps for the forecasting of
multivariate, interval-valued time series. International
Journal of Approximate Reasoning. Vol. 55, pp. 1319-
1335.
Herrera, F., Lozano, M., Verdegay, J.L., 1998. Tackling
real-coded genetic algorithms: operators and tools for
behavioral analysis. Artificial Intelligence Review. Vol.
12, pp. 265-319.
Homenda, W., Jastrzebska, A., Pedrycz, W., 2014.
Modeling time series with fuzzy cognitive maps. In:
FUZZ-IEEE 2014, Beijing, China, pp. 2055-2062.
(ILO), S.P.D.o.I.L.O, 2014. Social protection for older
persons: Key policy trends and statistics.
Mohammed T. Mubaideen and Najim A. Najim (2014). The
Effect of Jordanian Social Security Corporation
Services on The Level of Satisfaction on Performance
At The Corporation In Amman / Jordan. Dirasat, Vol.
41 (2), pp. 155-169.
Imrohoroğlu, S. and S. Kitao, 2012. Social Security
Reforms: Benefit Claiming, Labor Force Participation,
and Long-Run Sustainability. American Economic
Journal: Macroeconomics, Vol. 4 (3): pp. 96-127.
Kosko, B., 1986. Fuzzy Cognitive Maps. International
Journal of Man-Machine Studies, Volume 24 (1), pp.
65-75.
Tsadiras, A.K., 2008. Comparing the inference capabilities
of binary, trivalent and sigmoid fuzzy cognitive maps.
Information Sciences, Vol. 178 (20), pp. 3880-3894.
Loewe, M., 2014. Pension Schemes and Pension Reforms
in the Middle East and North Africa, in Reforming
Pensions in Developing and Transition Countries,
Palgrave Macmillan UK: London. pp. 69-100.
Lu, W., Yanga, J., Liua, X., Pedrycz, W., 2014. The
modeling and prediction of time series based on
synergy of high-order fuzzy cognitive map and fuzzy c-
means clustering. Knowledge-Based Systems, Vol. 70,
pp. 242-255.
Nápoles, G., Papageorgiou, E.I, Bello, R, Vanhoof, K.,
2016. On the convergence of sigmoid Fuzzy Cognitive
Maps. Information Sciences. Vol. 349 (C), pp. 154-171.
Papageorgiou, E.I., Poczęta, K., Yastrebov, A., Laspidou,
C., 2015. Fuzzy cognitive maps and multi-step gradient
methods for prediction: applications to electricity
consumption and stock exchange returns.
Intelligent
Decision Technologies, Springer, pp. 501-511.
Pedrycz, W. (2010). The design of cognitive maps: A study
in synergy of granular computing and evolutionary
optimization. Expert Systems with Applications. Vol.
37, pp. 7288-7294.
Pedrycz, W., Jastrzebska, A., Homenda, W. (2016). Design
of fuzzy cognitive maps for modeling time series. IEEE
Transactions on Fuzzy Systems, Vol. 24, pp. 120-130.
Poczęta, K., Yastrebov, A., 2015. Monitoring and
prediction of time series based on fuzzy cognitive maps
with multi-step gradient methods. International
Conference on Automation (ICA 2015), Progress in
Automation, Robotics and Measuring Techniques,
Springer, pp. 197-206.
Robert Fenge and Pierre Pestieau, 2005. Social Security and
Early Retirement. MIT Press Books. The MIT Press,
1(1). ISBN: 9780262062497.
ICEIS 2020 - 22nd International Conference on Enterprise Information Systems
488

Sala-I-Martin, Xavier X., 1996. A positive theory of social
security. Journal of Economic Growth, Vol. 1 (2), pp.
277-304.
Salmeron, J.L., Froelich, W., 2016. Dynamic optimization
of fuzzy cognitive maps for time series forecasting.
Knowledge-Based Systems, Vol. 105, pp. 29-37.
Thomas F. Cooley and Jorge Soares, 1999. A Positive
Theory of Social Security Based on Reputation.
Journal of Political Economy, Vol. 107 (1), pp. 135-
160.
Tsadiras, A.K., 2008. Comparing the inference capabilities
of binary, trivalent and sigmoid fuzzy cognitive maps.
Information Sciences, Vol.178 (20), pp. 3880-3894.
A Fuzzy Cognitive Map Approach to Investigate the Sustainability of the Social Security System in Jordan
489
