
Multi-state Models for the Analysis of Survival Studies in Biomedical
Research: An Alternative to Composite Endpoints
Alicia Quir
´
os
1 a
, Armando P
´
erez de Prado
2 b
, Natalia Montoya
1
and Jos
´
e M. De la Torre Hern
´
andez
3 c
1
Departmento de Matem
´
aticas, Universidad de Le
´
on, Campus de Vegazana, Le
´
on, Spain
2
Unidad de Cardiolog
´
ıa Intervencionista, Complejo Asistencial Universitario de Le
´
on, Le
´
on, Spain
3
Unidad de Cardiolog
´
ıa Intervencionista, Hospital Universitario Marqu
´
es de Valdecilla, Santander, Spain
Keywords:
Adverse Events, Competing Risks, Composite Endpoints, Disability Model, Interventional Cardiology,
Multi-state Model, Survival Studies.
Abstract:
Primary endpoints of survival studies in biomedical research are usually composite endpoints, which indicate
whether any of a list of events is observed. They are practical to empower studies and in the presence of
competing risks, although constrained. In this work, we propose a more sophisticated modelization of the evo-
lution of the disease for a patient with multi-state models, which allow to define relationships between adverse
events by a state structure. Each transition between states may depend on different covariates, which pro-
vides a personalized prediction for patients, considering their characteristics, treatment and observed disease
evolution. In order to illustrate their performance, we analyze a study in interventional cardiology including
1008 patients with acute coronary syndrome who underwent percutaneous revascularization between 2013 and
2019. The results show the great potential of multi-states models for analyzing survival studies in biomedical
research.
1 INTRODUCTION
In biomedical research, prognostic studies are usually
conducted, in which patients are followed up for sev-
eral months after undergoing an intervention or being
prescribed a treatment. The objective of these studies
is either to evaluate the performance of the treatment /
intervention or to discover risks factors that influence
the patient’s outcome. A typical primary objective for
these studies is a composite endpoint, i.e. a variable
that indicates whether any of a list of events is ob-
served or not. The corresponding time is usually the
time of the first observed event, for those patients pre-
senting one or more events, and the maximum time
for the rest of patients. The scheme of a composite
endpoint setting is depicted in Figure 1 (a).
Composite endpoints are mostly used for analyz-
ing survival studies in which events are rare, in order
to empower the studies (Irony, 2017; McCoy, 2018;
Ferreira-Gonzalez et al., 2008). This kind of vari-
a
https://orcid.org/0000-0001-5259-4793
b
https://orcid.org/0000-0003-3283-0597
c
https://orcid.org/0000-0003-4570-8902
ables also serve to avoid the assessment of the ef-
fect in presence of competing risks (McCoy, 2018;
Ferreira-Gonzalez et al., 2008).
Of course, this is a simple model which allows
for a easy implementation, commonly analyzed with
a Cox regression model and described by a Kaplan-
Meier curve. This composite endpoint framework al-
lows the researchers to answer questions like: Are pa-
tients with certain risk factors more likely to show ad-
verse events than patients without them? What is the
expected time to an adverse event of low risk patients?
The use of composite endpoints presents several
limitations. On one hand, interpretation of compos-
ite endpoints is a challenge (McCoy, 2018), specially
when the events included in the composite endpoint
show different clinical relevance or when the compo-
nents occur with heterogeneous frequency (Ferreira-
Gonzalez et al., 2008). On the other hand, according
to (Kip et al., 2008), the definition of a composite end-
point can vary between studies, making the research
results comparison difficult.
In order to overcome these drawbacks, additional
individual analyses of the events are usually recom-
mended under a competing risks framework (N
´
u
˜
nez
194
Quirós, A., Pérez de Prado, A., Montoya, N. and Hernández, J.
Multi-state Models for the Analysis of Survival Studies in Biomedical Research: An Alternative to Composite Endpoints.
DOI: 10.5220/0009105701940199
In Proceedings of the 13th International Joint Conference on Biomedical Engineering Systems and Technologies (BIOSTEC 2020) - Volume 3: BIOINFORMATICS, pages 194-199
ISBN: 978-989-758-398-8; ISSN: 2184-4305
Copyright
c
2022 by SCITEPRESS – Science and Technology Publications, Lda. All rights reserved
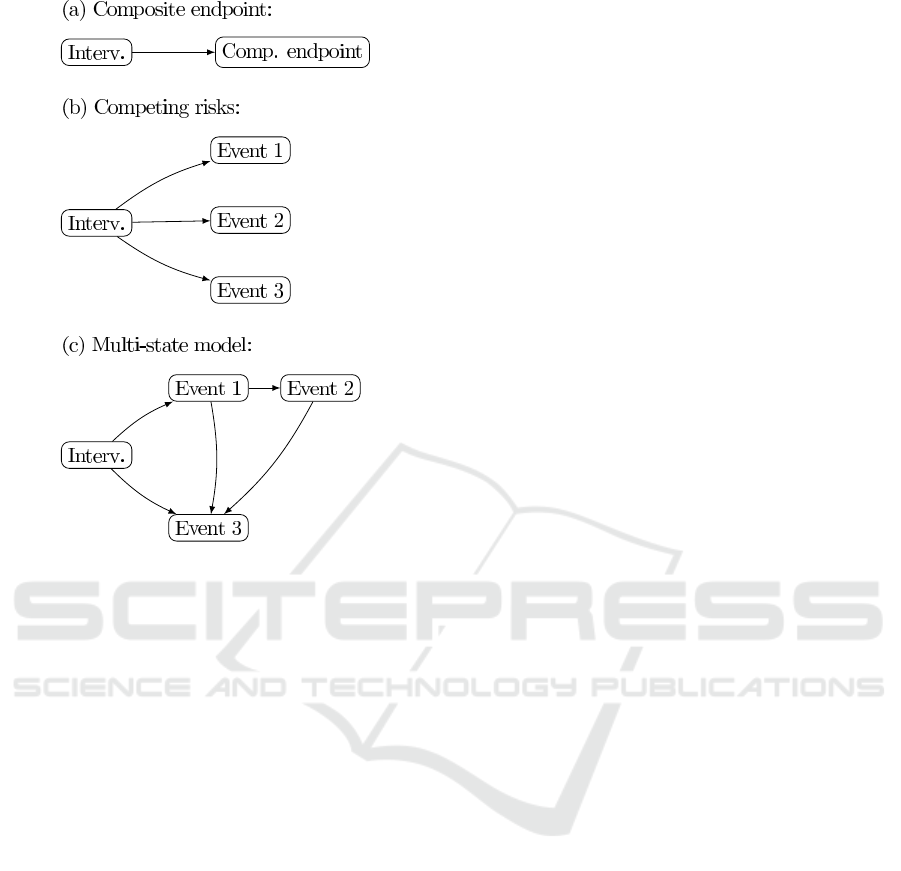
Figure 1: (a) Composite endpoint scheme. Composite end-
point includes events 1, 2 and 3; (b) Competing risks sce-
nario; (c) Multi-state model, with more structure.
et al., 2011; Austin et al., 2016). Formally, this de-
scribes an scenario as the one represented in diagram
(b) of Figure 1. This implies missing the occurrence
of events after the first, for those patients who suffered
more than one event during the follow up.
With the advent of new technologies and of mul-
tidisciplinary groups, databases are larger and re-
searchers are now in the position of stating more com-
plex models that adapt better to the real evolution of
the disease. For instance, it is reasonable to consider
a model as the one described in diagram (c) of Figure
1. In this setting, more structure is given to the model,
for example, including the information that Event 2 is
preceded by Event 1. Fitting this model, researchers
will be able to answer questions like: Are high risk
patients more likely of suffer Event 3 after showing
an Event 1 post-treatment? What is the estimated so-
journ time after the occurrence of Event 2?
A multi-state model is the natural approach in
this setting, as it allows to consider survival models
with a complex structure of the states which patients
may visit along the follow up. Multi-state models
are closely connected with survival analysis, as tran-
sition intensities between states correspond to hazard
rate functions for times between transitions in survival
analysis (Meira-Machado et al., 2009). Furthermore,
multi-state models provide information about the ex-
pected time and the probability of moving from one
state to another, depending on certain risks factors or
treatment characteristics. Formally, multi-state mod-
els are a class of stochastic processes which model the
probability of visiting a certain set of discrete states in
continuous time (Andersen et al., 1993; Putter et al.,
2007).
This kind of models take into account all available
follow up data, i.e. all the events observed for each
patient. Additionally, multi-state models are able to
accommodate different sets of factors affecting each
transition, allowing personalized estimations. There-
fore, a prediction for a patient can be made consid-
ering his or her basal characteristics, treatment and
observed disease evolution.
In this work, we propose to examine survival
times and time to the ocurrence of adverse events in
conjunction with risks factors using multi-state mod-
els in survival study in biomedical research, as an al-
ternative to composite endpoints. For this purpose,
we analyze data from a longitudinal study in Cardio-
vascular research and compare the results obtained by
considering a composite endpoint scheme, a compet-
ing risks scenario, and a multi-state model.
2 MATERIALS AND METHODS
2.1 Data
We illustrate the implementation of multi-state mod-
els in survival studies in biomedical research, with
the data of a study in interventional cardiology. The
SYNERGY ACS registry (De la Torre Hernandez
et al., 2018) was a multi-center retrospective registry
carried out in 10 Spanish hospitals, including 1008
patients with acute coronary syndrome (ACS) who
underwent percutaneous revascularization with the
implantation of a SYNERGY stent and whose date
of procedure was between January 2013 and March
2019. After the treatment, several adverse events and
the corresponding times were recorded during the fol-
low up, including death, myocardial infarction (MI),
target lesion revascularization (TLR), stent thrombo-
sis, etc. For further information on the dataset see (De
la Torre Hernandez et al., 2018).
Time on study is assumed as the maximum time
and the date of intervention is fixed as the start-
ing time for each patient. We have initially consid-
ered 15 prognostic factors or covariates: age, sex,
smoker, hypertension, diabetes, hyperlipidemia, prior
MI, prior PCI, peripheral vascular disease, type of
ACS, left ventricular ejection fraction (LVEF), dual
Multi-state Models for the Analysis of Survival Studies in Biomedical Research: An Alternative to Composite Endpoints
195

anti-platelet therapy (DAPT) period in months, num-
ber of diseased vessels, incomplete revascularization,
and stent thrombosis.
2.2 The Models
2.2.1 Composite Endpoint Scheme
We define a variable of Major Adverse Cardiac Events
(MACE) indicating whether a patient has suffered a
MI of has died during the follow up. MACE is there-
fore a composite endpoint.
As commonly done in cardiovascular research, a
Kaplan-Meier curve is used in order to describe data
and MACE is analyzed by a Cox multiple regression
model, selecting the variables according to Akaike’s
Information Criterion and clinical considerations.
2.2.2 Competing Risks Scenario
As can be observed in Figure 1, the competing risks
scenario is a particular example of multi-state model.
Here, the competing risks scenario is included as a
part of the multi-state model, as will be described be-
low.
2.2.3 The Disability Model
As commented above, multi-state models are very
useful for describing event-history data, providing a
better understanding of the disease process, and lead-
ing to a better knowledge of the evolution of the dis-
ease over time. Multi-state models are flexible, allow-
ing for different structures to accommodate the rela-
tionship between the states of the processes. In this
particular example, we propose a multi-state model
known as the disability model, which is relevant in ir-
reversible diseases where the occurrence of a specific
adverse event increases the risk of death. The scheme
of the disability model used is depicted in Figure 2.
Figure 2: The disability model.
Formally, let Z(t) be the stochastic process de-
scribing the state of a ACS patient at time t, where t is
time since intervention. All living patients that have
not yet experienced a MI post-treatment are consid-
ered to be in state 1, patients move to state 2 when
they suffer a MI after treatment, and state 3 stands
for the death of the patient. The state space is thus
{1, 2,3} and state 3 is the absorbing state, meanwhile
states 1 and 2 are said to be transient. Transition prob-
abilities between states depend on a set of covariates,
x
i
, and can be determined from the hazard rate func-
tions for times between transitions. Let q
rs
(t, x
i
) be
the instantaneous risk of moving from state r to s 6= r,
i.e.
q
rs
(t, x
i
) = lim
δt→0
P(Z(t + δt) = s|Z(t) = r)
δt
, (1)
then
q
rs
(t, x
i
) = q
(0)
rs
exp(β
rs
z
i
). (2)
Following this, times between transitions are assumed
to be exponential and a different model is fitted to
each transition, in which the covariates are used to ex-
plain differences in the course of the disease among
the population (Jackson, 2011). Therefore, a joint
variable selection for the three models corresponding
to the different transitions between states is done. The
expressions to estimate the transition probabilities for
the disability model can be found in (Jackson, 2011)
and references therein. These estimations are based
on the likelihood maximization. The computation of
confidence intervals for predicted values of the tran-
sitions probabilities are done using a normal approxi-
mation.
Note that the competing risks scenario is included
in the disability model, for this particular example.
In fact, the competing risk scenario is the disability
model without the transition from MI to Death.
For illustration of the model, two types of patients
are defined -low and high risk- setting their character-
istics according to the selected covariates.
2.2.4 Software
We use the R statistical software (R Core Team,
2019), version 3.6.1, for data analysis. In particular,
the survival package (Therneau, 2015) is used for the
composite endpoint scheme analysis described above.
Regarding the multi-state model, it is fitted with the
msm package (Jackson, 2011) for R. Figures are cre-
ated with ggplot2 (Wickham, 2016) and survminer
(Kassambara et al., 2019) packages.
3 RESULTS
The average follow-up was of 805.3 days (2 years, 2
months and 25.3 days), being of 5 days the shortest
BIOINFORMATICS 2020 - 11th International Conference on Bioinformatics Models, Methods and Algorithms
196
and 1771 days the longest follow up time. The ad-
verse events observed during the follow up are given
in the Table 1, in which MACE stands for the com-
posite endpoint of MI and all-cause Death.
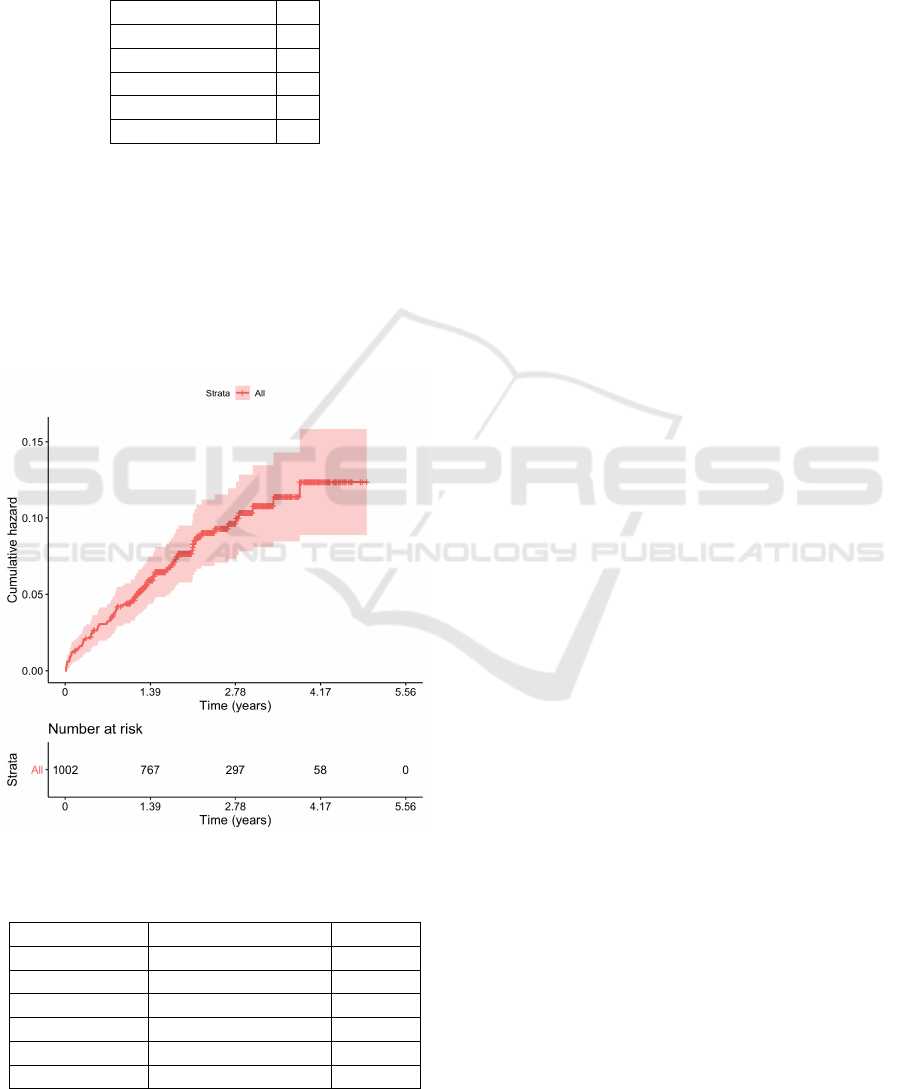
Table 1: Adverse events.
Death 63
MI 31
Revascularization 48
TLR 14
Stent thrombosis 11
MACE 86
Death is the more frequent adverse event observed
in the sample, being of 6.25%, followed by revascu-
larization (4.76%, form which 29.17% were TLR),
MI (3.08%), and stent thrombosis (1.09%).
A Kaplan-Meier graphic of the variable MACE is
represented in Figure 3 and the result of the Cox mul-
tiple regression model for MACE -in terms of hazard
rate (HR)- is shown in Table 2.
Figure 3: Kaplan-Meier curve for MACE.
Table 2: Cox multiple regression model.
Covariate HR (95%CI) p-val
Age 1.04 (1.01 - 1.06) 0.005
LVEF 0.96 (0.94 - 0.98) < 0.001
N. dis. vessels 1.45 (1.03 - 2.02) 0.032
Prior PCI 2.97 (1.67 - 5.29) < 0.001
DAPT months 0.94 (0.88 - 1.01) 0.053
Stent thromb. 14.99 (5.10 - 44.03) < 0.001
Cox regression analysis revealed that age, LVEF,
number diseased vessels, prior PCI, DAPT time and
stent thrombosis were significant factors of MACE,
from which LVEF and DAPT time were protective
(see Table 2). Note that this model provides the prog-
nostic factors for the composite endpoint MACE, in
which the two adverse events are jointly considered.
As explained before, we adjusted a disability
model considering three states:
• State 1:Treatment (908 alive patients and without
MI at the end of the follow up).
• State 2: MI (31 patients with MI after treatment).
• State 3: Death (63 patients died, 8 of them after a
post-treatment MI).
After adjusting the model, we can observe that pa-
tients that suffer a MI after the treatment have a higher
probability to die and that the expected time is 40 days
(19 - 77) after the MI. Additionally, after the treat-
ment, a patient has 1.5 more probability of dying than
to have an MI. This probability is multiplied by 424
for those patients who suffer post-treatment MI.
Transitions between states are determined by cer-
tain factors. In particular, the transition from treat-
ment to MI, 1 → 2, depends on diabetes -2.64 (1.18
- 5.90)-, the number of diseased vessels -1.86 (1.12
- 3.10)-, and stent thrombosis -44.84 (15.24 - 132)-.
Transition from treatment to Death, 1 → 3, is influ-
enced by age -1.06 (1.03 - 1.09)-, LVEF -0.95 (0.92 -
0.97)-, and prior PCI -3.16 (1.65 - 6.07)-. The transi-
tion from MI to Death, 2 → 3, is determined by dia-
betes -8.54 (1.43 - 51.09)- and prior PCI -13.00 (1.35
- 124.94)-. These results are very similar to the ob-
tained in the Cox model for MACE, as expected, al-
though the algorithm was unable to converge when
incorporating DAPT months as a covariate. When
included alone, DAPT months resulted protective for
the transition from treatment to death. Note that the
uncertainty of the estimations for the transition 2 → 3
are larger due to the lower number of observations
available. It is worth to emphasize that, in this model,
it is possible to extract how the different characteris-
tics of the patient, the treatment or the evolution of the
disease affects patient prognosis, distinguishing MI
from Death and from Death after a post-treatment MI.
For example, Cox regression model above showed
that age was a significant factor for MACE, mean-
while the disability model clarifies that this effect is
due to the fact that elder people are more prone to die.
This model allows for predictions of the transition
probabilities for any patient with specific values for
the covariates. In order to simplify and to facilitate
the interpretation of the results, two types of model
patients were described according to the fitted disabil-
Multi-state Models for the Analysis of Survival Studies in Biomedical Research: An Alternative to Composite Endpoints
197
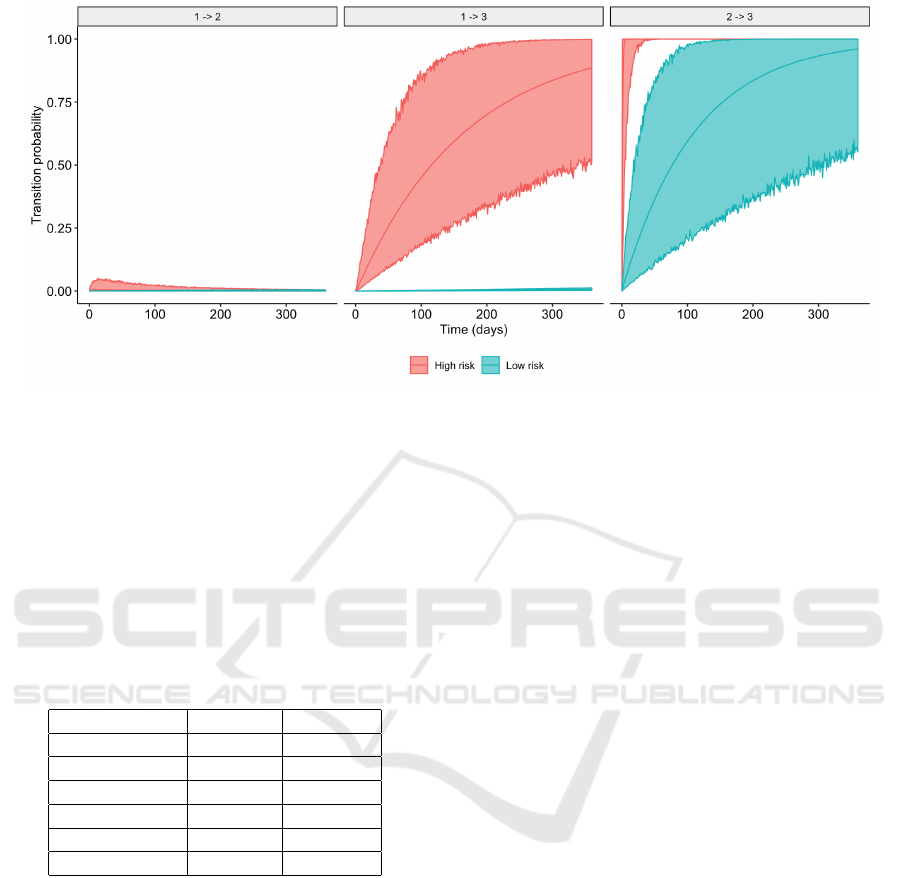
Figure 4: Probability and simulated 95% CI of 1 → 2 (left); 1 → 3 (middle); and 2 → 3 (right); for low and high risk patients.
ity model (see Table 3). A high risk patient is defined
to be 79 years old (sample mean age plus a standard
deviation), diabetic, with a LVEF of 45 (sample mean
LVEF minus a standard deviation, as the factor is pro-
tective), presenting 3 diseased vessels and a prior PCI,
who suffer a stent thrombosis. Covariates values for
the low risk patient are opposite to the ones for the
high risk patient.
Table 3: High and low risk patients characteristics.
Low risk High risk
Age 54 79
Diabetes no yes
LVEF 65 45
N. dis. vessels 1 3
Prev. PCI no yes
Stent thromb. no yes
For high and low risk patients, Figure 4 shows
the first year evolution after the treatment (transitions
1 → 2 and 1 → 3) and from post-treatment MI (tran-
sition 2 → 3), respectively. We can observe that, in
general, the high risk patient has a higher probabil-
ity of dying than the low risk patient, from both states
(treatment or MI). Regarding the transition from treat-
ment to MI, the probability is different during the first
three months, approximately, becoming similar after
that. The width of the simulated confidence intervals
reflects the uncertainty about the estimations, due to
the relatively low incidence of the adverse events.
4 CONCLUSIONS
In this work, we propose multi-state models as an al-
ternative to composite endpoint schemes for survival
studies in biomedical research. A practical example
has been used to illustrate and compare the perfor-
mance of an analysis based on a composite endpoint
with multi-states model.
Biomedical survival studies pursue to understand
the role and significance of prognostic factors in sev-
eral features of the disease such as survival times, ad-
verse events incidence, response to treatment, compli-
cations, etc. Multi-state models are the natural mod-
els for describing the evolution of a disease over time.
Moreover, their flexibility to accommodate different
situations via the state structure, provides them with
a great potential in the analysis of survival data in
biomedical research. Multi-states models provide in-
formation about the expected time and the probabil-
ity of moving from one state to another, depending
on risks factors, treatment characteristics and the past
evolution of the disease.
In contrast to other alternatives to composite end-
points, as the competing risks model, these models
take into account all available data regarding follow
up, without forcing the withdrawal from the study of a
patient for whom an adverse event has been observed.
By presenting a toy example, we have shown how
different covariates may affect the incidence of ad-
verse events, via a multi-state modelization. There-
fore, multi-states models have been proved to pro-
vide a more valuable information than composite end-
points, for clinicians and patients decision making. In
particular, predictions could be done to certain risk
BIOINFORMATICS 2020 - 11th International Conference on Bioinformatics Models, Methods and Algorithms
198

groups, as shown, by defining different characteris-
tics.
The implementation of multi-state models is not
straightforward, especially when considering more
complex states structures than the disability model.
Several issues must be taken into account, which were
out of the scope of this work. First, a Markov dis-
ability model has been considered, hence discarding
a semi-Markov model, i.e. a model in which sur-
vival time for a patient who has experienced a post-
treatment MI depends on the time from treatment
to MI. Therefore, the Markov assumption must be
checked during the analysis. Second, the choice of
the survival models to be use for transition times is
of great importance, and only some options can be
found already implemented in commercial software.
Estimation of the transition intensities will be inac-
curate when a low number of events are observed for
a transition, as can be observed in the results of this
work. Third, model assessment and variable selection
in this setting are still open questions.
Future versions of this work will consider
Bayesian inference in order to be able to work with
more sophisticated states structures and different sur-
vival models, as in (Armero et al., 2016). In that
work, although a relatively simple parametric model
for the hazard function (of each transition) was con-
sidered, posterior distributions of parameters had to
be approximated as software was unavailable, even
for a disability model. Our future research will surely
be a challenge in this sense, especially if a more com-
plex state structure is to be considered. That said,
Bayesian inference also has the advantage of stating
results in terms of probabilities, which are directly in-
terpretable. Such approach would allow us to give
personalized predictions, for example, the probabil-
ity of suffering a MI in the next three months taking
into account the patient’s history. Additionally, the
Bayesian approach provides an ideal framework for
the assessment of the model and for variable selection
in multi-state models, via the Bayes factor and model
simulation.
ACKNOWLEDGEMENTS
The authors want to thank the Epic foundation for
providing the data and useful insights about the re-
sults.
REFERENCES
Andersen, P., Borgan, P., Gill, R., and et al. (1993). Statis-
tical models based on counting processes. Springer,
New York.
Armero, C., Cabras, S., Castellanos, M., Perra, S., Quir
´
os,
A., Oruezabal, M., and Sanchez-Rubio, J. (2016).
Bayesian analysis of a disability model for lung can-
cer survival. Statistical Methods in Medical Research,
25(1):336–351.
Austin, P., Lee, D., and Fine, J. (2016). Introduction to the
analysis of survival data in the presence of competing
risks. Circulation, 133:601–609.
De la Torre Hernandez, J., Moreno, R., Gonzalo, N.,
Rivera, R., Linares, J., Veiga Fernandez, G., Gomez
Menchero, A., Garcia del Blanco, B., Hernandez,
F., Benito Gonzalez, T., Subinas, A., and Escaned,
J. (2018). The pt-cr everolimus stent with bioab-
sorbable polymer in the treatment of patients with
acute cononary syndromes. results from the syn-
ergy acs registry. Cardiovascular Revascularization
Medicine.
Ferreira-Gonzalez, I., Alonso-Coello, P., Sola, I., Pacheco-
Huergo, V., Domingo-Salvany, A., Alonso, J., Mon-
tori, V., and Permanyer-Miralda, G. (2008). Compos-
ite endpoints in clinical trials. Revista Espa
˜
nola de
Cardiolog
´
ıa, 61(3):283–290.
Irony, T. (2017). The “utility” in composite out-
come measures. measuring what is important to pa-
tients. Journal of the American Medical Association,
318(18):1820.
Jackson, C. (2011). Multi-state models for panel data: The
msm package for R. Journal of Statistical Software,
38(8):1–29.
Kassambara, A., Kosinski, M., and Biecek, P. (2019).
survminer: Drawing Survival Curves using ’ggplot2’.
Kip, K., Hollabaugh, K., Marroquin, O., and Williams, D.
(2008). The problem with composite end points in
cardiovascular studies: The story of major adverse
cardiac events and percutaneous coronary interven-
tion. Journal of the American College of Cardiology,
51(7):701–707.
McCoy, C. (2018). Understanding the use of composite
endpoints in clinical trials. Western Journal of Emer-
gency Medicine, 19(4):631–634.
Meira-Machado, L., de U
˜
na-
´
Alvarez, J., Cadarso-Su
´
arez,
C., and Andersen, P. (2009). Multi-state models for
the analysis of time-to-event data. Statistical Methods
in Medical Research, 18:195–222.
N
´
u
˜
nez, E., Steyerberg, E., and N
´
u
˜
nez, J. (2011). Estrate-
gias para la elaboraci
´
on de modelos estad
´
ısticos de re-
gresi
´
on. Revista Espa
˜
nola de Cardiolog
´
ıa, 64:501–
507.
Putter, H., Fiocco, M., and Geskus, R. (2007). Tutorial in
biostatistics: competing risks and multi-state models.
Statistics in Medicine, 26:142–161.
R Core Team (2019). R: A Language and Environment for
Statistical Computing. R Foundation for Statistical
Computing, Vienna, Austria.
Therneau, T. M. (2015). A Package for Survival Analysis in
S.
Wickham, H. (2016). ggplot2: Elegant Graphics for Data
Analysis. Springer-Verlag New York.
Multi-state Models for the Analysis of Survival Studies in Biomedical Research: An Alternative to Composite Endpoints
199
