
Weighted k-Nearest Neighbor Adaptations to Spare Part Prediction
Business Scenario at SAP System
Eren Esgin
AI Research, MBIS R&D Center, Istanbul, Turkey
Informatics Institute, Middle East Technical University, Ankara, Turkey
Keywords: Classification, CRISP-DM, Intelligent Maintenance, SAP, Spare Part Prediction, Weighted k-Nearest
Neighbor.
Abstract: In the context of intelligent maintenance, spare part prediction business scenario seeks promising return-on-
investment (ROI) by radically diminishing the hidden costs at after-sales customer services. However, the
classification of class-imbalanced data with mixed type features at this business scenario is not straightforward.
This paper proposes a hybrid classification model that combines C4.5, Apriori algorithms and weighted k-
Nearest Neighbor (kNN) adaptations to overcome potential shortcomings observed at the corresponding
business scenario. While proposed approach is implemented within CRISP-DM reference model, the
experimental results demonstrate that proposed approach doubles the human-level performance at spare part
prediction. This highlights a 50% decrease at the average number of customer visits per fault incident and a
significant cutting at the relevant sales and distribution costs. According to best runtime configuration analysis,
a real-time spare part prediction model has been deployed at the client’s SAP system.
1 INTRODUCTION
Average number of customer visits per fault incident
is a critical key performance indicator (KPI) at after-
sales customer services such that, undesirable
repetitive customer visits result in a significant
increase at hidden sales and distribution costs.
Additionally, it may affect the quality level of after-
sales services and deteriorates the organizational
goodwill at long run. Respectively, spare part
prediction business scenario aims to generalize the
spare part consumption patterns according to failure
characteristics, product’s own features and consumer
detailed information and then proactively proposes
the most probable spare part for new failure incident.
Although classification algorithms have been
widely used in retail, finance, banking, security,
astronomy and behavioral ecology domains
(Kantardzic, 2011) and the classifiers for class-
balanced data are relatively well developed, the
classification of class-imbalanced data with mixed
type features is not straightforward
(Liu et al., 2014).
This paper proposes a hybrid classification algorithm
such that, while Apriori is adapted to handle data
anomalies and redundancies observed at data
preparation, significance weights obtained at C4.5 are
used for doing normalization on categorical features
to adapt the inter-dimension similarity at computing
the similarity between fault instances. As the
following, two adaptations of weighted kNN are
applied: while instance based kNN with count
(
IkNNwC) gives more importance to major instances
that are more likely to represent a dominant class in
neighborhood region of feature space, instance based
kNN with average similarity score (
IkNNwAS) aims
to balance the discriminative power of minor (or
outlier) instances. Proposed approach is evaluated
according to the fault records of television (TV)
product group within 5 years’ time period and full-
cycle data mining framework, which covers all
phases from business understanding to deployment, is
implemented according to CRISP-DM (Cross
Industry Standard Procedure for Data Mining)
reference model.
The paper is organized as follows. Section 2
reviews the related work about kNN adaptations.
Section 3 explains the proposed classification
approach within the context of CRISP-DM reference
model such that, business understanding, data
understanding, data preprocessing and modeling
phases are briefly explained. Section 4 discusses the
experimental results according to the performance
218
Esgin, E.
Weighted k-Nearest Neighbor Adaptations to Spare Part Prediction Business Scenario at SAP System.
DOI: 10.5220/0009103202180226
In Proceedings of the 9th International Conference on Operations Research and Enterprise Systems (ICORES 2020), pages 218-226
ISBN: 978-989-758-396-4; ISSN: 2184-4372
Copyright
c
2022 by SCITEPRESS – Science and Technology Publications, Lda. All rights reserved

observed at evaluation and deployment phases. The
conclusion and future work are summarized in
Section 5.
2 LITERATURE REVIEW
kNN algorithm considers a firm representative of the
classification by analogy (Domingos, 2015). Naturally,
finding an optimal value of k, which represents how
many closest neighbors are to be considered, has been
one of the questions that some works have attempted
to solve
(Zhang et al., 2017; Zhu et al., 2016). Besides
finding the k-value, the underlying distance
calculation is another issue in this kind of
classification. Using a weighted scheme was first
introduced by
(Dudani, 1976), this variant of kNN is
called Distance-Weighted k-Nearest Neighbor
(
DWkNN). (Tan, 2015) proposed the algorithm
Neighbor-Weighted k-Nearest Neighbor (NWkNN),
which applies a weighing strategy based on the
distribution of classes.
(Mateos-Garcia et al., 2016)
developed a technique that optimizes the weights that
would indicate the importance of neighborhood in a
similar way of Artifical Neural Network.
(Parvinnia et
al., 2014) also computed a weight for each training
object based on a matching strategy. Respectively,
(Aguilera et al., 2019) proposed a weighting based on
Newton’s gravitational force, so that a mass (or
relevance) is to be assigned to each instance. Two
methods of mass assignment is presented: circled by
its own class (CC) and circled by different class (CD).
The standard kNN algorithm is not suitable for the
presence of imbalanced class distribution. Hence,
kENN in (Yuxuan & Zhang, 2011) and CCW-kNN in (Liu
& Chawla, 2011)
have been proposed to improve the
performance of kNN for imbalance classification.
While
kENN proposed a training stage where positive
training instances are identified and generalized into
Gaussain balls,
CCW-kNN uses the probability of
feature values given class labels to weight prototypes
in kNN.
(Song et al., 2007) also proposed new kNN
algorithms based on informativeness which is
introduced as a query-based distance metric. This
informativeness is handled in two concerns: locally
informative (
LI-kNN) and globally informative (GI-
kNN
). Alternatively, (Wang et al., 2011) presented a
coupled nominal similarity to examine both intra- and
inter-coupling of categorical features. These
approaches majorly focused on the clustering on
class-balanced data.
3 PROPOSED APPROACH
CRISP-DM reference model is applied as the major
road map for spare part prediction scenario.
Respectively, the underlying sequence of the phases
is not rigid, moving back and forward between
difference phases is always required
(Chapman et al.,
1999)
. CRISP-DM reference model consists of six
phases: business understanding, data understanding,
data preparation, modelling, evaluation and
deployment. Except evaluation and deployment
phases, we briefly outline corresponding phases at the
following sections.
3.1 Business Understanding
In current (as-is) situation, each customer call to
customer call center triggers a new fault record at
SAP CRM system. During this call, fault occurrence
details (e.g. product group, complaint or symptom
information in a hierarchical manner) are gathered
from the customer. Then, customer details (e.g.
customer profile and location) are enhanced and
product details (e.g. product SKU (stock keeping
unit), material type, material group and product
hierarchy) are extracted from prior product assembly
history at SAP CRM system. Afterwards, the
corresponding fault record is assigned to a near-by
technical service according to customer’s location.
Finally, the technical service makes a feasibility visit
to check out the fault reason and defective
component. Each customer visit for the
corresponding fault incident is managed by a unique
maintenance line item and spare part consumption or
maintenance activity at this customer visit is charged
to this line item.
As the to-be situation, it is aimed to position a
spare part prediction model that suggests the most
probable spare part for the corresponding fault
incident and passes this suggestion to the technical
service in a real-time manner. Hence technical service
can proactively reorganize the in-car spare part stock
and daily customer routes. Moreover, it is aimed to
radically diminish average number of customer visits
per fault incident. Indeed, hidden sales and
distribution cost items and spare part consumptions
are strongly correlated to the number of customer
visits and reductions at the corresponding KPI will
minimize relevant expenses at income statement (e.g.
freight costs, maintenance and depreciation costs of
technical service vehicles, etc.). As an intangible
outcome, we also aim to improve the quality level of
after-sales services and increase the organizational
Weighted k-Nearest Neighbor Adaptations to Spare Part Prediction Business Scenario at SAP System
219
goodwill in long run. Current as-is and proposed to-
be situations are represented in Figure 1.
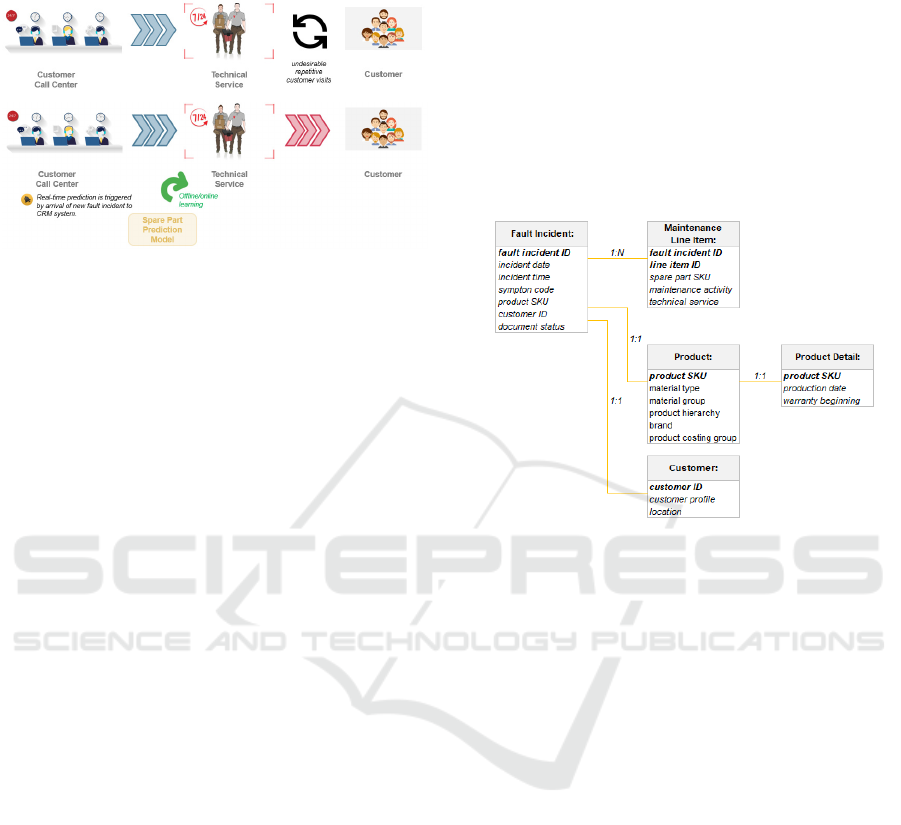
Figure 1: Current (as-is) and to-be scenarios. By the effect
of spare part prediction model, undesirable repetitive
customer visits will be lessened.
As the human-level performance in the current as-is
situation, the average number of customer visits per
fault incident KPI is approximately 2.5, which means
a 40% accuracy at predicting the appropriate spare
part. The data mining objective in this business
scenario is 80% accuracy and this implies halving of
relevant sales and distribution costs.
3.2 Data Understanding
Data understanding phase starts with describing
major data sources, the relations among these data
sources and major attributes that build up the initial
raw data. At first, the data dictionary enlisting all
gross and surface properties of the initial raw data is
described. Then, the corresponding data description
is explored to assess potential anomalies and data
redundancies among the attributes and verify data
quality problems in order to refine the initial raw data.
3.2.1 Data Description
The corresponding business scenario is composed of
five data sources:
Fault Incident. Fault incident holds the header
information of corresponding incident record,
e.g. fault incident ID, incident date and time,
symptom codes, document status, relevant
customer ID and product SKU.
Maintenance Line Item. Maintenance line item
holds spare part consumption and maintenance
activity charged at each customer visit. There
exists a one-to-many (1:N) relation between fault
incident and maintenance line item.
Product. Product holds the major features about
the defective product, e.g. product SKU, material
type, material group, product hierarchy, brand
and product costing group.
Product Details. Product details holds major
production details, e.g. production date and
warranty beginning date. There exists a one-to-
one (1:1) relation between product and product
details data sources.
Customer. Customer holds the customer profile
and location in a city-to-district hierarchy.
Context diagram given in Figure 2 depicts the
relations among the data sources.
Figure 2: Context diagram for the corresponding data
sources.
3.2.2 Data Exploration
Data exploration assesses the correlation among the
attributes and checks whether any data anomalies and
redundancies occur. According to these assessment
actions, while each instance at initial raw dataset
represents a unique maintenance line item, a
significant data replication problem has emerged such
that; except the spare part target class, all attributes
are acquired from the same data sources, i.e. fault
incident, product, product detail and customer. As a
result, there occurs distinct instances featured with
replicated (the same) attribute values and distinct
spare part target value at initial raw data collection.
As a solution, each instance should be characterized
at a higher abstraction level by relating to a unique
fault incident. Hence, an alternative data exploration
procedure is applied to collect the spare part target
class as shown in Figure 3.
Accordingly, alternative data exploration
procedure is composed of three steps as follows:
Raw Data Aggregation. This initial step
aggregates the spare part consumptions at each
maintenance line item that are relevant to the
same fault incident. Respectively, it resembles
transposing
the spare part values at relevant
ICORES 2020 - 9th International Conference on Operations Research and Enterprise Systems
220
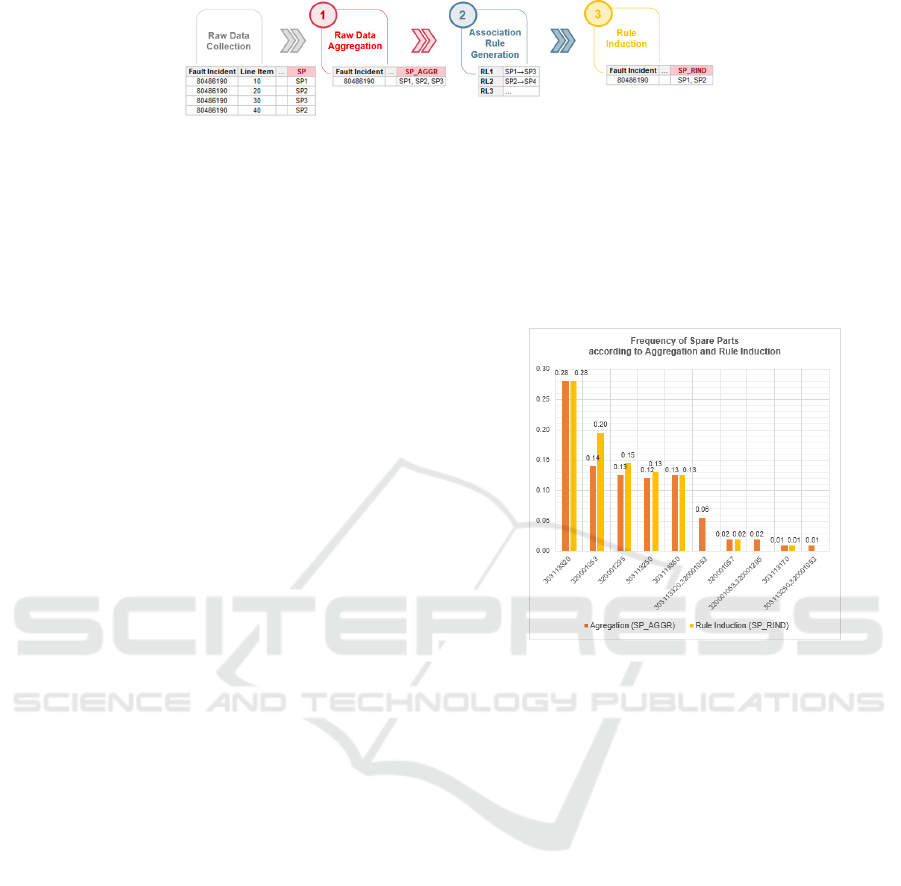
Figure 3: Alternative data exploration procedure. A fault incident with four maintenance lines is transformed into a single
instance at final dataset.
maintenance line items and concatenating these
values into a single derived target class, i.e.
SP_AGGR. While concatenating spare part values
at a fault incident, duplicated values are unified
and unique values are sorted in ascending order,
e.g.
<SP1, SP1, SP3, SP2> is aggregated as <SP1,
SP2, SP3>.
Association Rule Generation. Respectively,
aggregated dataset is like frequent itemsets and
these itemsets can be represented by a Boolean
vector of spare part values to underlying
variables. Indeed, these Boolean vectors can be
analyzed for spare part consumption patterns that
highlight frequently associated spare part
combinations. These patterns can be represented
in the form of association rules.
Apriori is a seminal algorithm proposed for
frequent itemsets for Boolean association rules.
The name of the algorithm is based on the fact
that it uses prior knowledge of frequent itemset
properties
(Kantardzic, 2011). In this context,
Apriori is applied by using R (R packages:
arules and arulesViz). Then generated
association rules are filtered by min_lift, i.e.
min_lift > 1.0 threshold is used to extract only
positively correlated spare part combinations.
Rule Induction. Rule induction step converts
aggregated spare part target class values
(
SP_AGGR) into refined forms according to
previously generated association rules.
In this aspect, significant association rules are
determined by min_confidence threshold, the
default value of this parameter is 0.8. Filtered
association rules are sorted by lift and confidence
values in descending order. Afterwards, each
spare part target class value at aggregated data set
is searched at association rules whether
antecedent and consequent of the association rule
both exist at the corresponding aggregated spare
part target class value. In the case of presence,
consequent is removed from the aggregated spare
part target class value and this new value is
assigned to a new target class, i.e. rule induced
spare part
SP_RIND. Otherwise, original value of
aggregated spare part is copied to rule induced
spare part target class.
Figure 4 shows the effect of rule induction step at
the frequencies of target classes, i.e.
SP_AGGR and
SP_RIND. Due to <320001053>→<303113320>
association rule, there happens a significant increase
at the frequency of
320001053.
Figure 4: Frequency of spare parts according to aggregation
and rule induction operations.
3.3 Data Preparation
Data preparation covers data integration,
transformation and cleaning activities that are required
to construct the final dataset from the initial raw data.
In data integration step, an appropriate SQL script
according to the context diagram given in Figure 2 is
implemented to extract the fault incidents of
television (TV) product group, which occurred within
5 years’ time span (between year 2014 and 2018)
from SAP CRM and SAP BW source systems,. Then
alternative data exploration procedure stated in
Section 3.2.2 is applied to avoid data replications and
anomalies observed at maintenance line item level.
Due to raw data aggregation step at the underlying
procedure, a vertical data reduction occurs such that;
750K instances at maintenance line item dataset are
suppressed to 350K instances at aggregated final
dataset. Additionally, in order to avoid attribute
redundancy due to hierarchical (ordinal) attributes
(e.g. customer location, product hierarchy and
symptom codes), attributes with relatively higher
detail level and wider value range are selected. For
Weighted k-Nearest Neighbor Adaptations to Spare Part Prediction Business Scenario at SAP System
221
instance, product hierarchy 8 attribute (PRDHYR8) is
selected as the most detailed product hierarchy
feature and lower level attributes (
PRDHYR2–7) are
omitted. At data transformation step, month and year
attributes are parsed from the underlying date typed
attributes, e.g. incident date and production date.
Moreover, new attributes such as product age,
product stock age and warranty status are derived.
Indeed, the value range of rule induced spare part
target class (
SP_RIND) is composed of 1267 distinct
values. Hence, the instances with relatively less
frequent spare part values (i.e.
freq(RIND_SP)<1000
condition refers to a 0.22% frequency) are eliminated
at data cleaning step and a 95.27% total coverage at
final dataset is achieved after this operation as shown
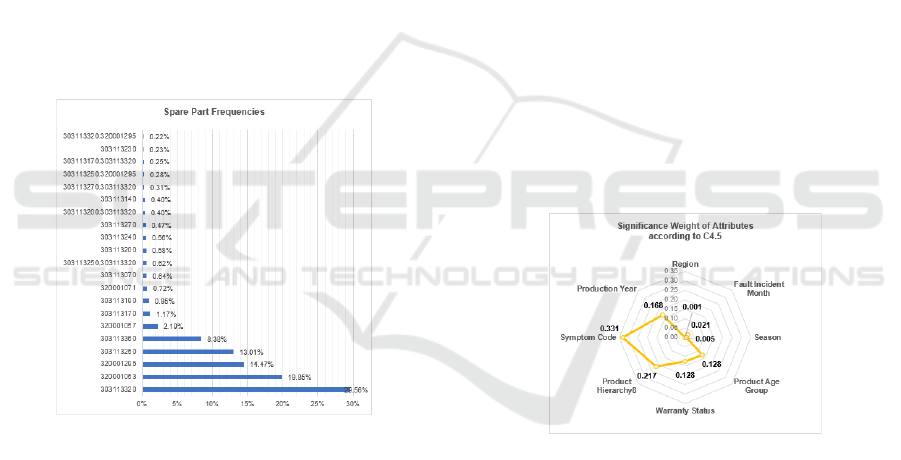
at frequency histogram given in Figure 5.
Additionally, various spare part groups are defined
according to the frequency order such as
ALL, TOP3
and TOP6 such that, TOPX implies topmost X spare
parts according to the frequency at the final dataset.
The underlying histogram highlights class-
imbalanced dataset rationale.
Figure 5: Frequency of spare part target values after data
cleaning.
3.4 Modelling
Spare part prediction business scenario is a kind of
supervised learning due to the existence of a target
class,
SP_RIND, and the major objective of this
scenario is to seek significant drivers and patterns
highlighting the underlying phenomenon. According
to data dictionary, almost all attributes at final dataset
are categorical with a wide value range except the
derived attributes, e.g. product age and product stock
age. Therefore, we proposed a hybrid approach that
combines C4.5 and Apriori algorithms with weighted
kNN adaptations for the underlying class-imbalanced
mixed type final dataset.
3.4.1 C4.5
C4.5 adapts a greedy and nonbacktracking approach
in which decision trees are constructed as the
classifier in a top-down recursive divide-and-conquer
fashion
(Kantardzic, 2011). The corresponding
attribute selection method specifies a heuristic
procedure for selecting the attribute that best
discriminates the given tuples according to class.
In the context of spare part prediction scenario,
C4.5 is applied by using R (R package:
rpart) with
information gain attribute selection and min_split
parameter is set as 50. While 42.5% accuracy
performance of C4.5 suggests a ground truth for the
candidate algorithms, it majorly proposes the
significance weight of the attributes at determination
of spare parts as shown in Figure 6. Although several
similarity measures, such as the Jaccard coefficient
overlap
(Pang-Ning et al., 2006), cosine similarity (Liu
et al., 2014) and Goodall similarity (Boriah, 2008) can
be used with categorical data, they are usually general
as similarities at continuous data and ignores the
information hiding in the co-occurrence with the
target class. Hence, significance weight obtained by
C4.5 are used as inter-coupling similarity weights
(interDim_weight) at kNN adaptations as given in
Section 3.4.3.
Figure 6: Radar graph for significance weight of attributes
according to C4.5. Respectively, product hierarchy8 and
symptom code are the main determinants at spare part
prediction.
3.4.2 Apriori
As stated in Section 3.2, Apriori fundamentally
explores significant association and correlation rules
among spare part consumptions. The underlying
algorithm also generates
IF/THEN typed causality
rules for predicting target class without presence of a
classifier. Respectively, Apriori is applied with
min_support > 0.01 condition for the final dataset and
approximately 2710 causality rules are generated.
Table 1 exemplifies some generated Apriori causality
rules.
ICORES 2020 - 9th International Conference on Operations Research and Enterprise Systems
222
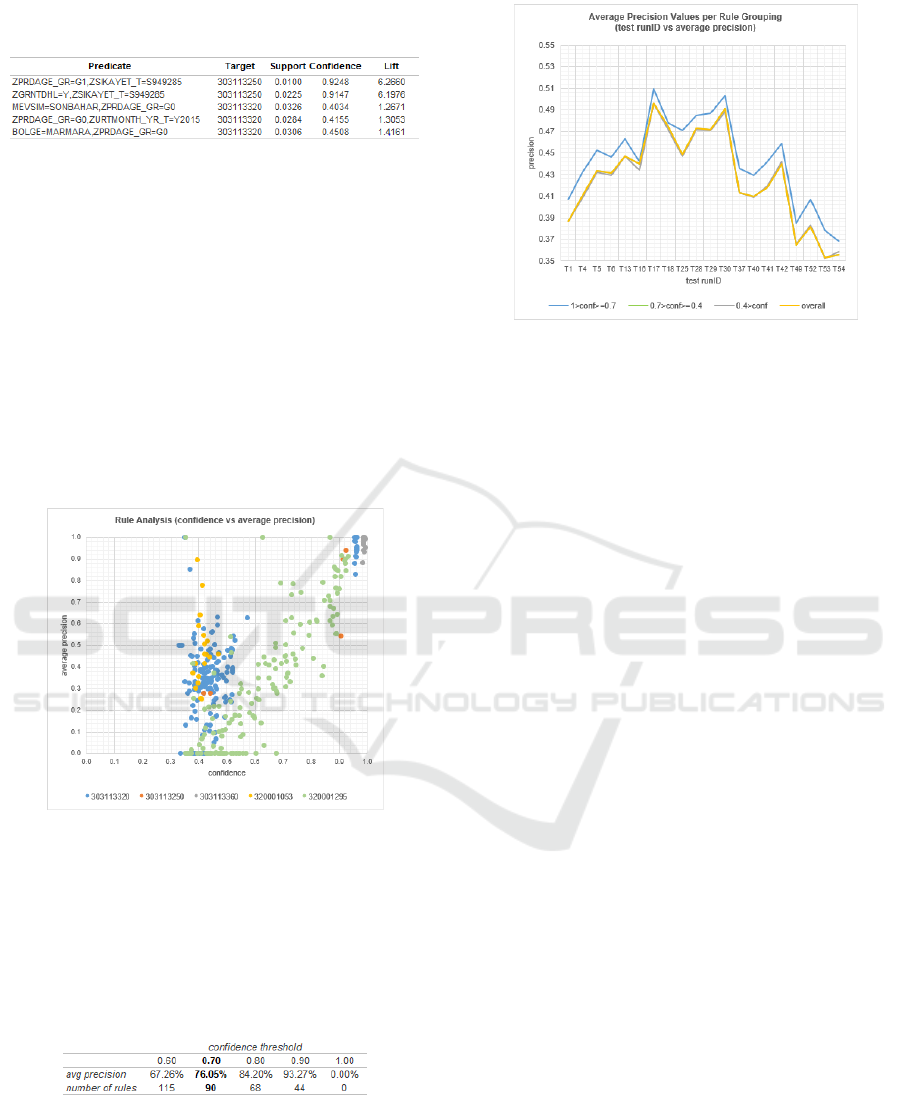
Table 1: Sample IF/THEN typed causality rules generated
by Apriori.
Rules with min_lift > 1.0 property are validated
according to 66 test scenarios, which are configured
by different incident year, spare part groups (
ALL,
TOP3 and TOP6) and validation methods (i.e. hold-out
and k-fold cross-validation with k = 3, 5, 10). While
ALL year group has an average accuracy of 52%, the
accuracy for year 2017 peaks at 55.7%. The lowest
average accuracy of 45.3% is obtained at year 2015.
Moreover, a significant correlation between rule
precision and confidence is observed as shown in
Figures 7. However, rules with confidence values
between 0.4 and 0.6 seriously result in false
predictions (FP-false positive) with an average
precision of 25.27%.
Figure 7: Rule analysis (confidence vs average rule
precision).
According to Table 2, min_confidence = 0.7 is
designated as the confidence threshold for filtering
relatively weak causality rules. Figure 8 emphasizes
the average precision gap between the rule groups.
Table 2: Confidence threshold determination.
3.4.3 kNN and Adaptations
kNN classification is based on online learning scheme
by analogy; that is by comparing a given test instance
with training tuples at knowledge repository that are
similar to it
(Kantardzic, 2011). The training tuples are
Figure 8: Average precision values per rule grouping.
represented in a n-dimensional pattern space. When
given an unknown tuple, a kNN classifier searches the
pattern space for the k training tuples that are closest
to the unknown instance. Closeness is defined in
terms of a distance function such as Euclidean
distance. Typically, the values of each attribute
should be normalized before distance calculation. But
the distance calculation for categorical attributes and
relative distance within the value range of these
attributes are two major issues emerged at spare part
prediction scenario. As the first adaptation to kNN,
the underlying closeness measurement is converted
into a similarity measurement,
simScr(ins
i
,ins
j
), as
shown in Equation 1.
simScr
൫
ins
i
,ins
j
൯
=
interDim_weight
dim
×
intraDim_weight
൫
ins
i
.dim,ins
j
.dim
൯
n
dim
=1
(1)
In Equation 1, interDim_weight is the
normalization weight assigned for each significant
attribute (dim) and the significance weight obtained
at C4.5 is used for normalizing categorical attributes
to adapt the inter-dimension similarity.
intraDim_weight factor holds the similarity degree of
different level of the corresponding hierarchical
(ordinal) attributes. While these similarity degrees are
determined by domain experts, nominal difference at
the numeric attribute values of instances, ins
i
and ins
j
,
is used as intraDim_weight. In the context of
similarity measurement, we propose two kNN
adaptations: instance based kNN (
IkNN) and average
kNN (AkNN).
At IkNN adaptation, the similarity between new
fault incident and neighboring objects in the final
dataset is measured by Equation 1. Then the nearest
neighboring data points according to the similarity
values are determined by neigh_limit. This argument
is a percentile limit that preserves the closest training
objects in a spherical-like region and its value is
Weighted k-Nearest Neighbor Adaptations to Spare Part Prediction Business Scenario at SAP System
223
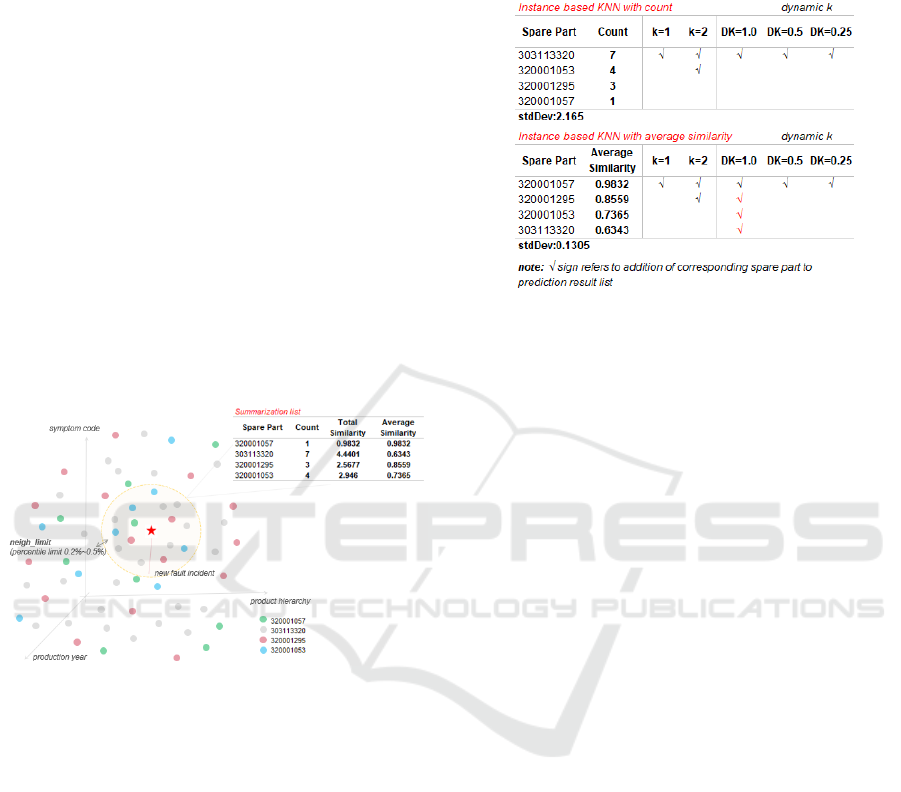
parametrized at [0.2%, 1.0%] interval. Then as shown
in Figure 9, count, total and average similarity values
per spare part target class value are summarized
within the closest neighboring objects. At this point,
IkNN has two variations:
Instance based kNN with Count (
IkNNwC).
Common spare parts at prediction result list are
determined by count value. By doing this, it is
aimed to give less importance to objects that are
more likely to represent a different class. In other
words, the idea is to penalize rare instances and
make the classifier more robust to the outliers.
Instance based kNN with Average Similarity
Value (
IkNNwAS). Common spare parts at
prediction result list are determined by average
similarity value. This variation aims to balance
the discriminative power of an outlier object,
since it could be relevant to classify other outlier
object. It also allows to better modeling class-
imbalanced dataset by giving more chance to
objects less represented.
Figure 9: A sample Instance based kNN (IkNN) use-case
for a new fault incident.
Finally, spare part prediction result list is finalized
according to k-limit argument as follows:
In the case of k-limit = n, i.e. n = 1, 2…, the
topmost n spare part values according to count or
average similarity value rank are returned as
prediction result list. The maximal value for n is
limited as 2 at this business scenario.
In the case of dynamic k, i.e. k-limit = DK and
DK in [0, 1] interval, the standard deviation
(stdDev) of the corresponding value (i.e. count or
average similarity) is calculated. If the difference
between two consecutive spare part target values
is greater than DK×stdDev, then prediction result
list is returned as the combination of all checked
spare part values. Otherwise, it is continued to
check the following lines at summarization list.
Table 3 exemplifies the k-limit application at
IkNN
variation.
Table 3: k-limit application for IkNN variations. Especially
larger DK values with lower standard deviation may
weaken the capability at selective prediction. Hence, longer
prediction result list results in an accuracy decrease.
Respectively,
AkNN is similar to IkNN adaptation
except neighbor preservation such that, neigh_limit
argument is not applied at
AkNN. Otherwise,
summarization list is formed by traversing all training
tuples at the final dataset. Therefore,
AkNN is
relatively more time-consuming and rather less
capable at pinpointing minor (or outlier) objects at n-
dimensional space.
4 EXPERIMENTAL RESULTS
Major outcomes of evaluation and deployment phases
at CRISP-DM life cycle are presented in this section.
4.1 Evaluation
As stated in Section 3.4.2, Apriori causality rules with
confidence between 0.4 and 0.6 tend to make
erroneous predictions such that, they have an average
precision of 25.27%. Therefore, min_confidence =
0.7 is designated as confidence threshold to eliminate
these weak rules. Respectively, we propose the
following hybrid classification algorithm:
Initially, it is attempted to predict new fault
incident by relatively confident Apriori causality
rules.
In the case of unpredicting by Apriori, kNN
adaptations are applied to classify the
corresponding incident by an online learning
schema.
Hence, 56 test scenarios are configured by varying
incident year, spare part groups, kNN variations and
arguments (neigh_limit and k-limit) and validation
methods. As shown in Table 4, while pure Apriori
ICORES 2020 - 9th International Conference on Operations Research and Enterprise Systems
224
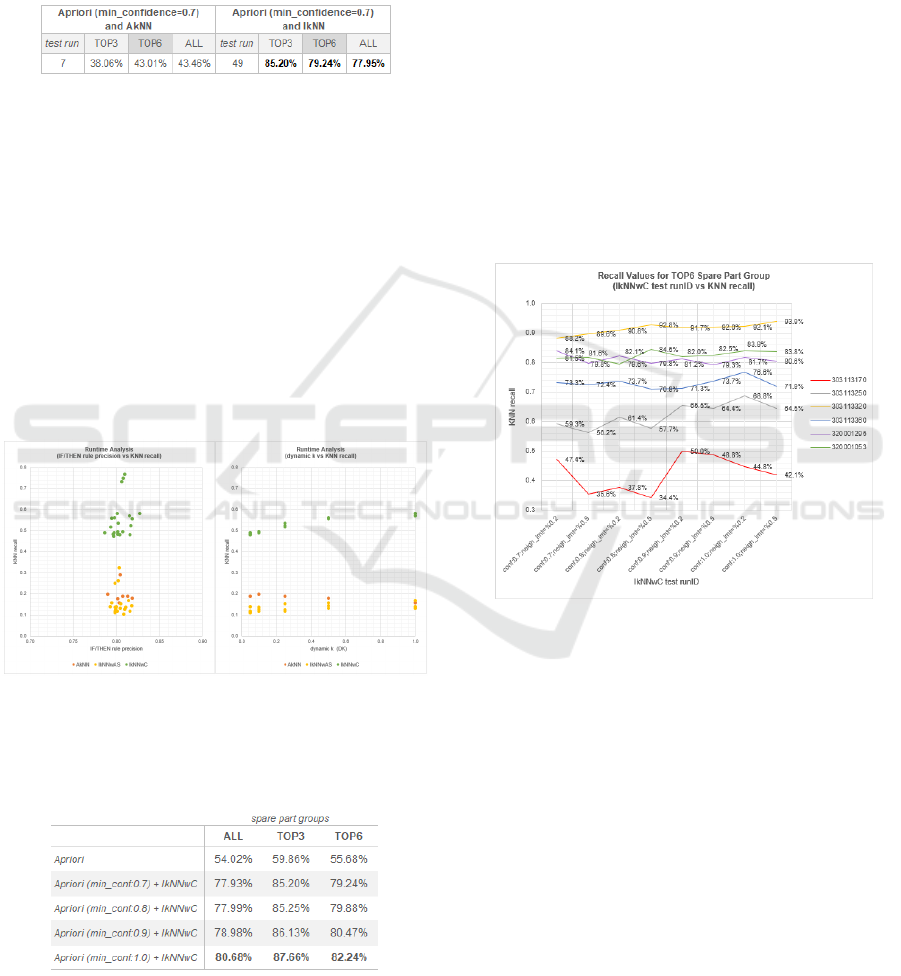
casuality rules have an average accuracy of 54.02%,
the combination of Apriori with IkNN adaptation
improves average accuracy towards 77.95% level.
This metric is approximately 85.2% for
TOP3 and
79.24% for TOP6 spare part group.
Table 4: Average accuracy values per hybrid classification
algorithms.
According to the runtime analysis given in Figure 10,
while Apriori causality rules within [0.78, 0.82]
precision interval are intensively used,
IkNNwC
variation has a better prediction performance.
Although increments at dynamic k (DK) argument has
a positive effect at the recall values of
IkNNwC
variation, the inverse effect is valid for AkNN and
IkNNwAS variations. This is due to the fact that, while
count-based adaptation at kNN is seemingly more
robust to the changes made at the extents of
neighborhood region, the selective prediction
capabilities of average score-based adaptations are
more vulnerable to these changes. Hence, the
discriminative power of minor class is lost.
Figure 10: Runtime analysis for kNN adaptations.
Table 5: Average accuracy per spare part group. Average
accuracy of proposed approach is improved by the
increments at the confidence threshold.
As the next iteration, the confidence threshold
determined in Section 3.4.2 is incremented linearly
within [0.7, 1.0] interval. As a result, the combination
of Apriori rules (with min_confidence = 1.0) with
IkNNwC variation (with k-limit = 2 and neigh_limit =
0.2% arguments) reaches to an average accuracy of
80.68% as shown in Table 5.
When recall values per spare part are separately
analyzed, spare part
303113250 (with a frequency of
13.01% as shown in Figure 5) has a significant
increase of 7.8% at its recall values as shown in
Figure 11. Potentially, erroneous causality rules with
consequent equal to
303113250 are intensively handed
over by the predictions made by
IkNNwC variation
and this online learning schema is relatively more
accurate. Similar mechanism is valid for spare part
303113320 with the highest frequency given in Figure
5. A 2.8% increase at the recall values of the
corresponding spare part causes a significant
increasing-return effect on accuracy as shown in
Table 5.
Figure 11: Recall values for TOP6 spare part group.
4.2 Deployment
Due to the results obtained at evaluation phase, the
best runtime configuration is designated as Apriori
causality rules (with min_confidence = 1.0) with
IkNNwC variation (with k-limit = 2 and neigh_limit =
0.2% arguments). This hybrid classification model is
implemented as a custom function at SAP BW system
as shown in Figure 12. In addition to spare part
prediction, the underlying function recommends
potential concomitant spare part consumptions. These
associated consumptions are based on the association
rules generated by alternative data exploration
procedure stated in Section 3.2.2.
According to performance measurement, average
prediction duration of a single fault incident is
approximately 7.79 second (i.e. remote function
Weighted k-Nearest Neighbor Adaptations to Spare Part Prediction Business Scenario at SAP System
225

connection (RFC) time between SAP CRM and BW
systems is excluded). Since mean arrival time
between two consecutive fault incidents is
approximately 36.5 second, it is technically feasible
to perform a real-time spare part prediction.
Figure 12: View of spare part prediction result list. While
odd numbered lines at PRED_RESULT prediction result
list inform spare part predictions, even lines indicate
concomitant spare part consumptions. HZMBSLK is the
unique identifier for the corresponding fault incident.
5 CONCLUSIONS
This paper proposes a hybrid classification algorithm
for the underlying spare part prediction scenario such
that, while Apriori is adapted to handle data anomalies
and redundancies emerged at data exploration,
significance weights obtained at C4.5 incorporates the
inter-dimension similarity at interpreting the
neighborhood among fault instances. Finally, two
adaptations of weighted kNN are applied:
IkNNwC
gives more importance to major instances that are more
likely to represent a dominant class in neighborhood
region of feature space,
IkNNwAS aims to balance the
discriminative power of minor class.
According to experimental results, proposed
hybrid classification algorithm doubles the human-
level performance at spare part prediction, which is
approximately 40% accuracy. This performance
implies a 50% decrease at the average number of
customer visits per fault incident. Hence a significant
cutting at especially sales and distribution costs is
expected by the effect of spare part prediction model.
As future work, we plan to extend the corresponding
modeling to other product groups.
REFERENCES
Aguilera, J., Gonzalez, L. C., Montes-y-Gomez, M. &
Rosso, P. (2019). A New Weighted k-Nearest Neighbor
Algorithm based on Newton's Gravitational Force.
CIARP 2018, 305-313.
Boriah, S., Chandola, V., & Kumar, V. (2008). Similarity
Measures for Categorical Data: A Comparative
Evaluation, SDM, 243-254.
Chapman, P., Clinton, J., Kerber, R., Khabaza, T., Reinartz,
T., Shearer, C., Wirth, R. (1999). CRISP-DM 1.0 Step-
by-Step Data Mining Guide.
Domingos, P. (2015). The Master Algorithm: How the
Quest for the Ultimate Learning Machine Will Remake
Our World. Basic Books.
Dudani, S.A. (1976). The Distance-Weighted k-Nearest-
Neighbor Rule. IEEE Trans. Syst. Man Cybern. SMC-
6(4), 325-327.
Kantardzic, M. 2011). Data Mining: Concepts, Models,
Methods, and Algorithms. Wiley-IEEE Press.
Liu, C., Cao, L. & Yu, P. S. (2014). A Hybrid Coupled k-
Nearest Neighbor Algorithm on Imbalance Data.
International Joint Conference on Neural Networks
(IJCNN).
Liu, W. & Chawla, S. (2011). Class Confidence Weighted
kNN Algorithms for Imbalanced Data Sets, Advances
in Knowledge Discovery and Data Mining, 345-356.
Mateos-Garcia, D., Garcia-Gutierrez, J. & Riquelme-
Santos, J.C. (2016). An Evolutionary Voting For k-
Nearest Neighbors. Expert Syst. Appl. 43, 9-14.
Pang-Ning, T., Steinbach, M. & Kumar, V. (2006).
Introduction to Data Mining, Library of Congress, 74.
Parvinnia, E., Sabeti, M., Zolghadri Jahromi, M. & Boostani,
R. (2014). Classification of EEG Signals Using Adaptive
Weighted Distance Nearest Neighbor Algorithm. J. King
Saud Univ. Comput. Inf. Sci. 26(1), 1-6.
Song, Y., Huang, J., Zhou, D., Zha, H. & Giles, C. L.
(2007). IkNN: Informative K-Nearest Neighbor Pattern
Classification, Knowledge Discovery in Databases:
PKDD 2007, 248-264.
Tan, S. (2005). Neighbor-Weighted K-Nearest Neighbor for
Unbalanced Text Corpus. Expert Syst. Appl. 28(4),
667-671.
Wang, C., Cao, L., Wang, M. Li, J., Wei, W. & Ou, Y.
(2011). Coupled Nominal Similarity in Unsupervised
Learning, CIKM 2011, 973-978.
Yuxuan, L. & Zhang, X. (2011). Improving K Nearest
Neighbor with Exemplar Generalization for
Imbalanced Classification, 15th Pacific-Asia
Conference, PAKDD 2011, 1-12.
Zhang, S., Cheng, D., Deng, Z., Zong, M. & Deng, X.
(2017). A Novel kNN Algorithm with Data-Driven k
Parameter Computation. Pattern Recognit. Lett. 1-11.
Zhu, Q., Feng, J. & Huang, J. (2016). Natural Neighbor: A
Self-Adaptive Neighborhood Method without
Parameter k. Pattern Recognit. Lett. 80, 30-36.
ICORES 2020 - 9th International Conference on Operations Research and Enterprise Systems
226
