
Evaluation of Simulator Incorporating Non-equilibrium
Green’s Function and Improvement of Quantum Cascade
Lasers Output using the Simulator
Shigeyuki Takagi
1
, Hirotaka Tanimura
1a
, Tsutomu Kakuno
2
, Rei Hashimoto
2
,
Kei Kaneko
2
and Shinji Saito
2
1
Department of Electrical and Electronics Engineering, School of Engineering, Tokyo University of Technology,
1404-1 Katakura-cho, Hachioji-city, Tokyo, Japan
2
Corporate Manufacturing Engineering Center, Toshiba Corporation, 8 Shinisogo-cho, Isogo Ward,
Yokohama-city, Kanagawa, Japan
Keywords: Quantum Cascade Lasers, QCLs, Non-equilibrium Green’s Function, Electron Scattering, Quantum Well.
Abstract: We applied a simulator incorporating a non-equilibrium Green’s function (NEGF) to quantum cascade laser
(QCL) wavelength prediction, and confirmed its validity including its temperature dependence. In addition,
the electroluminescence (EL) intensity of the QCL was increased by a factor of 1.4 by including a structure
that made the light-emitting layer barrier thin calculated using the simulator. The NEGF is used to calculate
the electron density existing in the QCL and the laser gain. To examine the validity of wavelength calculation,
we calculated the oscillation wavelengths for the seven types of film structure in the 3 to 9 µm band in our
references, and compared them with the experimental results. As a result, the difference between them was
well below 0.36 µm. Furthermore, the film structure for increasing the gain was calculated on the basis of the
structure reported in one of the references. The gain was increased 1.17 to 1.28 times by reducing the
thicknesses of the barriers by 10%. The QCLs with this film structure were prototyped and their EL output
intensity was measured. It was confirmed that the EL output intensity output was improved and the film
structure design obtained using the simulator was effective.
1 INTRODUCTION
Quantum cascade lasers (QCLs) are n-type
semiconductor lasers in which two types of
semiconductor film are alternately stacked, and the
laser light in the infrared region can be obtained (Faist
et al., 1994). Conventional semiconductor lasers
(LDs) are limited to visible part of the spectrum and
infrared wavelengths below 3 μm. QCLs oscillate in
the infrared region, and the desired wavelength can be
obtained simply by changing the thickness of a
multilayer film using two kinds of materials.
Since the QCL wavelength is in the infrared
region, QCLs are expected to be applied in trace gas
analysis and remote gas detection. To realize this, a
QCL with a wavelength suitable for such
measurements is required. Furthermore, with such
trace substance detection and remote gas detection,
a
https://orcid.org/0000-0002-7653-4602
higher sensitivity is expected by increasing the
output. Since the amount of laser absorption is
measured in the detection of trace substances, it is
necessary for the laser to propagate a long optical
path. To develop a laser with such a high output and
a wavelength suitable for measurement, it is effective
to use a simulator that can predict the oscillation
wavelength and gain.
In the current simulators, the Schrödinger
equation is solved to calculate the wave function, and
the laser light intensity is calculated from the
lifetimes of the upper and lower levels and the
transition probabilities between the upper and lower
levels semi-classically (Jirauschek and Kubis, 2014).
On the other hand, in the calculation using a non-
equilibrium Green’s function (NEGF), the electron
density distribution and the transition of electrons
from the upper level to the lower level can be
58
Takagi, S., Tanimura, H., Kakuno, T., Hashimoto, R., Kaneko, K. and Saito, S.
Evaluation of Simulator Incorporating Non-equilibrium Green’s Function and Improvement of Quantum Cascade Lasers Output using the Simulator.
DOI: 10.5220/0009101100580063
In Proceedings of the 8th International Conference on Photonics, Optics and Laser Technology (PHOTOPTICS 2020), pages 58-63
ISBN: 978-989-758-401-5; ISSN: 2184-4364
Copyright
c
2022 by SCITEPRESS – Science and Technology Publications, Lda. All rights reserved
calculated quantum mechanically. Furthermore, by
determining the self-energy of electron scattering, we
can easily add the effect of electron scattering on the
electron distribution. Not only can the gain be
calculated accurately, it is also possible to reflect the
effects of operating temperature and film stress.
Then, we introduced a simulator that incorporates
NEGF for the calculation of electron density (Grange,
2015). Oscillation wavelengths were calculated for
structures with wavelengths of 3 to 9 µm reported so
far, and compared with the wavelengths actually
measured in previous study. To investigate the
temperature dependence of the simulator, the
oscillation wavelength from 77 to 293K was
calculated for a film structure QCL with an oscillation
wavelength of 4 µm, and the temperature dependence
was consistent with the wavelength of the prototype
QCL. Furthermore, the active layer was designed to
increase the gain using a simulator, and it was shown
that the output could be improved by reducing the
barrier of the light-emitting layer. As a result of
evaluating the QCL with this structure, the EL
emission intensity was increased 1.4-fold compared
with the previous structure QCL, and it was shown
that the simulator design method is effective for the
structure design of QCLs.
2 SIMULATOR
INCORPORATING NEGF
2.1 Composition of Simulator
Nextnano.QCL (Nextnano GmbH) was used for
calculating the oscillation wavelength of QCLs.
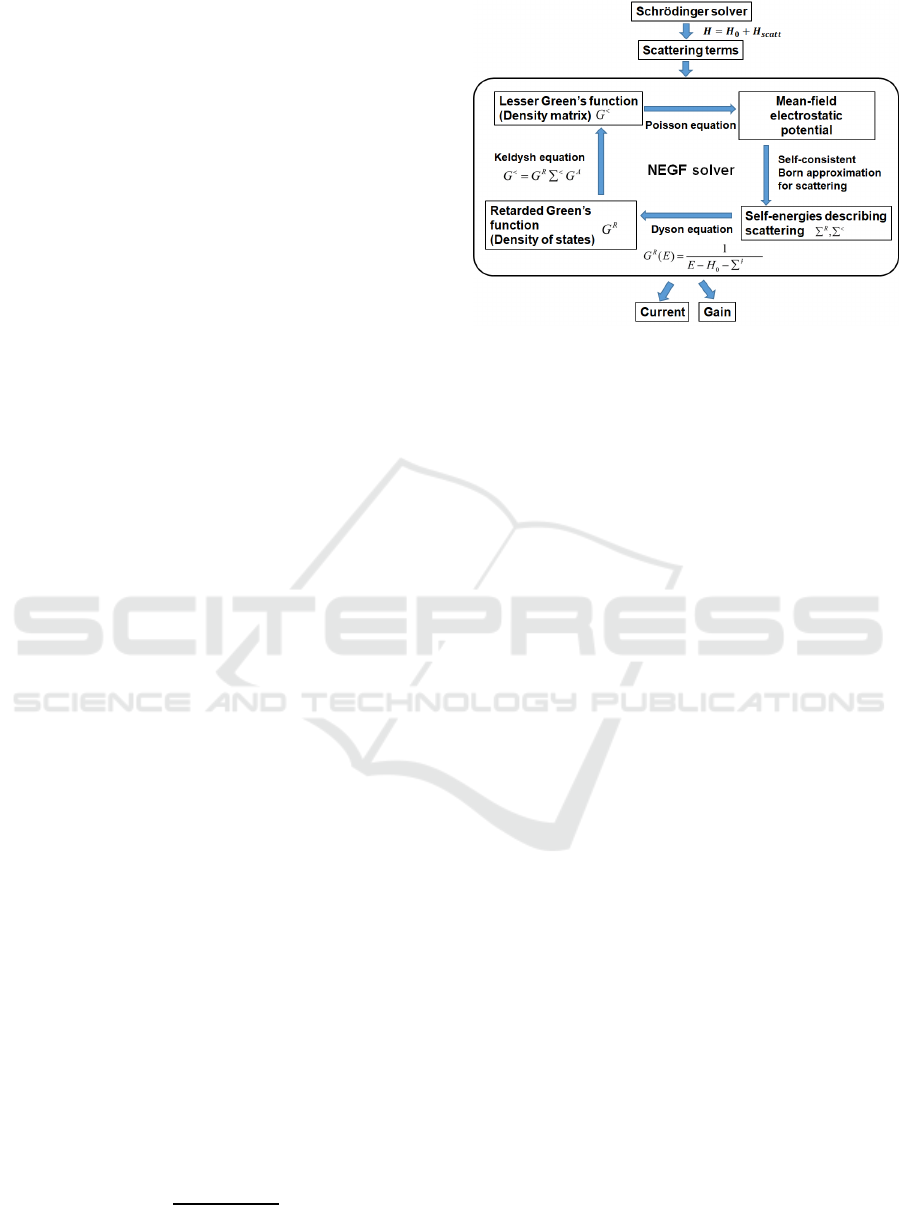
Figure 1 shows the calculation flow in the simulator.
Assuming that the unperturbed Hamiltonian is H
o
and
the electron scattering is the perturbation term
Hamiltonian H
scatt
in the Schrödinger equation, the
Hamiltonian H is expressed by Eq. (1).
H = H
o
+ H
s
cat
t
(1)
Next, the Poisson equation is solved to find the
mean-field electrostatic potential, and the retarded
self-energy Σ
R
and the lesser self-energy Σ
<
describing electron scattering are calculated. The
density of States (DOS) is obtained from the retarded
Green’s function G
R
using the Dyson equation shown
in Eq. (2).
1
Σ
(2)
Figure 1: Calculation flow of NEGF simulator.
Using the Keldysh equation shown in Eq. (3), we
obtained the electron density matrix from the lesser
Green’s function G
<
,
Σ
,
(3)
where G
A
is an advanced Green’s function. In the
NEGF, the above calculations are repeated until G
<
converges below the set threshold. That is, G
<
is
obtained by a self-consistent method. On the basis of
the obtained electron density matrix, the current and
the gain of the QCL are calculated.
From a series of calculations, the relationship
between the energy (wavelength) and the gain is
calculated. The oscillation wavelength of the laser is
determined as the wavelength that maximizes the
gain. By using the NEGF, we can add the effects such
as the crystal lattice and electron scattering to the
simulation. In this way, it is possible to perform the
calculation while taking into consideration of the
influence on the film stress and electrons scattering to
the crystal lattice corresponding to the operating
temperature of the QCL.
2.2 Structure and Oscillation
Wavelength
We selected seven papers in which oscillation in the
3 to 9 μm band was reported (Kirch et al, 2015, Yu et
al., 2010, Wang et al, 2009, Faist et al., 1996, Evans
et al., 2007, Faist et al., 1998, Aldukhayel et al.,
2009), and the oscillation wavelength in each film
structure was calculated using the simulator. The
wavelengths in the references and those obtained by
simulation are shown in Fig. 2. The left side of the
dotted line is the material InAlAs/InGaAs, and the
right side (G) is the film material AlAs(Sb) / InGaAs.
The differences between the simulations and the
Evaluation of Simulator Incorporating Non-equilibrium Green’s Function and Improvement of Quantum Cascade Lasers Output using the
Simulator
59

experiment are less than 0.4 μm except for B of 0.59
in the QCL with the film material InAlAs/InGaAs. In
the case of G, the difference is 0.045 μm, and it is
shown that the calculated values reproduce the
experimental values well even if the film material is
changed.
A: Kirch, D. et al. “Highly temperature insensitive, low threshold-
current density (λ = 8.7–8.8 μm) quantum cascade lasers”
B: Yu, J S. et al. “Injector doping level-dependent continuous-wave
operation of InP-based QCLs at λ ~ 7.3 μm above room
temperature”
C: Wang, C. et al. ”Mode-locked pulses from mid-infrared
quantum cascade lasers”
D: Faist, J. et al. ”High power mid-infrared (λ ~ 5 μm) quantum
cascade lasers operating above room temperature”
E: Evans, A. et al. “Buried heterostructure quantum cascade lasers
with high continuous-wave wall plug efficiency”
F: Faist, J. et al. “Short wavelength quantum cascade laser based
on strained compensated InGaAs/AlInAs”
G: Aldukhayel, A. et al. “Investigations of carrier scattering into L-
valley in λ = 3.5 μm InGaAs/AlAs(Sb) quantum cascade lasers
using high hydrostatic pressure”
Figure 2: Comparison of wavelengths reported in papers
and wavelengths obtained by simulation.
In parallel with the simulation, we fabricated two
QCLs with an oscillation wavelength in the 4 μm
band. The QCL has 30 cycles of active layers, whose
structure is the same as that used by Evans et al. The
device length is 4 mm and the ridge width is 12 μm.
The QCLs were operated at 100 kHz with a pulse
width of 300 ns at room temperature (293 K). The
oscillation wavelength of the prototype QCL is shown
in Fig. 3 (a). The two prototype devices oscillated at
wavelengths of 4.41 and 4.90 μm, respectively. The
differences between the calculated wavelengths and
the measured wavelengths, including our
experimental results, are within 0.36 μm. The output
characteristics of the QCL with an oscillation
wavelength of 4.41 μm are shown in Fig. 3 (b). A
peak output of about 400mW is obtained.
Figure 3: QCL output characteristics (a) and oscillation
wavelength (b).
2.3 Temperature Dependence
To investigate the temperature dependence of the
simulation results, the operating temperature was
changed from 84 to 241 K in the simulation. The
temperature dependence was also measured with our
QCL with an oscillation wavelength of 4.41 µm
fabricated as described in Sec 2.2. The simulation
results were compared with the experimental results of
the prototype QCL and the measurement results Wen
et al., 2011) of Wen et al. The active layer structures
are all the same as those used by Evans et al. The
temperature ranges at which the oscillation wavelength
was measured are from 84 to 241 K in the work by Wen
et al. and from 77 to 294 K in our experiment.
The simulation results, our experimental results,
and the results of Wen et al. are shown in Fig. 4. The
oscillation wavelength of the simulation is slightly
longer than those obtained by Wen et al. and with our
prototype QCL. The simulation results reproduce the
tendency that the wavelength increases with
increasing temperature. The change in wavelength
with the temperature (the tuning coefficient of the
wavelength) is as follows. The tuning coefficients are
0.58 nm/K in the simulation, 0.81 in the experiment
by Wen et al. and 0.50 nm/K in our experiment. The
tuning coefficients in the simulations are between that
obtained by Wen et al. and that obtained with our
QCL, and the temperature dependence of the QCL
oscillation wavelength can be well reproduced.
PHOTOPTICS 2020 - 8th International Conference on Photonics, Optics and Laser Technology
60
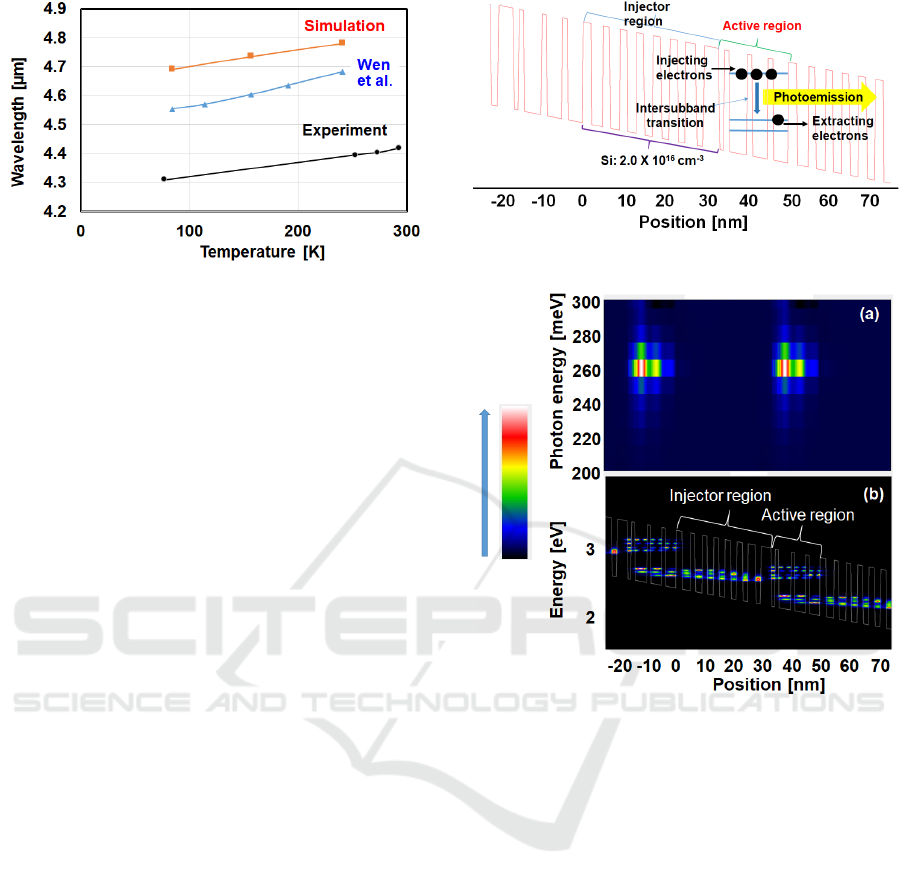
Figure 4: Wavelength dependence on operating
temperature.
3 HIGH QCL OUTPUT USING
SIMULATOR
3.1 Investigation of High Output by
Simulation
Since it was found that the wavelength can be
calculated accurately by our simulator as shown in
Sec 2.2, we attempted to design a high-power active
region for QCLs using this simulator. The design was
based on the structure shown in Fig. 5 (Evans et al.,
2007). The material is Ga
0.331
In
0.669
As for the wells
and Al
0.638
In
0.362
As for the barriers. In this structure,
one period consists of 22 layers, the injection region
is from the 1st to 14th layers, and the active region is
from the 15th to 22nd layers. The injection region is
doped with 2.0 10
16
cm
−3
Si. Electrons are injected
from the injection region into the upper subband of
the active region, and they drop to the lower subband
through the intersubband transition. Photoemission
occurs at that time. This structure is denoted as
APL91. Many cases were calculated while adjusting
parameters related to net strain, calculation range, and
convergence condition.
Figure 6 shows the gain contour diagram and DOS
for APL91. The maximum gain of 91.33968 cm
-1
with
a photon energy of 260 meV (wavelength of 4.767 μm)
can be seen in the second well of the active region
(around the horizontal axis of -10, 40 nm) in the gain
contour diagram. Since the experimental wavelength is
4.705 μm, the calculated value is in good agreement
with the experimental one. In the DOS diagram, the
DOS is larger in the well next to the thick barrier of the
injection region. Electrons are injected from this well
into the active region. In addition, large values of DOS
are distributed in the upper and the lower subbands of
the active region. Strong luminescence is generated by
these DOS distributions.
Figure 5: Conduction band of APL91.
Figure 6: Gain contours (a) and density of states (b) of
APL91.
First, simulations with various parameters were
performed on the basis of physical considerations.
The film structure with the noticeable change in gain
was the structure in which the thicknesses of the
barriers in the active region were varied. The
calculated gains of this design are shown in Fig. 7.
When the barriers in the active region were made
thinner, the gain increased, and a maximum gain that
is 1.61 times that in APL91 was seen. On the other
hand, in the structures in which the thicknesses of
barriers are increased, the gains are lower than those
in APL91.
High outputs can be expected from “the structure
with thin barriers in the active region”, but if the
structure is markedly changed, fabricating the
prototype becomes difficult. Figure 8 shows the net
strain of the structures in which the barrier thicknesses
of the active region are varied. Since the net strain
increases as the thickness decreases, the wavelength
was calculated for a structure with 10 % thinner
barriers and a structure with 10 % thicker barriers.
Evaluation of Simulator Incorporating Non-equilibrium Green’s Function and Improvement of Quantum Cascade Lasers Output using the
Simulator
61
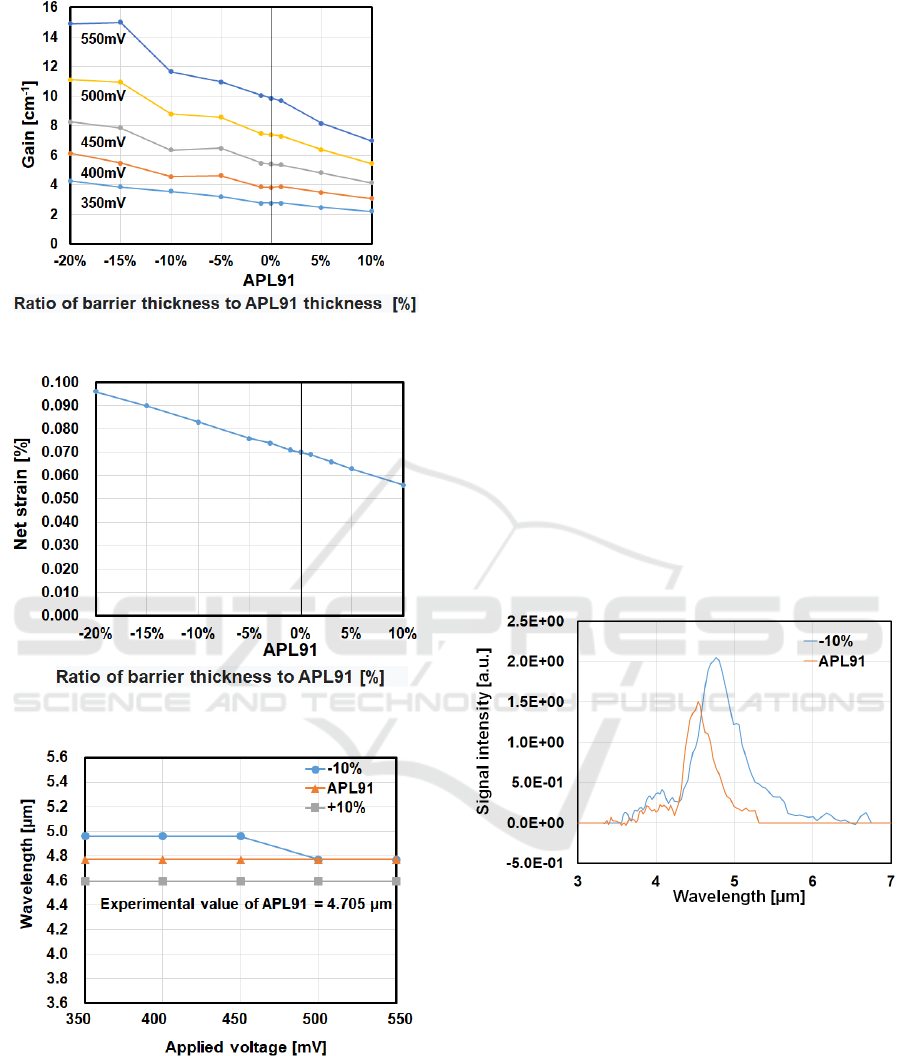
Figure 7: Dependence of gain on barrier film thickness.
Figure 8: Dependence of net stress on barrier film thickness.
Figure 9: Oscillation wavelength dependence on barrier
film thickness.
Figure 9 shows the calculated wavelengths. The
structure with 10% thinner barriers in the active
region had a slightly longer wavelength than APL91.
This is because the difference in energy between
quantum levels contributing to photoemission
became narrow owing to the decreased thickness of
the barriers. On the other hand, the wavelength was
shortened in the structure with 10% thicker barriers in
the active region, because the energy difference of the
quantum levels that contributes to photoemission
became wide with increasing thickness of the barriers
in the active region.
3.2 Characteristics of Laser Output
On the basis of calculation results, we fabricated
devices for measuring EL with 10 % thinner barriers
(10% device) in the active region. The device length
is 4 mm and the ridge width is 15 μm. The device is
mounted on an NS mount by In evaporation and flux
without a submount. The device was operated at a
frequency of 100 kHz, a pulse width of 300nm (duty
3%), and a cooling temperature of 273 K.
Figure 10 shows the EL spectra of the prototypes.
The horizontal axis represents wavelength and the
vertical axis represents EL intensity. Good emission
was observed in the 10 % EL device. The emission
wavelength is about 4.8 µm, which is in good
agreement with the calculated value in Fig. 9. We also
observed that the EL intensity of the 10 % device
was 1.4 times that of APL91.
Figure 10: EL spectra of APL91 and prototype with 10 %
thinner barriers.
4 CONCLUSIONS
We calculated the QCL wavelengths and the
temperature dependence of the wavelength with a
simulator using NEGF, and compared them with the
experimental results reported in the literatures and our
prototype QCLs. The difference between the
oscillation wavelength of QCL and the oscillation
wavelength obtained by the simulation was less than
0.36µm, and the wavelength dependences on the
PHOTOPTICS 2020 - 8th International Conference on Photonics, Optics and Laser Technology
62

active layer structure and the operating temperature
were in good agreement with those obtained in the
experiments in the references and those obtained with
our QCLs.
Furthermore, the active layer was designed to
increase the gain using a simulator, and it was shown
that the output could be improved by reducing the
barrier thicknesses in the active layer. We fabricated
QCLs with this structure and evaluated their output
wavelength and power. As a result, the EL emission
intensity was increased to 1.4 times that of the
previous structure QCL, and it was shown that the
simulator design method is effective for the structure
design of QCLs.
ACKNOWLEDGEMENTS
This work was supported by Innovative Science and
Technology Initiative for Security, ATLA, Japan.
REFERENCES
Faist, J., Capasso, F., Sivco, D. L., Sirtori, C., Hutchinson,
A., & Cho, A. Y. (1994). Quantum cascade laser.
Science, 264, 553–556.
Jirauschek, C., & Kubis, T. (2014). Modeling techniques
for quantum cascade lasers. Appl. Phys. Rev., 1, 011307.
Grange, T. (2015). Contrasting influence of charged
impurities on transport and gain in terahertz quantum
cascade lasers. Phys. Rev. B, 92, 241306–31–5.
Kirch, D., Chang, C.-C., Boyle, C., Mawst, L. J., Lindberg,
D., Earles, T., & Botez, D. (2015). Highly temperature
insensitive, low threshold-current density (λ = 8.7–8.8
μm) quantum cascade lasers. Appl. Phys. Lett., 106,
151106–1–5.
Yu, J. S., Slivken, S., & Razeghi, M. (2010). Injector
doping level-dependent continuous-wave operation of
InP-based QCLs at λ ~ 7.3 μm above room temperature.
Semicond. Sci. Technol., 25, 125015–1–5.
Wang, C. Y., Kuznetsova, L., Gkortsas, V. M., Diehl, L.,
Kärtner F. X., Belkin, M. A., Belyanin, A., Li, X., Ham,
D., Schneider, H., Grant, P., Song, C. Y., Haffouz, S.,
Wasilewski, Z. R., Liu, H. C., & Capasso, F. (2009).
Mode-locked pulses from mid-infrared quantum
cascade lasers. Opt. Express, 17 (15), 12929–12943.
Faist, J., Capasso, F., Sirtori, C., Sivco, D. L., Baillargeon,
J. N., Hutchinson, A. L., Chu, S. N. G., & Cho, A. Y.
(1996). High power mid-infrared (λ ~ 5 μm) quantum
cascade lasers operating above room temperature. Appl.
Phys. Lett., 68, 3680–3682.
Evans, A., Darvish, S. R., Slivken, S., Nguyen, J., Bai, Y.,
& Razeghi, M. (2007). Buried heterostructure quantum
cascade lasers with high continuous-wave wall plug
efficiency. Appl. Phys. Lett., 91, 071101–1–3.
Faist, J., Capasso, F., Sivco, D. L., Hutchinson, A. L., Chu,
S.-N. G., & Cho, A. Y. (1998). Short wavelength
quantum cascade laser based on strained compensated
InGaAs/AlInAs. Appl. Phys. Lett., 72, 680–682.
Aldukhayel, A., Jin, S. R., Marko, I. P., Zhang, S. Y., Revin,
D. G., Cockburn, J. W., & Sweeney, S. J. (2013).
Investigations of carrier scattering into L-valley in λ =
3.5 μm InGaAs/AlAs(Sb) quantum cascade lasers using
high hydrostatic pressure. Phys. Status Solidi B, 250
(4), 693–697.
Wen, Y., Quanyong, L., Wanfeng, L., Jinchuan, Z., Lijun,
W., Junqi, L., Lu, L., Fengqi, L., & Zhanguo, W.
(2011). Porous waveguide facilitated low divergence
quantum cascade laser. Semicond., 32 (6), 064008.
Evaluation of Simulator Incorporating Non-equilibrium Green’s Function and Improvement of Quantum Cascade Lasers Output using the
Simulator
63
